Air Pollution in Taiyuanshi: Real-time Air Quality Index and smog alert.
Pollution and air quality forecast for Taiyuanshi. Today is Sunday, June 21, 2026. The following air pollution values have been recorded for Taiyuanshi:- particulate matter (PM2.5) dust - 61 (Unhealthy)
- nitrogen dioxide (NO2) - 22 (Good)
- particulate matter (PM10) suspended dust - 69 (Unhealthy for Sensitive Groups)
- carbon monoxide (CO) - 219 (Good)
- ozone (O3) - 0 (Good)
- sulfur dioxide (SO2) - 8 (Good)

What is the air quality in Taiyuanshi today? Is the air polluted in Taiyuanshi?. Is there smog?
What is the current level of PM2.5 in Taiyuanshi? (particulate matter (PM2.5) dust)
Today's PM2.5 level is:
61 (Unhealthy)
For comparison, the highest level of PM2.5 in Taiyuanshi in the last 7 days was: 28 (Friday, May 27, 2022) and the lowest: 28 (Friday, May 27, 2022).
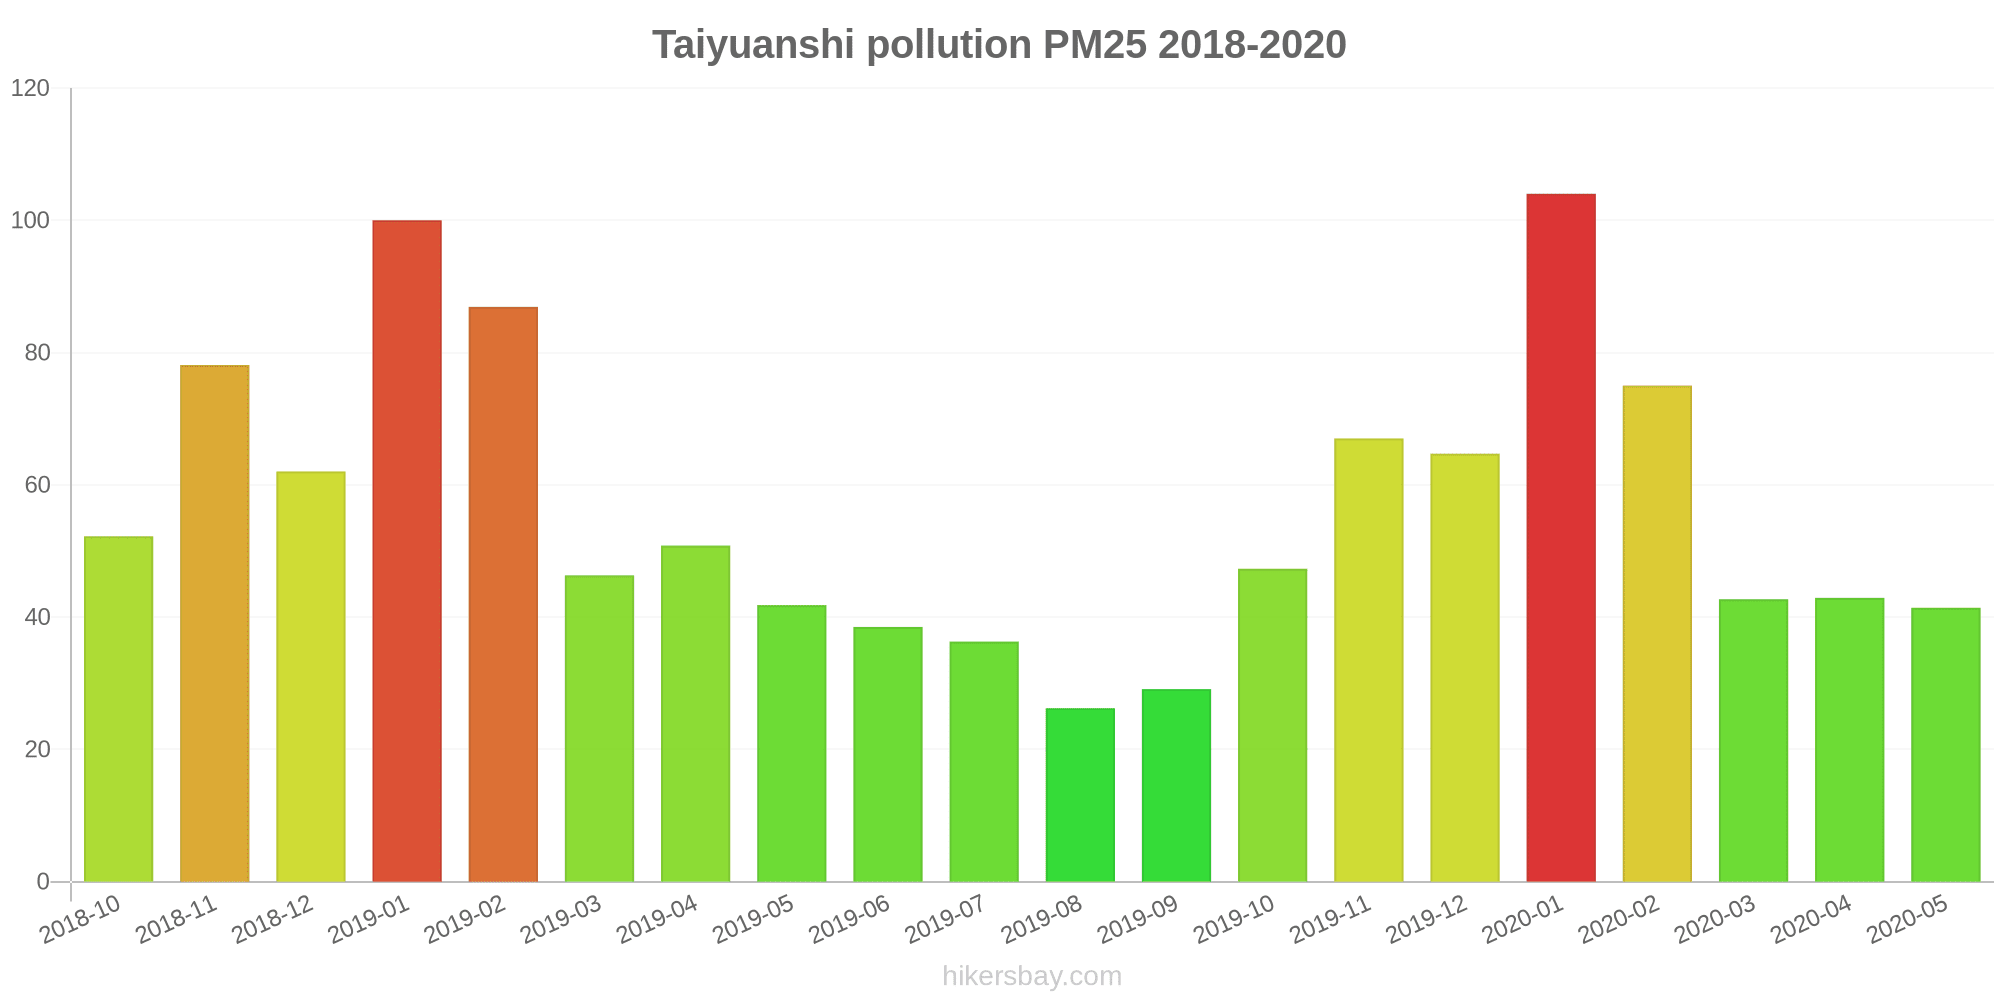
The highest PM2.5 values were recorded: 104 (January 2020).
The lowest level of particulate matter PM2.5 pollution occurs in month: August (26).
How high is the level of NO2? (nitrogen dioxide (NO2))
22 (Good)
What is the level of PM10 today in Taiyuanshi? (particulate matter (PM10) suspended dust)
The current level of particulate matter PM10 in Taiyuanshi is:
69 (Unhealthy for Sensitive Groups)
The highest PM10 values usually occur in month: 173 (January 2019).
The lowest value of particulate matter PM10 pollution in Taiyuanshi is usually recorded in: August (50).
How high is the CO level? (carbon monoxide (CO))
219 (Good)
How is the O3 level today in Taiyuanshi? (ozone (O3))
0 (Good)
What is the level of SO2 pollution? (sulfur dioxide (SO2))
8 (Good)
Current data Friday, May 27, 2022, 3:00 PM
PM2,5 61 (Unhealthy)
NO2 22 (Good)
PM10 69 (Unhealthy for Sensitive Groups)
CO 219 (Good)
O3 0 (Good)
SO2 8 (Good)
Data on air pollution from recent days in Taiyuanshi
index
2022-05-27
pm25
28
Moderate
no2
22
Good
pm10
35
Moderate
co
579
Good
o3
22
Good
so2
5
Good
data source »
Air pollution in Taiyuanshi from October 2018 to May 2020

index
2020-05
2020-04
2020-03
2020-02
2020-01
2019-12
2019-11
2019-10
2019-09
2019-08
2019-07
2019-06
2019-05
2019-04
2019-03
2019-02
2019-01
2018-12
2018-11
2018-10
pm25
41 (Unhealthy for Sensitive Groups)
43 (Unhealthy for Sensitive Groups)
43 (Unhealthy for Sensitive Groups)
75 (Very Unhealthy)
104 (Very Unhealthy)
65 (Unhealthy)
67 (Unhealthy)
47 (Unhealthy for Sensitive Groups)
29 (Moderate)
26 (Moderate)
36 (Unhealthy for Sensitive Groups)
39 (Unhealthy for Sensitive Groups)
42 (Unhealthy for Sensitive Groups)
51 (Unhealthy for Sensitive Groups)
46 (Unhealthy for Sensitive Groups)
87 (Very Unhealthy)
100 (Very Unhealthy)
62 (Unhealthy)
78 (Very Unhealthy)
52 (Unhealthy for Sensitive Groups)
co
741 (Good)
728 (Good)
717 (Good)
1 (Good)
1 (Good)
1 (Good)
1 (Good)
986 (Good)
916 (Good)
862 (Good)
1 (Good)
876 (Good)
760 (Good)
997 (Good)
944 (Good)
1 (Good)
1 (Good)
1 (Good)
1 (Good)
909 (Good)
no2
38 (Good)
48 (Moderate)
42 (Moderate)
40 (Good)
57 (Moderate)
57 (Moderate)
59 (Moderate)
53 (Moderate)
52 (Moderate)
36 (Good)
38 (Good)
39 (Good)
47 (Moderate)
53 (Moderate)
48 (Moderate)
50 (Moderate)
74 (Moderate)
60 (Moderate)
68 (Moderate)
58 (Moderate)
o3
167 (Unhealthy)
133 (Unhealthy for Sensitive Groups)
106 (Moderate)
88 (Moderate)
65 (Good)
51 (Good)
58 (Good)
95 (Moderate)
140 (Unhealthy for Sensitive Groups)
157 (Unhealthy)
210 (Very Unhealthy)
210 (Very Unhealthy)
159 (Unhealthy)
128 (Unhealthy for Sensitive Groups)
114 (Moderate)
82 (Moderate)
49 (Good)
47 (Good)
64 (Good)
91 (Moderate)
pm10
95 (Unhealthy)
94 (Unhealthy)
87 (Unhealthy)
105 (Unhealthy)
136 (Very Unhealthy)
106 (Unhealthy)
121 (Very Unhealthy)
98 (Unhealthy)
62 (Unhealthy for Sensitive Groups)
50 (Moderate)
63 (Unhealthy for Sensitive Groups)
72 (Unhealthy for Sensitive Groups)
104 (Unhealthy)
124 (Very Unhealthy)
103 (Unhealthy)
136 (Very Unhealthy)
173 (Very bad Hazardous)
139 (Very Unhealthy)
158 (Very bad Hazardous)
115 (Very Unhealthy)
so2
12 (Good)
13 (Good)
18 (Good)
25 (Good)
31 (Good)
30 (Good)
24 (Good)
14 (Good)
12 (Good)
9.2 (Good)
10 (Good)
13 (Good)
15 (Good)
16 (Good)
21 (Good)
37 (Good)
54 (Moderate)
41 (Good)
28 (Good)
16 (Good)
data source »
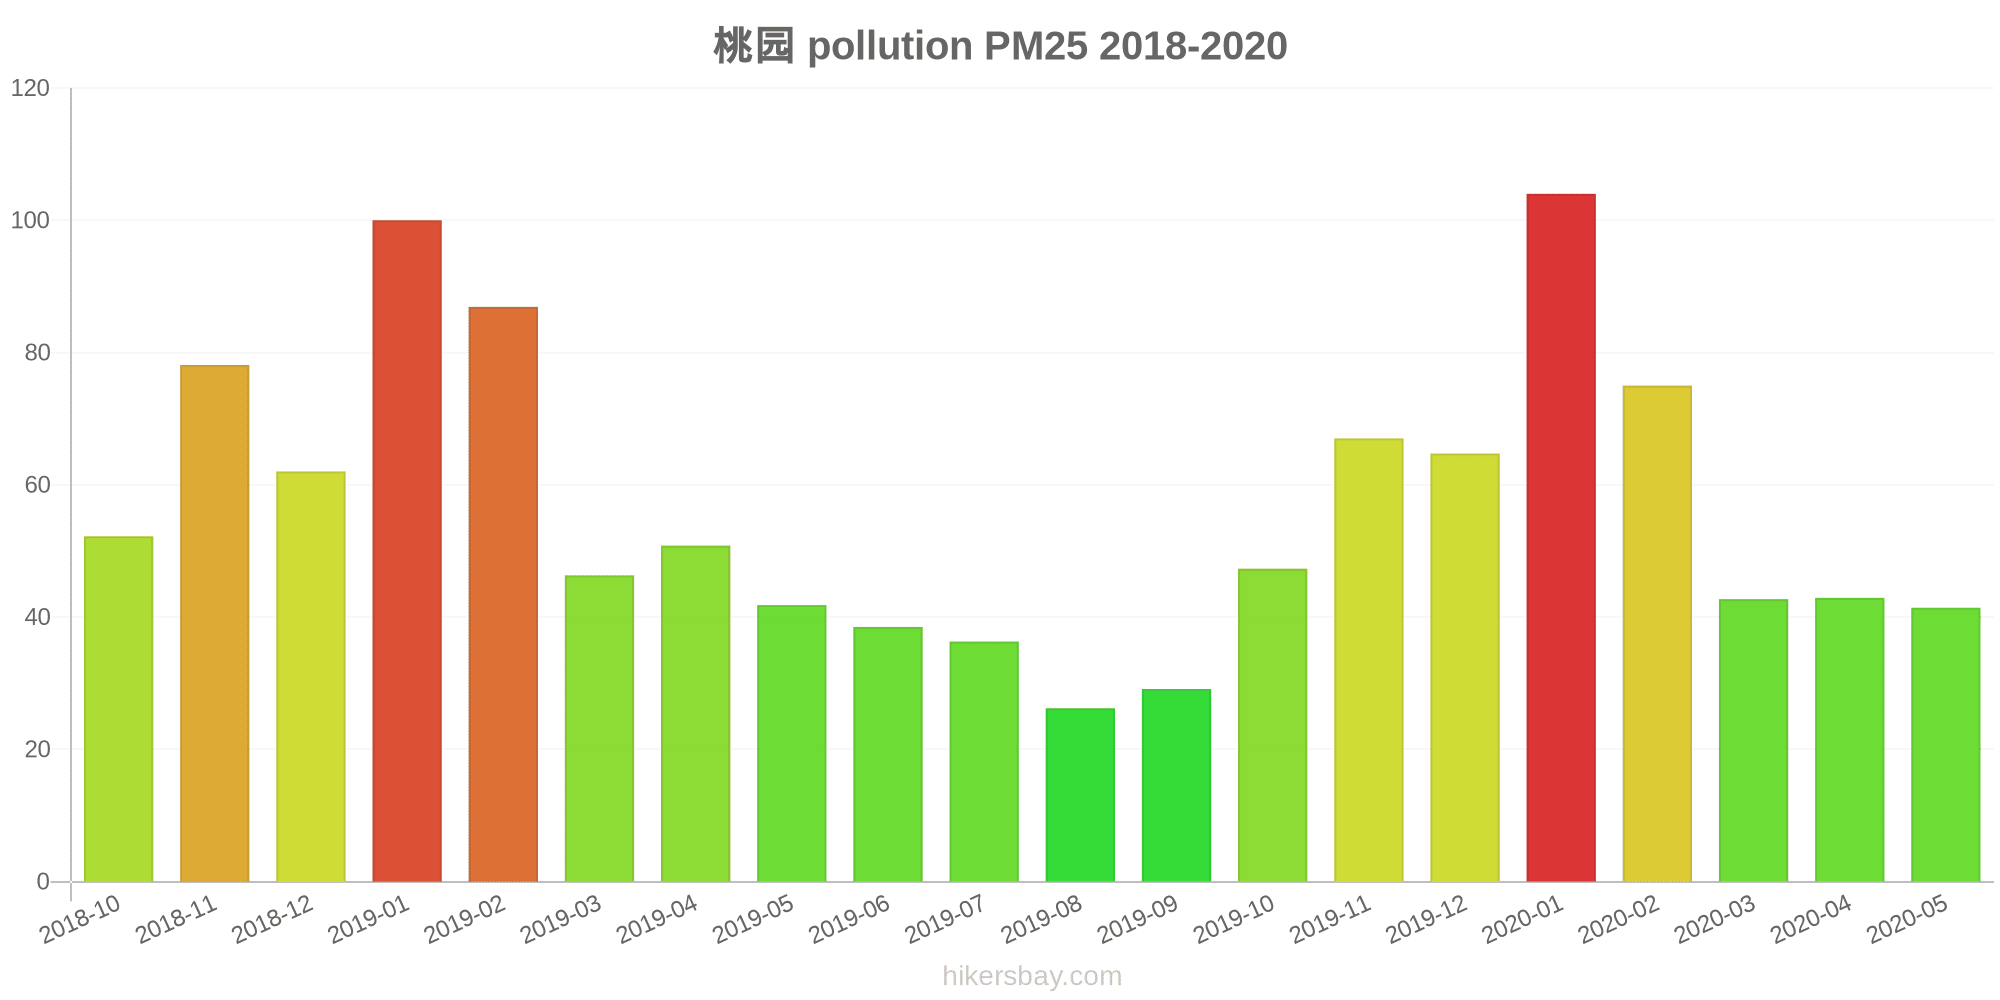
桃园
Friday, May 27, 2022, 3:00 PM
PM2,5 61 (Unhealthy)
particulate matter (PM2.5) dust
NO2 22 (Good)
nitrogen dioxide (NO2)
PM10 69 (Unhealthy for Sensitive Groups)
particulate matter (PM10) suspended dust
CO 219 (Good)
carbon monoxide (CO)
O3 0.05 (Good)
ozone (O3)
SO2 7.7 (Good)
sulfur dioxide (SO2)
桃园
index
2022-05-27
pm25
28
no2
22
pm10
35
co
579
o3
22
so2
4.6
桃园
2018-10 2020-05

index
2020-05
2020-04
2020-03
2020-02
2020-01
2019-12
2019-11
2019-10
2019-09
2019-08
2019-07
2019-06
2019-05
2019-04
2019-03
2019-02
2019-01
2018-12
2018-11
2018-10
pm25
41
43
43
75
104
65
67
47
29
26
36
39
42
51
46
87
100
62
78
52
co
741
728
717
1
1
1
1
986
916
862
1
876
760
997
944
1
1
1
1
909
no2
38
48
42
40
57
57
59
53
52
36
38
39
47
53
48
50
74
60
68
58
o3
167
133
106
88
65
51
58
95
140
157
210
210
159
128
114
82
49
47
64
91
pm10
95
94
87
105
136
106
121
98
62
50
63
72
104
124
103
136
173
139
158
115
so2
12
13
18
25
31
30
24
14
12
9.2
10
13
15
16
21
37
54
41
28
16
* Pollution data source:
https://openaq.org
(ChinaAQIData)
The data is licensed under CC-By 4.0
PM2,5 61 (Unhealthy)
NO2 22 (Good)
PM10 69 (Unhealthy for Sensitive Groups)
CO 219 (Good)
O3 0 (Good)
SO2 8 (Good)
Data on air pollution from recent days in Taiyuanshi
| index | 2022-05-27 |
|---|---|
| pm25 | 28 Moderate |
| no2 | 22 Good |
| pm10 | 35 Moderate |
| co | 579 Good |
| o3 | 22 Good |
| so2 | 5 Good |
| index | 2020-05 | 2020-04 | 2020-03 | 2020-02 | 2020-01 | 2019-12 | 2019-11 | 2019-10 | 2019-09 | 2019-08 | 2019-07 | 2019-06 | 2019-05 | 2019-04 | 2019-03 | 2019-02 | 2019-01 | 2018-12 | 2018-11 | 2018-10 |
|---|---|---|---|---|---|---|---|---|---|---|---|---|---|---|---|---|---|---|---|---|
| pm25 | 41 (Unhealthy for Sensitive Groups) | 43 (Unhealthy for Sensitive Groups) | 43 (Unhealthy for Sensitive Groups) | 75 (Very Unhealthy) | 104 (Very Unhealthy) | 65 (Unhealthy) | 67 (Unhealthy) | 47 (Unhealthy for Sensitive Groups) | 29 (Moderate) | 26 (Moderate) | 36 (Unhealthy for Sensitive Groups) | 39 (Unhealthy for Sensitive Groups) | 42 (Unhealthy for Sensitive Groups) | 51 (Unhealthy for Sensitive Groups) | 46 (Unhealthy for Sensitive Groups) | 87 (Very Unhealthy) | 100 (Very Unhealthy) | 62 (Unhealthy) | 78 (Very Unhealthy) | 52 (Unhealthy for Sensitive Groups) |
| co | 741 (Good) | 728 (Good) | 717 (Good) | 1 (Good) | 1 (Good) | 1 (Good) | 1 (Good) | 986 (Good) | 916 (Good) | 862 (Good) | 1 (Good) | 876 (Good) | 760 (Good) | 997 (Good) | 944 (Good) | 1 (Good) | 1 (Good) | 1 (Good) | 1 (Good) | 909 (Good) |
| no2 | 38 (Good) | 48 (Moderate) | 42 (Moderate) | 40 (Good) | 57 (Moderate) | 57 (Moderate) | 59 (Moderate) | 53 (Moderate) | 52 (Moderate) | 36 (Good) | 38 (Good) | 39 (Good) | 47 (Moderate) | 53 (Moderate) | 48 (Moderate) | 50 (Moderate) | 74 (Moderate) | 60 (Moderate) | 68 (Moderate) | 58 (Moderate) |
| o3 | 167 (Unhealthy) | 133 (Unhealthy for Sensitive Groups) | 106 (Moderate) | 88 (Moderate) | 65 (Good) | 51 (Good) | 58 (Good) | 95 (Moderate) | 140 (Unhealthy for Sensitive Groups) | 157 (Unhealthy) | 210 (Very Unhealthy) | 210 (Very Unhealthy) | 159 (Unhealthy) | 128 (Unhealthy for Sensitive Groups) | 114 (Moderate) | 82 (Moderate) | 49 (Good) | 47 (Good) | 64 (Good) | 91 (Moderate) |
| pm10 | 95 (Unhealthy) | 94 (Unhealthy) | 87 (Unhealthy) | 105 (Unhealthy) | 136 (Very Unhealthy) | 106 (Unhealthy) | 121 (Very Unhealthy) | 98 (Unhealthy) | 62 (Unhealthy for Sensitive Groups) | 50 (Moderate) | 63 (Unhealthy for Sensitive Groups) | 72 (Unhealthy for Sensitive Groups) | 104 (Unhealthy) | 124 (Very Unhealthy) | 103 (Unhealthy) | 136 (Very Unhealthy) | 173 (Very bad Hazardous) | 139 (Very Unhealthy) | 158 (Very bad Hazardous) | 115 (Very Unhealthy) |
| so2 | 12 (Good) | 13 (Good) | 18 (Good) | 25 (Good) | 31 (Good) | 30 (Good) | 24 (Good) | 14 (Good) | 12 (Good) | 9.2 (Good) | 10 (Good) | 13 (Good) | 15 (Good) | 16 (Good) | 21 (Good) | 37 (Good) | 54 (Moderate) | 41 (Good) | 28 (Good) | 16 (Good) |
PM2,5 61 (Unhealthy)
particulate matter (PM2.5) dustNO2 22 (Good)
nitrogen dioxide (NO2)PM10 69 (Unhealthy for Sensitive Groups)
particulate matter (PM10) suspended dustCO 219 (Good)
carbon monoxide (CO)O3 0.05 (Good)
ozone (O3)SO2 7.7 (Good)
sulfur dioxide (SO2)桃园
| index | 2022-05-27 |
|---|---|
| pm25 | 28 |
| no2 | 22 |
| pm10 | 35 |
| co | 579 |
| o3 | 22 |
| so2 | 4.6 |
桃园
| index | 2020-05 | 2020-04 | 2020-03 | 2020-02 | 2020-01 | 2019-12 | 2019-11 | 2019-10 | 2019-09 | 2019-08 | 2019-07 | 2019-06 | 2019-05 | 2019-04 | 2019-03 | 2019-02 | 2019-01 | 2018-12 | 2018-11 | 2018-10 |
|---|---|---|---|---|---|---|---|---|---|---|---|---|---|---|---|---|---|---|---|---|
| pm25 | 41 | 43 | 43 | 75 | 104 | 65 | 67 | 47 | 29 | 26 | 36 | 39 | 42 | 51 | 46 | 87 | 100 | 62 | 78 | 52 |
| co | 741 | 728 | 717 | 1 | 1 | 1 | 1 | 986 | 916 | 862 | 1 | 876 | 760 | 997 | 944 | 1 | 1 | 1 | 1 | 909 |
| no2 | 38 | 48 | 42 | 40 | 57 | 57 | 59 | 53 | 52 | 36 | 38 | 39 | 47 | 53 | 48 | 50 | 74 | 60 | 68 | 58 |
| o3 | 167 | 133 | 106 | 88 | 65 | 51 | 58 | 95 | 140 | 157 | 210 | 210 | 159 | 128 | 114 | 82 | 49 | 47 | 64 | 91 |
| pm10 | 95 | 94 | 87 | 105 | 136 | 106 | 121 | 98 | 62 | 50 | 63 | 72 | 104 | 124 | 103 | 136 | 173 | 139 | 158 | 115 |
| so2 | 12 | 13 | 18 | 25 | 31 | 30 | 24 | 14 | 12 | 9.2 | 10 | 13 | 15 | 16 | 21 | 37 | 54 | 41 | 28 | 16 |