Air Pollution in Dadongliu: Real-time Air Quality Index and smog alert.
Pollution and air quality forecast for Dadongliu. Today is Tuesday, June 16, 2026. The following air pollution values have been recorded for Dadongliu:- particulate matter (PM2.5) dust - 61 (Unhealthy)
- nitrogen dioxide (NO2) - 22 (Good)
- particulate matter (PM10) suspended dust - 69 (Unhealthy for Sensitive Groups)
- carbon monoxide (CO) - 219 (Good)
- ozone (O3) - 0 (Good)
- sulfur dioxide (SO2) - 8 (Good)

What is the air quality in Dadongliu today? Is the air polluted in Dadongliu?. Is there smog?
What is the current level of PM2.5 in Dadongliu? (particulate matter (PM2.5) dust)
Today's PM2.5 level is:
61 (Unhealthy)
For comparison, the highest level of PM2.5 in Dadongliu in the last 7 days was: 28 (Friday, May 27, 2022) and the lowest: 28 (Friday, May 27, 2022).
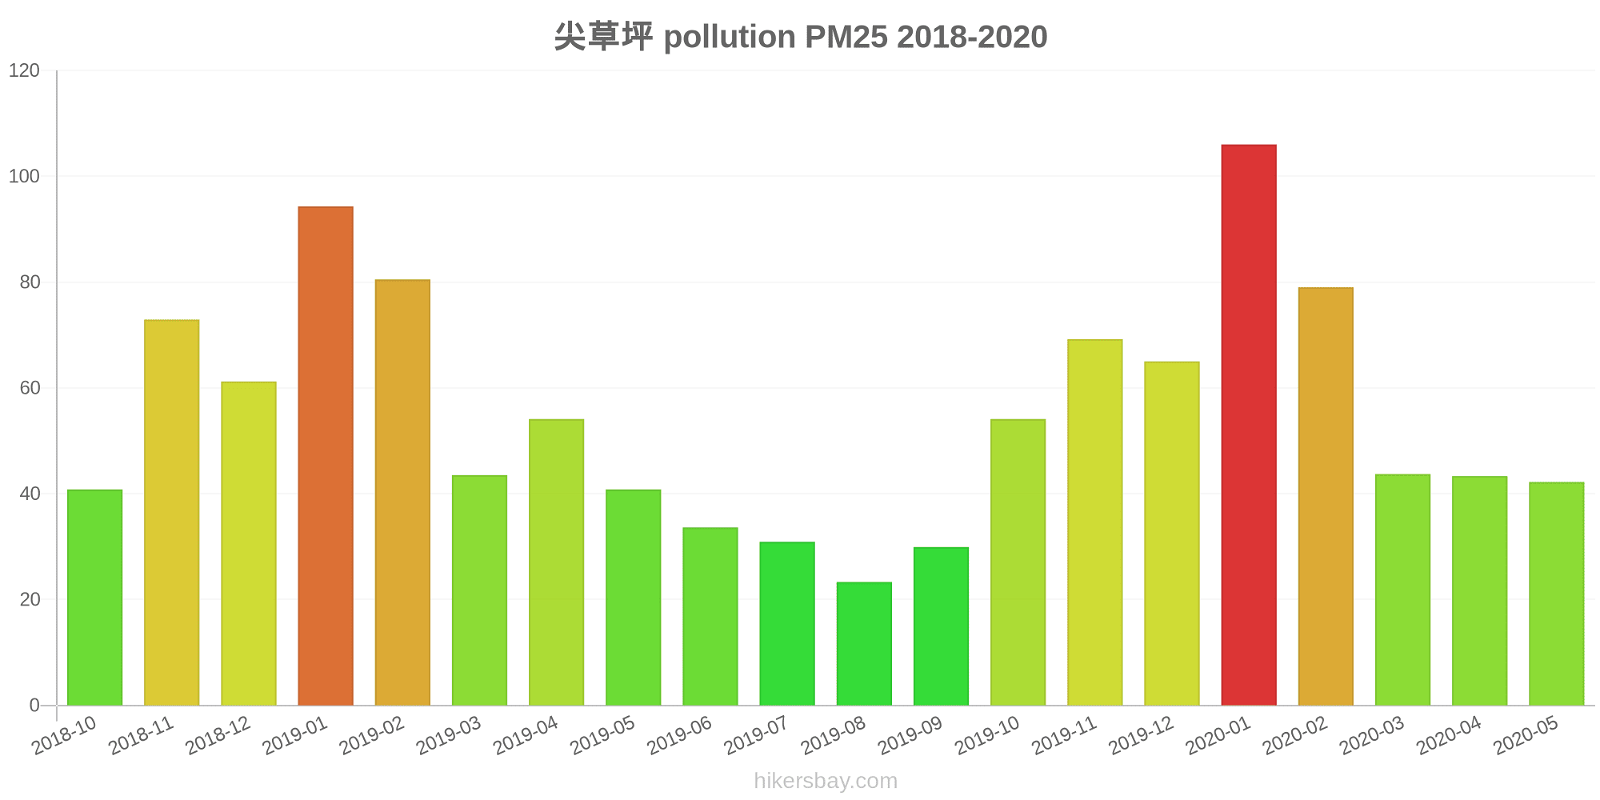
The highest PM2.5 values were recorded: 106 (January 2020).
The lowest level of particulate matter PM2.5 pollution occurs in month: August (23).
How high is the level of NO2? (nitrogen dioxide (NO2))
22 (Good)
What is the level of PM10 today in Dadongliu? (particulate matter (PM10) suspended dust)
The current level of particulate matter PM10 in Dadongliu is:
69 (Unhealthy for Sensitive Groups)
The highest PM10 values usually occur in month: 188 (January 2019).
The lowest value of particulate matter PM10 pollution in Dadongliu is usually recorded in: August (54).
How high is the CO level? (carbon monoxide (CO))
219 (Good)
How is the O3 level today in Dadongliu? (ozone (O3))
0 (Good)
What is the level of SO2 pollution? (sulfur dioxide (SO2))
8 (Good)
Current data Friday, May 27, 2022, 3:00 PM
PM2,5 61 (Unhealthy)
NO2 22 (Good)
PM10 69 (Unhealthy for Sensitive Groups)
CO 219 (Good)
O3 0 (Good)
SO2 8 (Good)
Data on air pollution from recent days in Dadongliu
index
2022-05-27
pm25
28
Moderate
no2
22
Good
pm10
35
Moderate
co
579
Good
o3
22
Good
so2
5
Good
data source »
Air pollution in Dadongliu from October 2018 to May 2020

index
2020-05
2020-04
2020-03
2020-02
2020-01
2019-12
2019-11
2019-10
2019-09
2019-08
2019-07
2019-06
2019-05
2019-04
2019-03
2019-02
2019-01
2018-12
2018-11
2018-10
pm25
42 (Unhealthy for Sensitive Groups)
43 (Unhealthy for Sensitive Groups)
44 (Unhealthy for Sensitive Groups)
79 (Very Unhealthy)
106 (Very Unhealthy)
65 (Unhealthy)
69 (Unhealthy)
54 (Unhealthy for Sensitive Groups)
30 (Moderate)
23 (Moderate)
31 (Moderate)
34 (Moderate)
41 (Unhealthy for Sensitive Groups)
54 (Unhealthy for Sensitive Groups)
44 (Unhealthy for Sensitive Groups)
81 (Very Unhealthy)
94 (Very Unhealthy)
61 (Unhealthy)
73 (Unhealthy)
41 (Unhealthy for Sensitive Groups)
co
713 (Good)
667 (Good)
620 (Good)
1 (Good)
1 (Good)
1 (Good)
995 (Good)
865 (Good)
733 (Good)
761 (Good)
856 (Good)
777 (Good)
690 (Good)
904 (Good)
890 (Good)
1 (Good)
1 (Good)
1 (Good)
1 (Good)
783 (Good)
no2
39 (Good)
51 (Moderate)
43 (Moderate)
35 (Good)
51 (Moderate)
55 (Moderate)
60 (Moderate)
54 (Moderate)
54 (Moderate)
38 (Good)
40 (Good)
41 (Moderate)
49 (Moderate)
55 (Moderate)
50 (Moderate)
49 (Moderate)
79 (Moderate)
60 (Moderate)
69 (Moderate)
59 (Moderate)
o3
162 (Unhealthy)
131 (Unhealthy for Sensitive Groups)
104 (Moderate)
88 (Moderate)
65 (Good)
52 (Good)
59 (Good)
97 (Moderate)
141 (Unhealthy for Sensitive Groups)
155 (Unhealthy)
207 (Very Unhealthy)
209 (Very Unhealthy)
158 (Unhealthy)
124 (Unhealthy for Sensitive Groups)
111 (Moderate)
83 (Moderate)
40 (Good)
45 (Good)
61 (Good)
87 (Moderate)
pm10
101 (Unhealthy)
102 (Unhealthy)
90 (Unhealthy)
106 (Unhealthy)
133 (Very Unhealthy)
108 (Unhealthy)
134 (Very Unhealthy)
109 (Unhealthy)
70 (Unhealthy for Sensitive Groups)
54 (Unhealthy for Sensitive Groups)
67 (Unhealthy for Sensitive Groups)
76 (Unhealthy for Sensitive Groups)
126 (Very Unhealthy)
135 (Very Unhealthy)
110 (Very Unhealthy)
140 (Very Unhealthy)
188 (Very bad Hazardous)
154 (Very bad Hazardous)
183 (Very bad Hazardous)
156 (Very bad Hazardous)
so2
9.7 (Good)
11 (Good)
16 (Good)
22 (Good)
29 (Good)
27 (Good)
24 (Good)
14 (Good)
11 (Good)
8.3 (Good)
10 (Good)
13 (Good)
14 (Good)
15 (Good)
19 (Good)
34 (Good)
50 (Good)
37 (Good)
27 (Good)
15 (Good)
data source »
尖草坪
Friday, May 27, 2022, 3:00 PM
PM2,5 61 (Unhealthy)
particulate matter (PM2.5) dust
NO2 22 (Good)
nitrogen dioxide (NO2)
PM10 69 (Unhealthy for Sensitive Groups)
particulate matter (PM10) suspended dust
CO 219 (Good)
carbon monoxide (CO)
O3 0.05 (Good)
ozone (O3)
SO2 7.7 (Good)
sulfur dioxide (SO2)
尖草坪
index
2022-05-27
pm25
28
no2
22
pm10
35
co
579
o3
22
so2
4.6
尖草坪
2018-10 2020-05
index
2020-05
2020-04
2020-03
2020-02
2020-01
2019-12
2019-11
2019-10
2019-09
2019-08
2019-07
2019-06
2019-05
2019-04
2019-03
2019-02
2019-01
2018-12
2018-11
2018-10
pm25
42
43
44
79
106
65
69
54
30
23
31
34
41
54
44
81
94
61
73
41
co
713
667
620
1
1
1
995
865
733
761
856
777
690
904
890
1
1
1
1
783
no2
39
51
43
35
51
55
60
54
54
38
40
41
49
55
50
49
79
60
69
59
o3
162
131
104
88
65
52
59
97
141
155
207
209
158
124
111
83
40
45
61
87
pm10
101
102
90
106
133
108
134
109
70
54
67
76
126
135
110
140
188
154
183
156
so2
9.7
11
16
22
29
27
24
14
11
8.3
10
13
14
15
19
34
50
37
27
15
* Pollution data source:
https://openaq.org
(ChinaAQIData)
The data is licensed under CC-By 4.0
PM2,5 61 (Unhealthy)
NO2 22 (Good)
PM10 69 (Unhealthy for Sensitive Groups)
CO 219 (Good)
O3 0 (Good)
SO2 8 (Good)
Data on air pollution from recent days in Dadongliu
| index | 2022-05-27 |
|---|---|
| pm25 | 28 Moderate |
| no2 | 22 Good |
| pm10 | 35 Moderate |
| co | 579 Good |
| o3 | 22 Good |
| so2 | 5 Good |

| index | 2020-05 | 2020-04 | 2020-03 | 2020-02 | 2020-01 | 2019-12 | 2019-11 | 2019-10 | 2019-09 | 2019-08 | 2019-07 | 2019-06 | 2019-05 | 2019-04 | 2019-03 | 2019-02 | 2019-01 | 2018-12 | 2018-11 | 2018-10 |
|---|---|---|---|---|---|---|---|---|---|---|---|---|---|---|---|---|---|---|---|---|
| pm25 | 42 (Unhealthy for Sensitive Groups) | 43 (Unhealthy for Sensitive Groups) | 44 (Unhealthy for Sensitive Groups) | 79 (Very Unhealthy) | 106 (Very Unhealthy) | 65 (Unhealthy) | 69 (Unhealthy) | 54 (Unhealthy for Sensitive Groups) | 30 (Moderate) | 23 (Moderate) | 31 (Moderate) | 34 (Moderate) | 41 (Unhealthy for Sensitive Groups) | 54 (Unhealthy for Sensitive Groups) | 44 (Unhealthy for Sensitive Groups) | 81 (Very Unhealthy) | 94 (Very Unhealthy) | 61 (Unhealthy) | 73 (Unhealthy) | 41 (Unhealthy for Sensitive Groups) |
| co | 713 (Good) | 667 (Good) | 620 (Good) | 1 (Good) | 1 (Good) | 1 (Good) | 995 (Good) | 865 (Good) | 733 (Good) | 761 (Good) | 856 (Good) | 777 (Good) | 690 (Good) | 904 (Good) | 890 (Good) | 1 (Good) | 1 (Good) | 1 (Good) | 1 (Good) | 783 (Good) |
| no2 | 39 (Good) | 51 (Moderate) | 43 (Moderate) | 35 (Good) | 51 (Moderate) | 55 (Moderate) | 60 (Moderate) | 54 (Moderate) | 54 (Moderate) | 38 (Good) | 40 (Good) | 41 (Moderate) | 49 (Moderate) | 55 (Moderate) | 50 (Moderate) | 49 (Moderate) | 79 (Moderate) | 60 (Moderate) | 69 (Moderate) | 59 (Moderate) |
| o3 | 162 (Unhealthy) | 131 (Unhealthy for Sensitive Groups) | 104 (Moderate) | 88 (Moderate) | 65 (Good) | 52 (Good) | 59 (Good) | 97 (Moderate) | 141 (Unhealthy for Sensitive Groups) | 155 (Unhealthy) | 207 (Very Unhealthy) | 209 (Very Unhealthy) | 158 (Unhealthy) | 124 (Unhealthy for Sensitive Groups) | 111 (Moderate) | 83 (Moderate) | 40 (Good) | 45 (Good) | 61 (Good) | 87 (Moderate) |
| pm10 | 101 (Unhealthy) | 102 (Unhealthy) | 90 (Unhealthy) | 106 (Unhealthy) | 133 (Very Unhealthy) | 108 (Unhealthy) | 134 (Very Unhealthy) | 109 (Unhealthy) | 70 (Unhealthy for Sensitive Groups) | 54 (Unhealthy for Sensitive Groups) | 67 (Unhealthy for Sensitive Groups) | 76 (Unhealthy for Sensitive Groups) | 126 (Very Unhealthy) | 135 (Very Unhealthy) | 110 (Very Unhealthy) | 140 (Very Unhealthy) | 188 (Very bad Hazardous) | 154 (Very bad Hazardous) | 183 (Very bad Hazardous) | 156 (Very bad Hazardous) |
| so2 | 9.7 (Good) | 11 (Good) | 16 (Good) | 22 (Good) | 29 (Good) | 27 (Good) | 24 (Good) | 14 (Good) | 11 (Good) | 8.3 (Good) | 10 (Good) | 13 (Good) | 14 (Good) | 15 (Good) | 19 (Good) | 34 (Good) | 50 (Good) | 37 (Good) | 27 (Good) | 15 (Good) |
PM2,5 61 (Unhealthy)
particulate matter (PM2.5) dustNO2 22 (Good)
nitrogen dioxide (NO2)PM10 69 (Unhealthy for Sensitive Groups)
particulate matter (PM10) suspended dustCO 219 (Good)
carbon monoxide (CO)O3 0.05 (Good)
ozone (O3)SO2 7.7 (Good)
sulfur dioxide (SO2)尖草坪
| index | 2022-05-27 |
|---|---|
| pm25 | 28 |
| no2 | 22 |
| pm10 | 35 |
| co | 579 |
| o3 | 22 |
| so2 | 4.6 |
尖草坪

| index | 2020-05 | 2020-04 | 2020-03 | 2020-02 | 2020-01 | 2019-12 | 2019-11 | 2019-10 | 2019-09 | 2019-08 | 2019-07 | 2019-06 | 2019-05 | 2019-04 | 2019-03 | 2019-02 | 2019-01 | 2018-12 | 2018-11 | 2018-10 |
|---|---|---|---|---|---|---|---|---|---|---|---|---|---|---|---|---|---|---|---|---|
| pm25 | 42 | 43 | 44 | 79 | 106 | 65 | 69 | 54 | 30 | 23 | 31 | 34 | 41 | 54 | 44 | 81 | 94 | 61 | 73 | 41 |
| co | 713 | 667 | 620 | 1 | 1 | 1 | 995 | 865 | 733 | 761 | 856 | 777 | 690 | 904 | 890 | 1 | 1 | 1 | 1 | 783 |
| no2 | 39 | 51 | 43 | 35 | 51 | 55 | 60 | 54 | 54 | 38 | 40 | 41 | 49 | 55 | 50 | 49 | 79 | 60 | 69 | 59 |
| o3 | 162 | 131 | 104 | 88 | 65 | 52 | 59 | 97 | 141 | 155 | 207 | 209 | 158 | 124 | 111 | 83 | 40 | 45 | 61 | 87 |
| pm10 | 101 | 102 | 90 | 106 | 133 | 108 | 134 | 109 | 70 | 54 | 67 | 76 | 126 | 135 | 110 | 140 | 188 | 154 | 183 | 156 |
| so2 | 9.7 | 11 | 16 | 22 | 29 | 27 | 24 | 14 | 11 | 8.3 | 10 | 13 | 14 | 15 | 19 | 34 | 50 | 37 | 27 | 15 |