Air Pollution in Xuege Xiaoqu: Real-time Air Quality Index and smog alert.
Pollution and air quality forecast for Xuege Xiaoqu. Today is Tuesday, June 16, 2026. The following air pollution values have been recorded for Xuege Xiaoqu:- particulate matter (PM10) suspended dust - 7 (Good)
- particulate matter (PM2.5) dust - 2 (Good)
- carbon monoxide (CO) - 100 (Good)
- nitrogen dioxide (NO2) - 8 (Good)
- ozone (O3) - 0 (Good)
- sulfur dioxide (SO2) - 9 (Good)

What is the air quality in Xuege Xiaoqu today? Is the air polluted in Xuege Xiaoqu?. Is there smog?
What is the level of PM10 today in Xuege Xiaoqu? (particulate matter (PM10) suspended dust)
The current level of particulate matter PM10 in Xuege Xiaoqu is:
7 (Good)
The highest PM10 values usually occur in month: 156 (January 2020).
The lowest value of particulate matter PM10 pollution in Xuege Xiaoqu is usually recorded in: August (39).
What is the current level of PM2.5 in Xuege Xiaoqu? (particulate matter (PM2.5) dust)
Today's PM2.5 level is:
2 (Good)
For comparison, the highest level of PM2.5 in Xuege Xiaoqu in the last 7 days was: 24 (Friday, May 27, 2022) and the lowest: 24 (Friday, May 27, 2022).
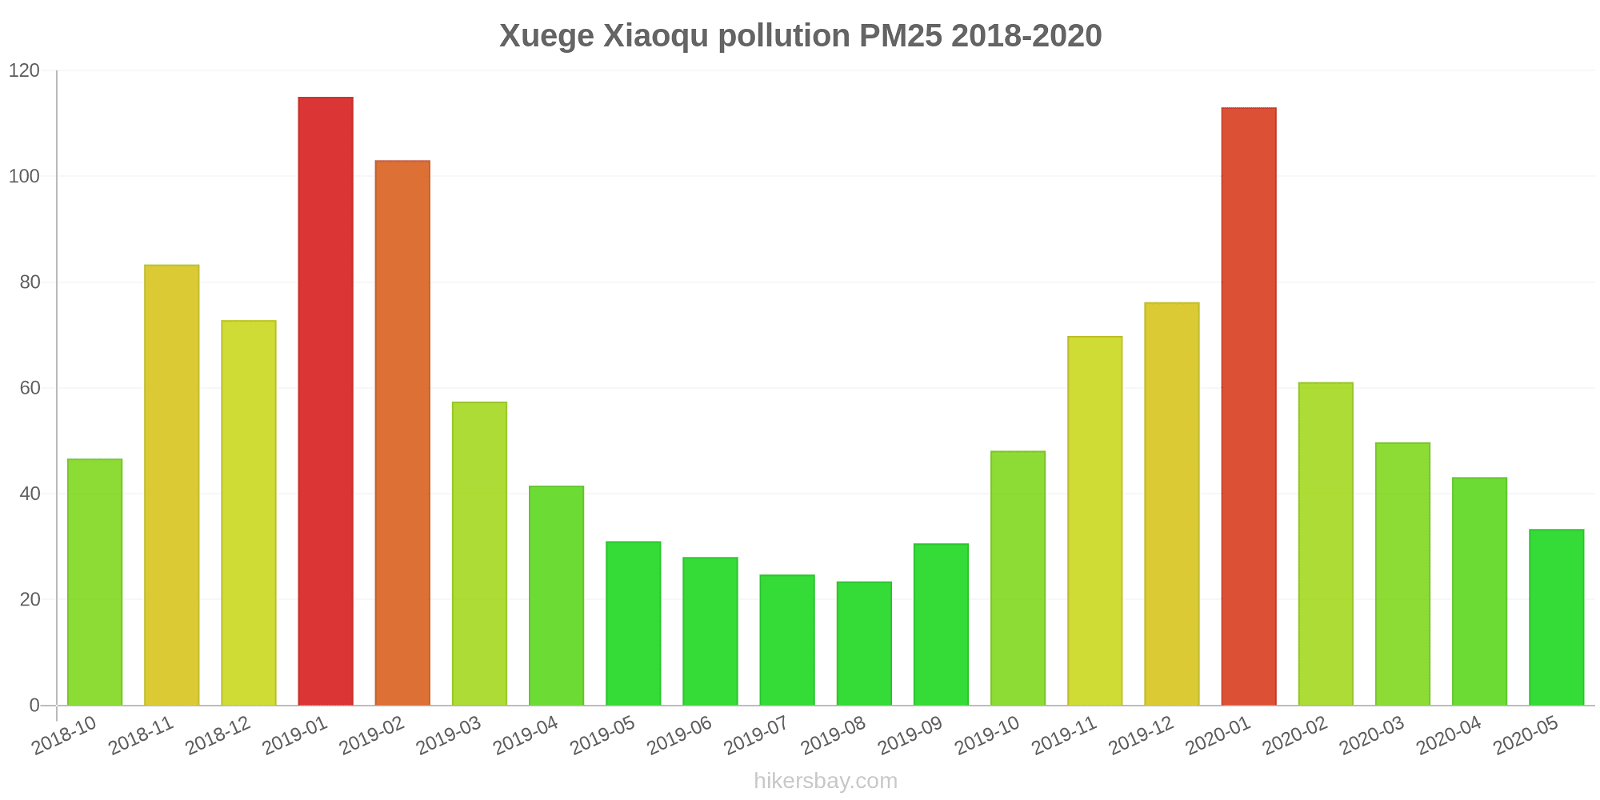
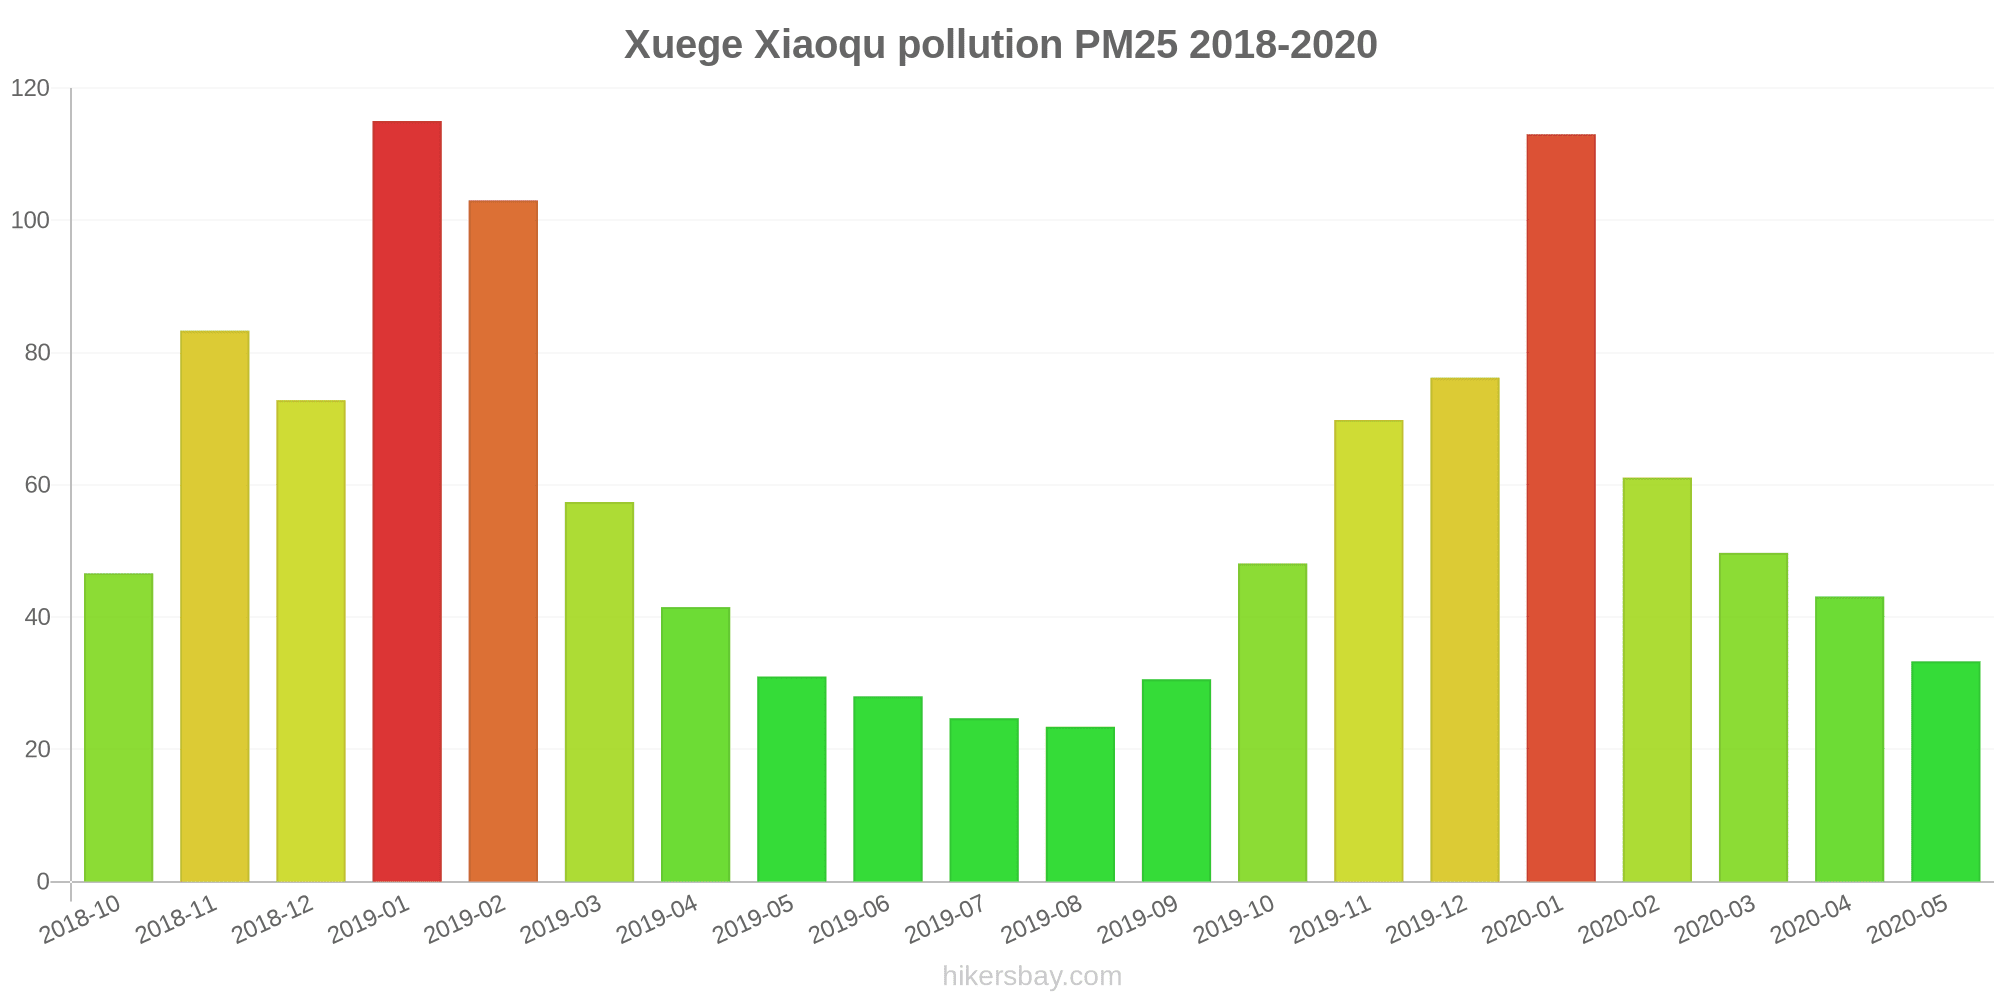
The highest PM2.5 values were recorded: 115 (January 2019).
The lowest level of particulate matter PM2.5 pollution occurs in month: August (23).
How high is the CO level? (carbon monoxide (CO))
100 (Good)
How high is the level of NO2? (nitrogen dioxide (NO2))
8 (Good)
How is the O3 level today in Xuege Xiaoqu? (ozone (O3))
0 (Good)
What is the level of SO2 pollution? (sulfur dioxide (SO2))
9 (Good)
Current data Friday, May 27, 2022, 12:00 PM
PM10 7 (Good)
PM2,5 2 (Good)
CO 100 (Good)
NO2 8 (Good)
O3 0 (Good)
SO2 9 (Good)
Data on air pollution from recent days in Xuege Xiaoqu
index
2022-05-27
pm10
32
Moderate
pm25
24
Moderate
co
468
Good
no2
21
Good
o3
32
Good
so2
5
Good
data source »
Air pollution in Xuege Xiaoqu from October 2018 to May 2020
index
2020-05
2020-04
2020-03
2020-02
2020-01
2019-12
2019-11
2019-10
2019-09
2019-08
2019-07
2019-06
2019-05
2019-04
2019-03
2019-02
2019-01
2018-12
2018-11
2018-10
pm25
33 (Moderate)
43 (Unhealthy for Sensitive Groups)
50 (Unhealthy for Sensitive Groups)
61 (Unhealthy)
113 (Very bad Hazardous)
76 (Very Unhealthy)
70 (Unhealthy)
48 (Unhealthy for Sensitive Groups)
31 (Moderate)
23 (Moderate)
25 (Moderate)
28 (Moderate)
31 (Moderate)
42 (Unhealthy for Sensitive Groups)
57 (Unhealthy)
103 (Very Unhealthy)
115 (Very bad Hazardous)
73 (Unhealthy)
83 (Very Unhealthy)
47 (Unhealthy for Sensitive Groups)
co
554 (Good)
464 (Good)
580 (Good)
728 (Good)
1 (Good)
978 (Good)
803 (Good)
832 (Good)
826 (Good)
725 (Good)
718 (Good)
708 (Good)
810 (Good)
702 (Good)
598 (Good)
1 (Good)
1 (Good)
920 (Good)
953 (Good)
797 (Good)
no2
13 (Good)
18 (Good)
21 (Good)
15 (Good)
33 (Good)
42 (Moderate)
41 (Moderate)
36 (Good)
20 (Good)
12 (Good)
15 (Good)
11 (Good)
14 (Good)
18 (Good)
24 (Good)
24 (Good)
41 (Moderate)
45 (Moderate)
39 (Good)
44 (Moderate)
o3
150 (Unhealthy)
147 (Unhealthy for Sensitive Groups)
109 (Moderate)
92 (Moderate)
76 (Moderate)
70 (Moderate)
103 (Moderate)
126 (Unhealthy for Sensitive Groups)
163 (Unhealthy)
135 (Unhealthy for Sensitive Groups)
158 (Unhealthy)
187 (Very Unhealthy)
146 (Unhealthy for Sensitive Groups)
124 (Unhealthy for Sensitive Groups)
115 (Moderate)
82 (Moderate)
61 (Good)
45 (Good)
84 (Moderate)
114 (Moderate)
pm10
59 (Unhealthy for Sensitive Groups)
79 (Unhealthy for Sensitive Groups)
86 (Unhealthy)
83 (Unhealthy)
156 (Very bad Hazardous)
123 (Very Unhealthy)
136 (Very Unhealthy)
102 (Unhealthy)
65 (Unhealthy for Sensitive Groups)
39 (Moderate)
41 (Moderate)
55 (Unhealthy for Sensitive Groups)
78 (Unhealthy for Sensitive Groups)
77 (Unhealthy for Sensitive Groups)
93 (Unhealthy)
132 (Very Unhealthy)
143 (Very Unhealthy)
117 (Very Unhealthy)
129 (Very Unhealthy)
95 (Unhealthy)
so2
5 (Good)
7.8 (Good)
6.4 (Good)
5.8 (Good)
8.3 (Good)
7.4 (Good)
7 (Good)
6.9 (Good)
10 (Good)
6.7 (Good)
4.6 (Good)
6.1 (Good)
8.3 (Good)
7 (Good)
8.9 (Good)
7.2 (Good)
9.7 (Good)
8.3 (Good)
6.9 (Good)
10 (Good)
data source »
Bozhou San Guo Lan Sheng Gong
Friday, May 27, 2022, 12:00 PM
PM10 6.7 (Good)
particulate matter (PM10) suspended dust
PM2,5 1.7 (Good)
particulate matter (PM2.5) dust
CO 100 (Good)
carbon monoxide (CO)
NO2 7.6 (Good)
nitrogen dioxide (NO2)
O3 0.02 (Good)
ozone (O3)
SO2 8.6 (Good)
sulfur dioxide (SO2)
Bozhou San Guo Lan Sheng Gong
index
2022-05-27
pm10
32
pm25
24
co
468
no2
21
o3
32
so2
4.6
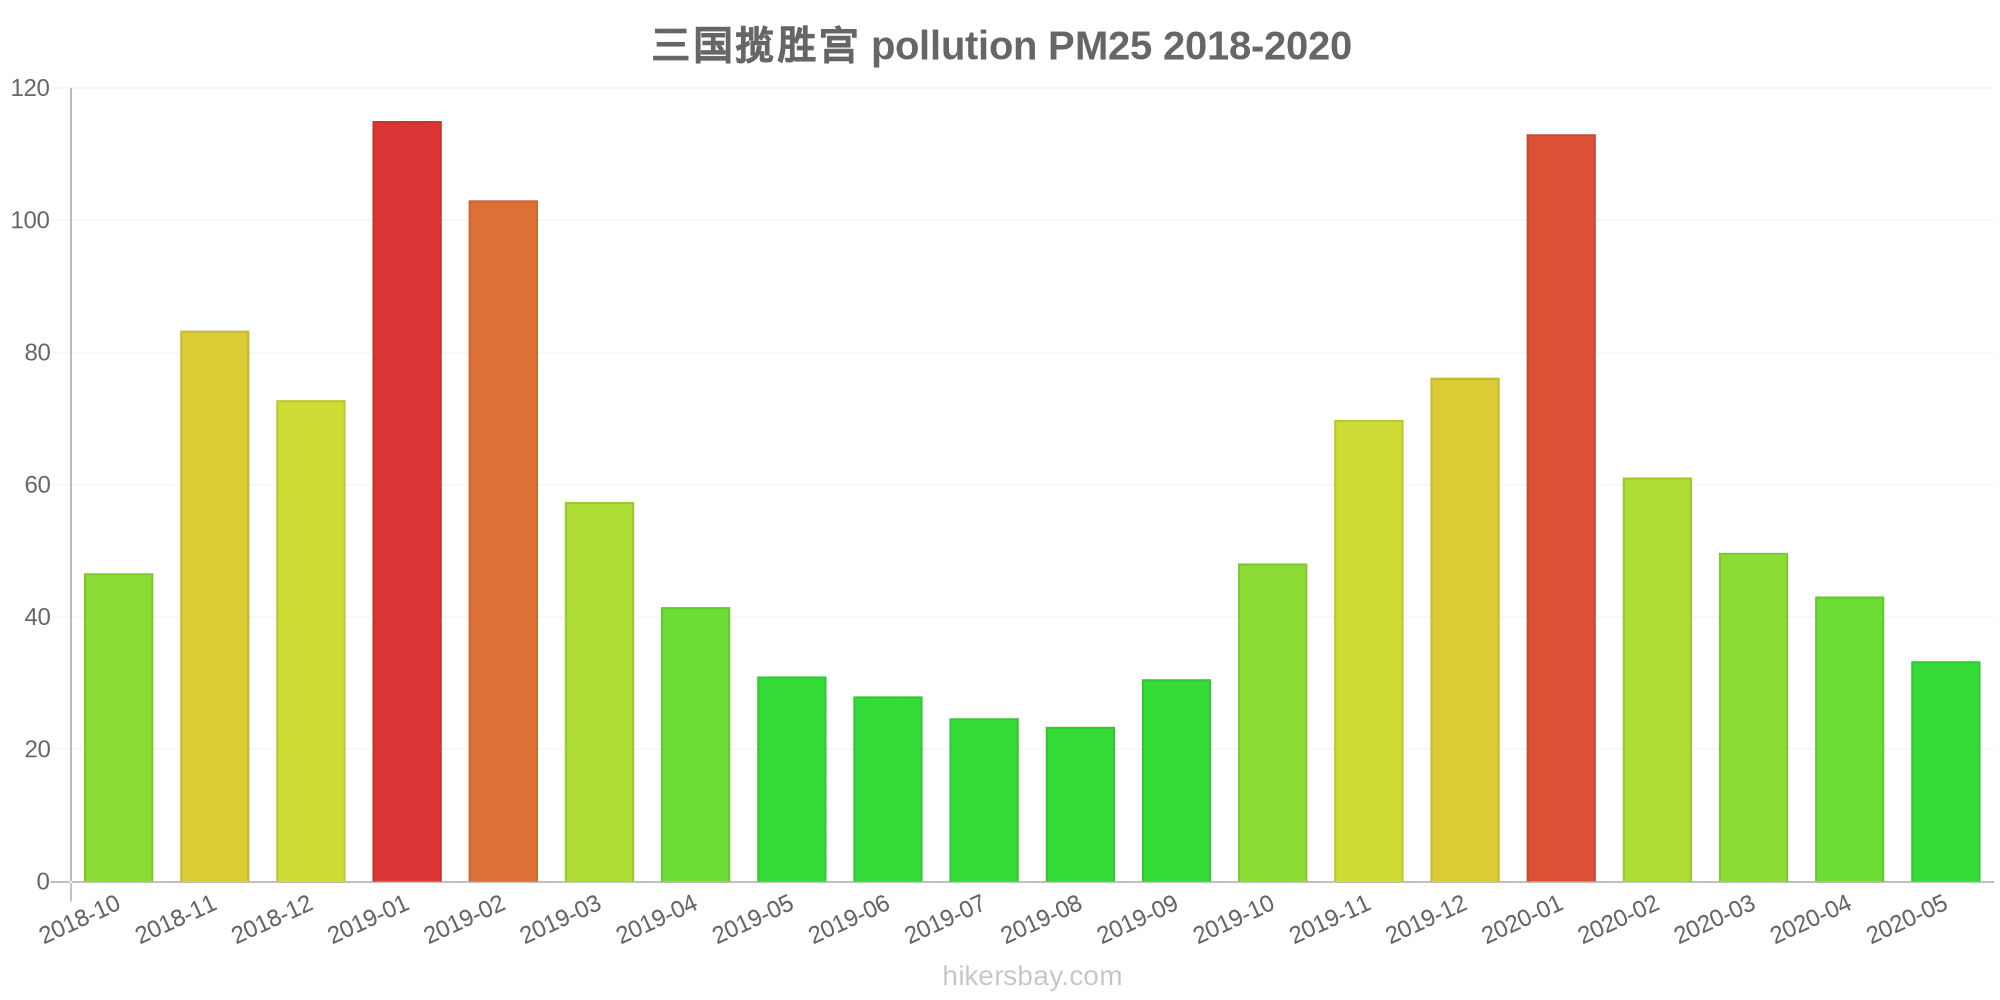
三国揽胜宫
2018-10 2020-05

index
2020-05
2020-04
2020-03
2020-02
2020-01
2019-12
2019-11
2019-10
2019-09
2019-08
2019-07
2019-06
2019-05
2019-04
2019-03
2019-02
2019-01
2018-12
2018-11
2018-10
pm25
33
43
50
61
113
76
70
48
31
23
25
28
31
42
57
103
115
73
83
47
co
554
464
580
728
1
978
803
832
826
725
718
708
810
702
598
1
1
920
953
797
no2
13
18
21
15
33
42
41
36
20
12
15
11
14
18
24
24
41
45
39
44
o3
150
147
109
92
76
70
103
126
163
135
158
187
146
124
115
82
61
45
84
114
pm10
59
79
86
83
156
123
136
102
65
39
41
55
78
77
93
132
143
117
129
95
so2
5
7.8
6.4
5.8
8.3
7.4
7
6.9
10
6.7
4.6
6.1
8.3
7
8.9
7.2
9.7
8.3
6.9
10
* Pollution data source:
https://openaq.org
(ChinaAQIData)
The data is licensed under CC-By 4.0
PM10 7 (Good)
PM2,5 2 (Good)
CO 100 (Good)
NO2 8 (Good)
O3 0 (Good)
SO2 9 (Good)
Data on air pollution from recent days in Xuege Xiaoqu
| index | 2022-05-27 |
|---|---|
| pm10 | 32 Moderate |
| pm25 | 24 Moderate |
| co | 468 Good |
| no2 | 21 Good |
| o3 | 32 Good |
| so2 | 5 Good |
| index | 2020-05 | 2020-04 | 2020-03 | 2020-02 | 2020-01 | 2019-12 | 2019-11 | 2019-10 | 2019-09 | 2019-08 | 2019-07 | 2019-06 | 2019-05 | 2019-04 | 2019-03 | 2019-02 | 2019-01 | 2018-12 | 2018-11 | 2018-10 |
|---|---|---|---|---|---|---|---|---|---|---|---|---|---|---|---|---|---|---|---|---|
| pm25 | 33 (Moderate) | 43 (Unhealthy for Sensitive Groups) | 50 (Unhealthy for Sensitive Groups) | 61 (Unhealthy) | 113 (Very bad Hazardous) | 76 (Very Unhealthy) | 70 (Unhealthy) | 48 (Unhealthy for Sensitive Groups) | 31 (Moderate) | 23 (Moderate) | 25 (Moderate) | 28 (Moderate) | 31 (Moderate) | 42 (Unhealthy for Sensitive Groups) | 57 (Unhealthy) | 103 (Very Unhealthy) | 115 (Very bad Hazardous) | 73 (Unhealthy) | 83 (Very Unhealthy) | 47 (Unhealthy for Sensitive Groups) |
| co | 554 (Good) | 464 (Good) | 580 (Good) | 728 (Good) | 1 (Good) | 978 (Good) | 803 (Good) | 832 (Good) | 826 (Good) | 725 (Good) | 718 (Good) | 708 (Good) | 810 (Good) | 702 (Good) | 598 (Good) | 1 (Good) | 1 (Good) | 920 (Good) | 953 (Good) | 797 (Good) |
| no2 | 13 (Good) | 18 (Good) | 21 (Good) | 15 (Good) | 33 (Good) | 42 (Moderate) | 41 (Moderate) | 36 (Good) | 20 (Good) | 12 (Good) | 15 (Good) | 11 (Good) | 14 (Good) | 18 (Good) | 24 (Good) | 24 (Good) | 41 (Moderate) | 45 (Moderate) | 39 (Good) | 44 (Moderate) |
| o3 | 150 (Unhealthy) | 147 (Unhealthy for Sensitive Groups) | 109 (Moderate) | 92 (Moderate) | 76 (Moderate) | 70 (Moderate) | 103 (Moderate) | 126 (Unhealthy for Sensitive Groups) | 163 (Unhealthy) | 135 (Unhealthy for Sensitive Groups) | 158 (Unhealthy) | 187 (Very Unhealthy) | 146 (Unhealthy for Sensitive Groups) | 124 (Unhealthy for Sensitive Groups) | 115 (Moderate) | 82 (Moderate) | 61 (Good) | 45 (Good) | 84 (Moderate) | 114 (Moderate) |
| pm10 | 59 (Unhealthy for Sensitive Groups) | 79 (Unhealthy for Sensitive Groups) | 86 (Unhealthy) | 83 (Unhealthy) | 156 (Very bad Hazardous) | 123 (Very Unhealthy) | 136 (Very Unhealthy) | 102 (Unhealthy) | 65 (Unhealthy for Sensitive Groups) | 39 (Moderate) | 41 (Moderate) | 55 (Unhealthy for Sensitive Groups) | 78 (Unhealthy for Sensitive Groups) | 77 (Unhealthy for Sensitive Groups) | 93 (Unhealthy) | 132 (Very Unhealthy) | 143 (Very Unhealthy) | 117 (Very Unhealthy) | 129 (Very Unhealthy) | 95 (Unhealthy) |
| so2 | 5 (Good) | 7.8 (Good) | 6.4 (Good) | 5.8 (Good) | 8.3 (Good) | 7.4 (Good) | 7 (Good) | 6.9 (Good) | 10 (Good) | 6.7 (Good) | 4.6 (Good) | 6.1 (Good) | 8.3 (Good) | 7 (Good) | 8.9 (Good) | 7.2 (Good) | 9.7 (Good) | 8.3 (Good) | 6.9 (Good) | 10 (Good) |
PM10 6.7 (Good)
particulate matter (PM10) suspended dustPM2,5 1.7 (Good)
particulate matter (PM2.5) dustCO 100 (Good)
carbon monoxide (CO)NO2 7.6 (Good)
nitrogen dioxide (NO2)O3 0.02 (Good)
ozone (O3)SO2 8.6 (Good)
sulfur dioxide (SO2)Bozhou San Guo Lan Sheng Gong
| index | 2022-05-27 |
|---|---|
| pm10 | 32 |
| pm25 | 24 |
| co | 468 |
| no2 | 21 |
| o3 | 32 |
| so2 | 4.6 |
三国揽胜宫
| index | 2020-05 | 2020-04 | 2020-03 | 2020-02 | 2020-01 | 2019-12 | 2019-11 | 2019-10 | 2019-09 | 2019-08 | 2019-07 | 2019-06 | 2019-05 | 2019-04 | 2019-03 | 2019-02 | 2019-01 | 2018-12 | 2018-11 | 2018-10 |
|---|---|---|---|---|---|---|---|---|---|---|---|---|---|---|---|---|---|---|---|---|
| pm25 | 33 | 43 | 50 | 61 | 113 | 76 | 70 | 48 | 31 | 23 | 25 | 28 | 31 | 42 | 57 | 103 | 115 | 73 | 83 | 47 |
| co | 554 | 464 | 580 | 728 | 1 | 978 | 803 | 832 | 826 | 725 | 718 | 708 | 810 | 702 | 598 | 1 | 1 | 920 | 953 | 797 |
| no2 | 13 | 18 | 21 | 15 | 33 | 42 | 41 | 36 | 20 | 12 | 15 | 11 | 14 | 18 | 24 | 24 | 41 | 45 | 39 | 44 |
| o3 | 150 | 147 | 109 | 92 | 76 | 70 | 103 | 126 | 163 | 135 | 158 | 187 | 146 | 124 | 115 | 82 | 61 | 45 | 84 | 114 |
| pm10 | 59 | 79 | 86 | 83 | 156 | 123 | 136 | 102 | 65 | 39 | 41 | 55 | 78 | 77 | 93 | 132 | 143 | 117 | 129 | 95 |
| so2 | 5 | 7.8 | 6.4 | 5.8 | 8.3 | 7.4 | 7 | 6.9 | 10 | 6.7 | 4.6 | 6.1 | 8.3 | 7 | 8.9 | 7.2 | 9.7 | 8.3 | 6.9 | 10 |