Air Pollution in Xiliucun: Real-time Air Quality Index and smog alert.
Pollution and air quality forecast for Xiliucun. Today is Sunday, June 21, 2026. The following air pollution values have been recorded for Xiliucun:- particulate matter (PM2.5) dust - 61 (Unhealthy)
- nitrogen dioxide (NO2) - 22 (Good)
- particulate matter (PM10) suspended dust - 69 (Unhealthy for Sensitive Groups)
- carbon monoxide (CO) - 219 (Good)
- ozone (O3) - 0 (Good)
- sulfur dioxide (SO2) - 8 (Good)

What is the air quality in Xiliucun today? Is the air polluted in Xiliucun?. Is there smog?
What is the current level of PM2.5 in Xiliucun? (particulate matter (PM2.5) dust)
Today's PM2.5 level is:
61 (Unhealthy)
For comparison, the highest level of PM2.5 in Xiliucun in the last 7 days was: 28 (Friday, May 27, 2022) and the lowest: 28 (Friday, May 27, 2022).
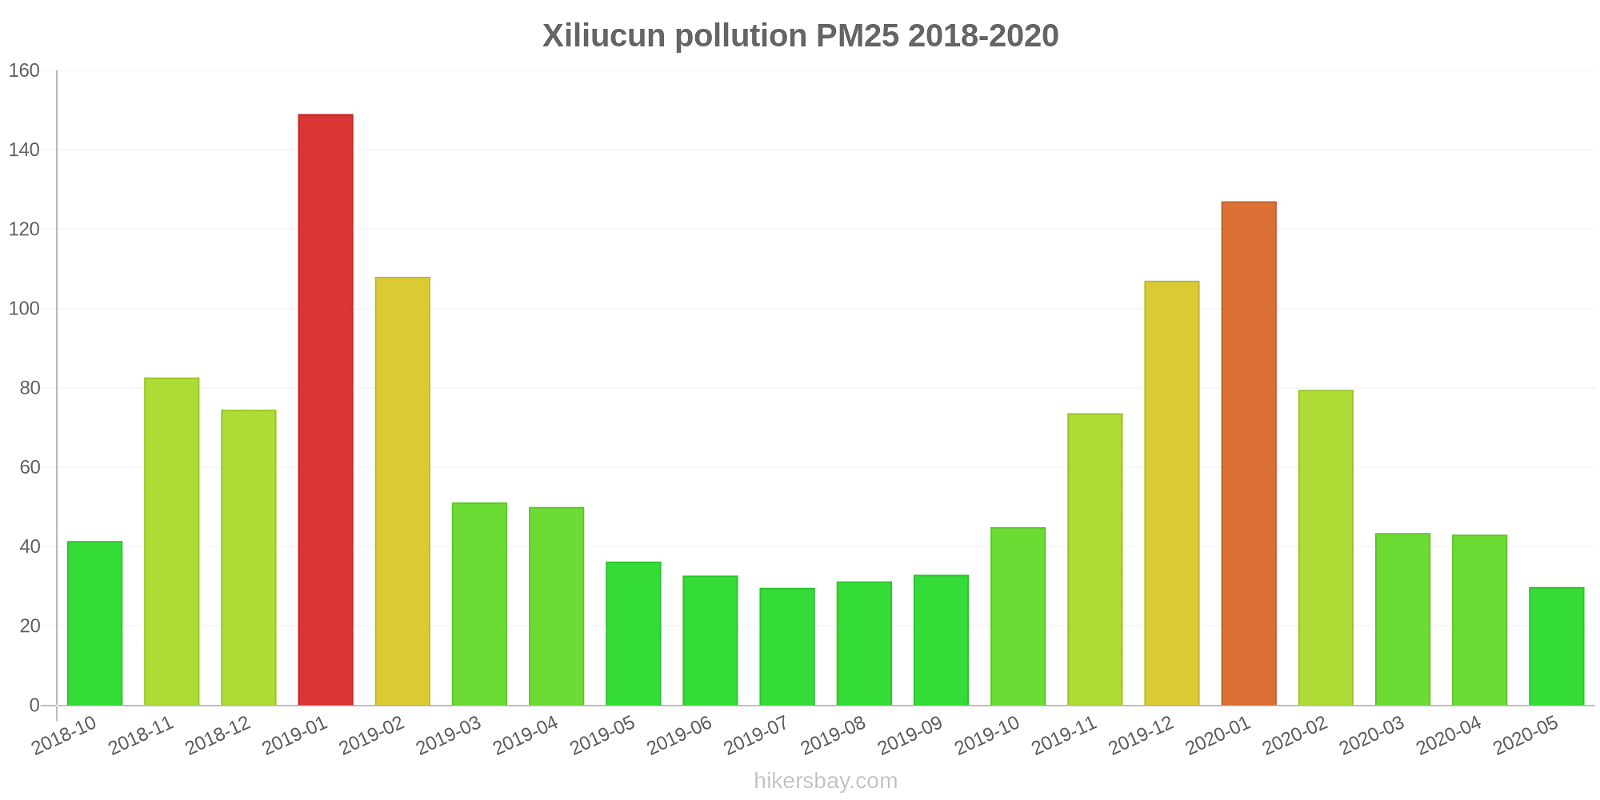
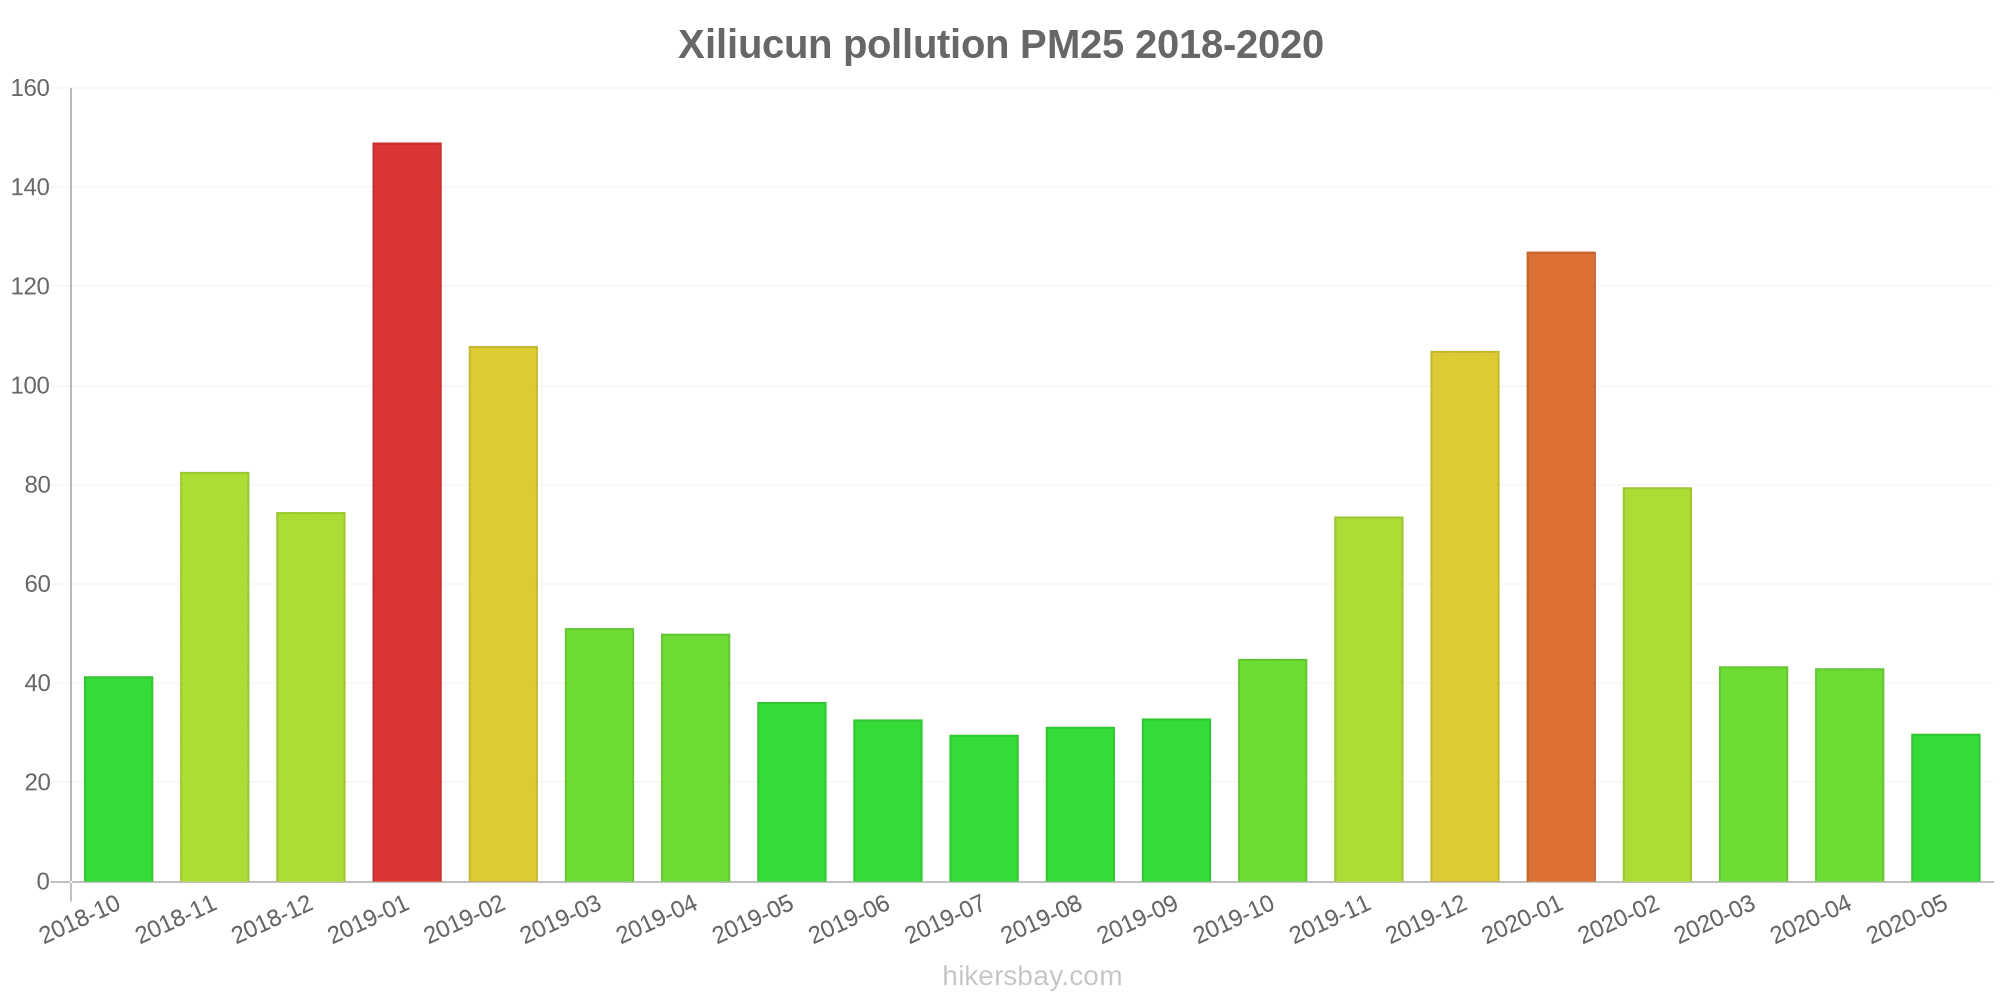
The highest PM2.5 values were recorded: 149 (January 2019).
The lowest level of particulate matter PM2.5 pollution occurs in month: July (30).
How high is the level of NO2? (nitrogen dioxide (NO2))
22 (Good)
What is the level of PM10 today in Xiliucun? (particulate matter (PM10) suspended dust)
The current level of particulate matter PM10 in Xiliucun is:
69 (Unhealthy for Sensitive Groups)
The highest PM10 values usually occur in month: 201 (January 2019).
The lowest value of particulate matter PM10 pollution in Xiliucun is usually recorded in: July (52).
How high is the CO level? (carbon monoxide (CO))
219 (Good)
How is the O3 level today in Xiliucun? (ozone (O3))
0 (Good)
What is the level of SO2 pollution? (sulfur dioxide (SO2))
8 (Good)
Current data Friday, May 27, 2022, 3:00 PM
PM2,5 61 (Unhealthy)
NO2 22 (Good)
PM10 69 (Unhealthy for Sensitive Groups)
CO 219 (Good)
O3 0 (Good)
SO2 8 (Good)
Data on air pollution from recent days in Xiliucun
index
2022-05-27
pm25
28
Moderate
no2
22
Good
pm10
35
Moderate
co
579
Good
o3
22
Good
so2
5
Good
data source »
Air pollution in Xiliucun from October 2018 to May 2020
index
2020-05
2020-04
2020-03
2020-02
2020-01
2019-12
2019-11
2019-10
2019-09
2019-08
2019-07
2019-06
2019-05
2019-04
2019-03
2019-02
2019-01
2018-12
2018-11
2018-10
pm25
30 (Moderate)
43 (Unhealthy for Sensitive Groups)
43 (Unhealthy for Sensitive Groups)
80 (Very Unhealthy)
127 (Very bad Hazardous)
107 (Very Unhealthy)
74 (Unhealthy)
45 (Unhealthy for Sensitive Groups)
33 (Moderate)
31 (Moderate)
30 (Moderate)
33 (Moderate)
36 (Unhealthy for Sensitive Groups)
50 (Unhealthy for Sensitive Groups)
51 (Unhealthy for Sensitive Groups)
108 (Very Unhealthy)
149 (Very bad Hazardous)
75 (Unhealthy)
83 (Very Unhealthy)
41 (Unhealthy for Sensitive Groups)
co
724 (Good)
880 (Good)
611 (Good)
1 (Good)
1 (Good)
1 (Good)
1 (Good)
1 (Good)
1 (Good)
958 (Good)
677 (Good)
820 (Good)
769 (Good)
1 (Good)
1 (Good)
1 (Good)
2 (Good)
1 (Good)
1 (Good)
949 (Good)
no2
22 (Good)
35 (Good)
28 (Good)
21 (Good)
37 (Good)
53 (Moderate)
40 (Good)
30 (Good)
20 (Good)
16 (Good)
15 (Good)
15 (Good)
20 (Good)
24 (Good)
35 (Good)
38 (Good)
60 (Moderate)
49 (Moderate)
49 (Moderate)
46 (Moderate)
o3
164 (Unhealthy)
150 (Unhealthy)
117 (Moderate)
106 (Moderate)
73 (Moderate)
71 (Moderate)
69 (Good)
83 (Moderate)
145 (Unhealthy for Sensitive Groups)
162 (Unhealthy)
173 (Unhealthy)
187 (Very Unhealthy)
162 (Unhealthy)
147 (Unhealthy for Sensitive Groups)
132 (Unhealthy for Sensitive Groups)
108 (Moderate)
68 (Good)
57 (Good)
80 (Moderate)
95 (Moderate)
pm10
67 (Unhealthy for Sensitive Groups)
86 (Unhealthy)
89 (Unhealthy)
104 (Unhealthy)
156 (Very bad Hazardous)
150 (Very bad Hazardous)
127 (Very Unhealthy)
89 (Unhealthy)
55 (Unhealthy for Sensitive Groups)
53 (Unhealthy for Sensitive Groups)
52 (Unhealthy for Sensitive Groups)
58 (Unhealthy for Sensitive Groups)
96 (Unhealthy)
96 (Unhealthy)
99 (Unhealthy)
155 (Very bad Hazardous)
201 (Very bad Hazardous)
138 (Very Unhealthy)
146 (Very Unhealthy)
85 (Unhealthy)
so2
8.8 (Good)
10 (Good)
16 (Good)
18 (Good)
25 (Good)
28 (Good)
12 (Good)
6.6 (Good)
6.2 (Good)
6.6 (Good)
7.1 (Good)
8.1 (Good)
5.5 (Good)
11 (Good)
17 (Good)
25 (Good)
49 (Good)
41 (Good)
28 (Good)
23 (Good)
data source »
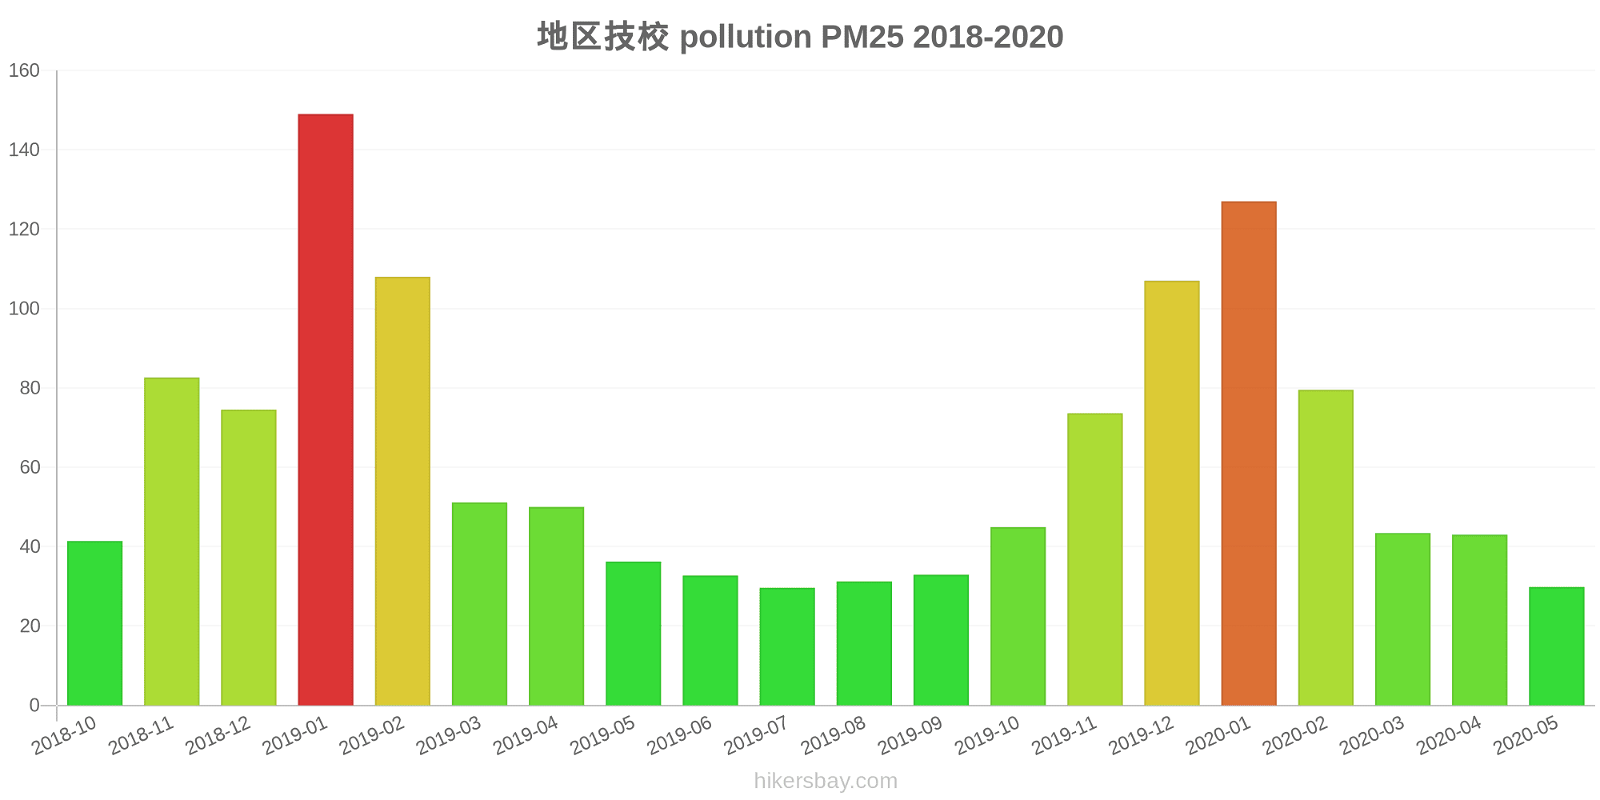
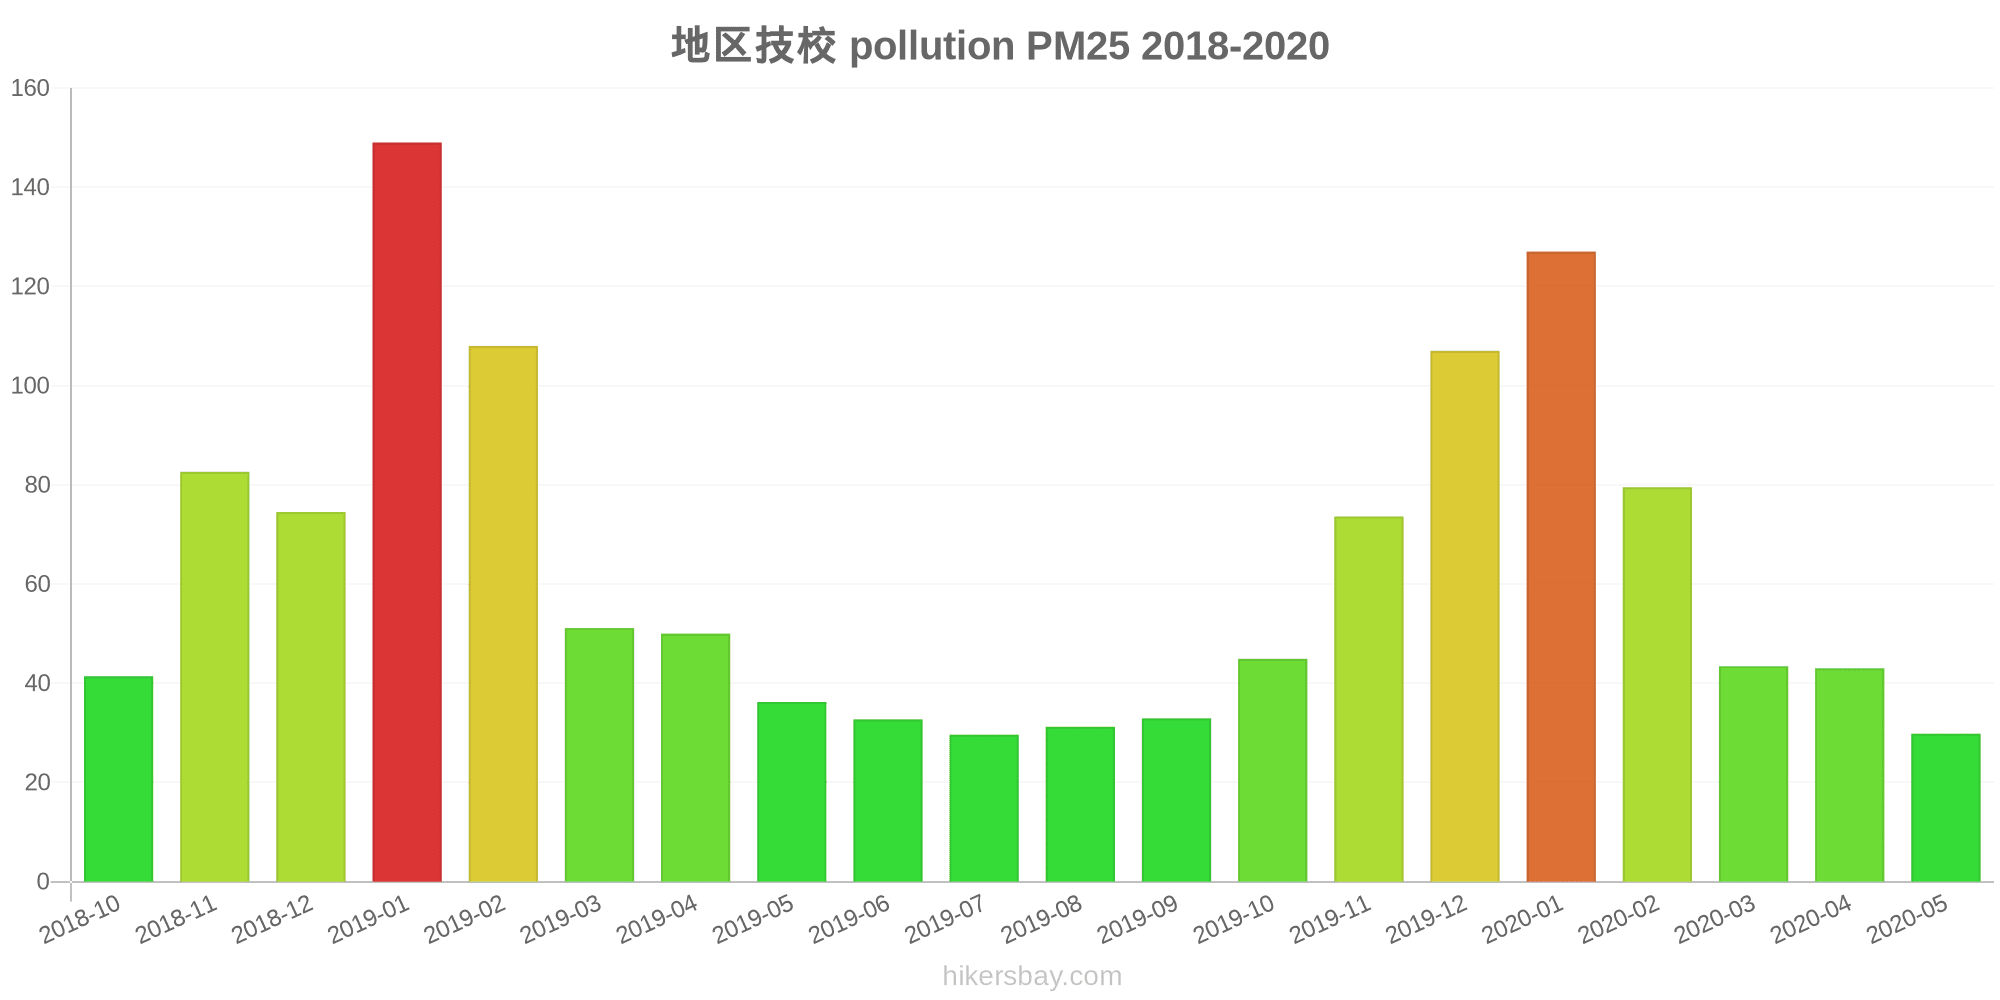
地区技校
Friday, May 27, 2022, 3:00 PM
PM2,5 61 (Unhealthy)
particulate matter (PM2.5) dust
NO2 22 (Good)
nitrogen dioxide (NO2)
PM10 69 (Unhealthy for Sensitive Groups)
particulate matter (PM10) suspended dust
CO 219 (Good)
carbon monoxide (CO)
O3 0.05 (Good)
ozone (O3)
SO2 7.7 (Good)
sulfur dioxide (SO2)
地区技校
index
2022-05-27
pm25
28
no2
22
pm10
35
co
579
o3
22
so2
4.6
地区技校
2018-10 2020-05
index
2020-05
2020-04
2020-03
2020-02
2020-01
2019-12
2019-11
2019-10
2019-09
2019-08
2019-07
2019-06
2019-05
2019-04
2019-03
2019-02
2019-01
2018-12
2018-11
2018-10
pm25
30
43
43
80
127
107
74
45
33
31
30
33
36
50
51
108
149
75
83
41
co
724
880
611
1
1
1
1
1
1
958
677
820
769
1
1
1
2
1
1
949
no2
22
35
28
21
37
53
40
30
20
16
15
15
20
24
35
38
60
49
49
46
o3
164
150
117
106
73
71
69
83
145
162
173
187
162
147
132
108
68
57
80
95
pm10
67
86
89
104
156
150
127
89
55
53
52
58
96
96
99
155
201
138
146
85
so2
8.8
10
16
18
25
28
12
6.6
6.2
6.6
7.1
8.1
5.5
11
17
25
49
41
28
23
* Pollution data source:
https://openaq.org
(ChinaAQIData)
The data is licensed under CC-By 4.0
PM2,5 61 (Unhealthy)
NO2 22 (Good)
PM10 69 (Unhealthy for Sensitive Groups)
CO 219 (Good)
O3 0 (Good)
SO2 8 (Good)
Data on air pollution from recent days in Xiliucun
| index | 2022-05-27 |
|---|---|
| pm25 | 28 Moderate |
| no2 | 22 Good |
| pm10 | 35 Moderate |
| co | 579 Good |
| o3 | 22 Good |
| so2 | 5 Good |
| index | 2020-05 | 2020-04 | 2020-03 | 2020-02 | 2020-01 | 2019-12 | 2019-11 | 2019-10 | 2019-09 | 2019-08 | 2019-07 | 2019-06 | 2019-05 | 2019-04 | 2019-03 | 2019-02 | 2019-01 | 2018-12 | 2018-11 | 2018-10 |
|---|---|---|---|---|---|---|---|---|---|---|---|---|---|---|---|---|---|---|---|---|
| pm25 | 30 (Moderate) | 43 (Unhealthy for Sensitive Groups) | 43 (Unhealthy for Sensitive Groups) | 80 (Very Unhealthy) | 127 (Very bad Hazardous) | 107 (Very Unhealthy) | 74 (Unhealthy) | 45 (Unhealthy for Sensitive Groups) | 33 (Moderate) | 31 (Moderate) | 30 (Moderate) | 33 (Moderate) | 36 (Unhealthy for Sensitive Groups) | 50 (Unhealthy for Sensitive Groups) | 51 (Unhealthy for Sensitive Groups) | 108 (Very Unhealthy) | 149 (Very bad Hazardous) | 75 (Unhealthy) | 83 (Very Unhealthy) | 41 (Unhealthy for Sensitive Groups) |
| co | 724 (Good) | 880 (Good) | 611 (Good) | 1 (Good) | 1 (Good) | 1 (Good) | 1 (Good) | 1 (Good) | 1 (Good) | 958 (Good) | 677 (Good) | 820 (Good) | 769 (Good) | 1 (Good) | 1 (Good) | 1 (Good) | 2 (Good) | 1 (Good) | 1 (Good) | 949 (Good) |
| no2 | 22 (Good) | 35 (Good) | 28 (Good) | 21 (Good) | 37 (Good) | 53 (Moderate) | 40 (Good) | 30 (Good) | 20 (Good) | 16 (Good) | 15 (Good) | 15 (Good) | 20 (Good) | 24 (Good) | 35 (Good) | 38 (Good) | 60 (Moderate) | 49 (Moderate) | 49 (Moderate) | 46 (Moderate) |
| o3 | 164 (Unhealthy) | 150 (Unhealthy) | 117 (Moderate) | 106 (Moderate) | 73 (Moderate) | 71 (Moderate) | 69 (Good) | 83 (Moderate) | 145 (Unhealthy for Sensitive Groups) | 162 (Unhealthy) | 173 (Unhealthy) | 187 (Very Unhealthy) | 162 (Unhealthy) | 147 (Unhealthy for Sensitive Groups) | 132 (Unhealthy for Sensitive Groups) | 108 (Moderate) | 68 (Good) | 57 (Good) | 80 (Moderate) | 95 (Moderate) |
| pm10 | 67 (Unhealthy for Sensitive Groups) | 86 (Unhealthy) | 89 (Unhealthy) | 104 (Unhealthy) | 156 (Very bad Hazardous) | 150 (Very bad Hazardous) | 127 (Very Unhealthy) | 89 (Unhealthy) | 55 (Unhealthy for Sensitive Groups) | 53 (Unhealthy for Sensitive Groups) | 52 (Unhealthy for Sensitive Groups) | 58 (Unhealthy for Sensitive Groups) | 96 (Unhealthy) | 96 (Unhealthy) | 99 (Unhealthy) | 155 (Very bad Hazardous) | 201 (Very bad Hazardous) | 138 (Very Unhealthy) | 146 (Very Unhealthy) | 85 (Unhealthy) |
| so2 | 8.8 (Good) | 10 (Good) | 16 (Good) | 18 (Good) | 25 (Good) | 28 (Good) | 12 (Good) | 6.6 (Good) | 6.2 (Good) | 6.6 (Good) | 7.1 (Good) | 8.1 (Good) | 5.5 (Good) | 11 (Good) | 17 (Good) | 25 (Good) | 49 (Good) | 41 (Good) | 28 (Good) | 23 (Good) |
PM2,5 61 (Unhealthy)
particulate matter (PM2.5) dustNO2 22 (Good)
nitrogen dioxide (NO2)PM10 69 (Unhealthy for Sensitive Groups)
particulate matter (PM10) suspended dustCO 219 (Good)
carbon monoxide (CO)O3 0.05 (Good)
ozone (O3)SO2 7.7 (Good)
sulfur dioxide (SO2)地区技校
| index | 2022-05-27 |
|---|---|
| pm25 | 28 |
| no2 | 22 |
| pm10 | 35 |
| co | 579 |
| o3 | 22 |
| so2 | 4.6 |
地区技校
| index | 2020-05 | 2020-04 | 2020-03 | 2020-02 | 2020-01 | 2019-12 | 2019-11 | 2019-10 | 2019-09 | 2019-08 | 2019-07 | 2019-06 | 2019-05 | 2019-04 | 2019-03 | 2019-02 | 2019-01 | 2018-12 | 2018-11 | 2018-10 |
|---|---|---|---|---|---|---|---|---|---|---|---|---|---|---|---|---|---|---|---|---|
| pm25 | 30 | 43 | 43 | 80 | 127 | 107 | 74 | 45 | 33 | 31 | 30 | 33 | 36 | 50 | 51 | 108 | 149 | 75 | 83 | 41 |
| co | 724 | 880 | 611 | 1 | 1 | 1 | 1 | 1 | 1 | 958 | 677 | 820 | 769 | 1 | 1 | 1 | 2 | 1 | 1 | 949 |
| no2 | 22 | 35 | 28 | 21 | 37 | 53 | 40 | 30 | 20 | 16 | 15 | 15 | 20 | 24 | 35 | 38 | 60 | 49 | 49 | 46 |
| o3 | 164 | 150 | 117 | 106 | 73 | 71 | 69 | 83 | 145 | 162 | 173 | 187 | 162 | 147 | 132 | 108 | 68 | 57 | 80 | 95 |
| pm10 | 67 | 86 | 89 | 104 | 156 | 150 | 127 | 89 | 55 | 53 | 52 | 58 | 96 | 96 | 99 | 155 | 201 | 138 | 146 | 85 |
| so2 | 8.8 | 10 | 16 | 18 | 25 | 28 | 12 | 6.6 | 6.2 | 6.6 | 7.1 | 8.1 | 5.5 | 11 | 17 | 25 | 49 | 41 | 28 | 23 |