Air Pollution in Baojishi: Real-time Air Quality Index and smog alert.
Pollution and air quality forecast for Baojishi. Today is Tuesday, June 2, 2026. The following air pollution values have been recorded for Baojishi:- particulate matter (PM10) suspended dust - 179 (Very bad Hazardous)
- particulate matter (PM2.5) dust - 35 (Unhealthy for Sensitive Groups)
- ozone (O3) - 0 (Good)
- nitrogen dioxide (NO2) - 0 (Good)
- sulfur dioxide (SO2) - 0 (Good)

What is the air quality in Baojishi today? Is the air polluted in Baojishi?. Is there smog?
What is the level of PM10 today in Baojishi? (particulate matter (PM10) suspended dust)
The current level of particulate matter PM10 in Baojishi is:
179 (Very bad Hazardous)
The highest PM10 values usually occur in month: 130 (December 2018).
The lowest value of particulate matter PM10 pollution in Baojishi is usually recorded in: June (38).
What is the current level of PM2.5 in Baojishi? (particulate matter (PM2.5) dust)
Today's PM2.5 level is:
35 (Unhealthy for Sensitive Groups)
For comparison, the highest level of PM2.5 in Baojishi in the last 7 days was: 56 (Friday, May 27, 2022) and the lowest: 56 (Friday, May 27, 2022).
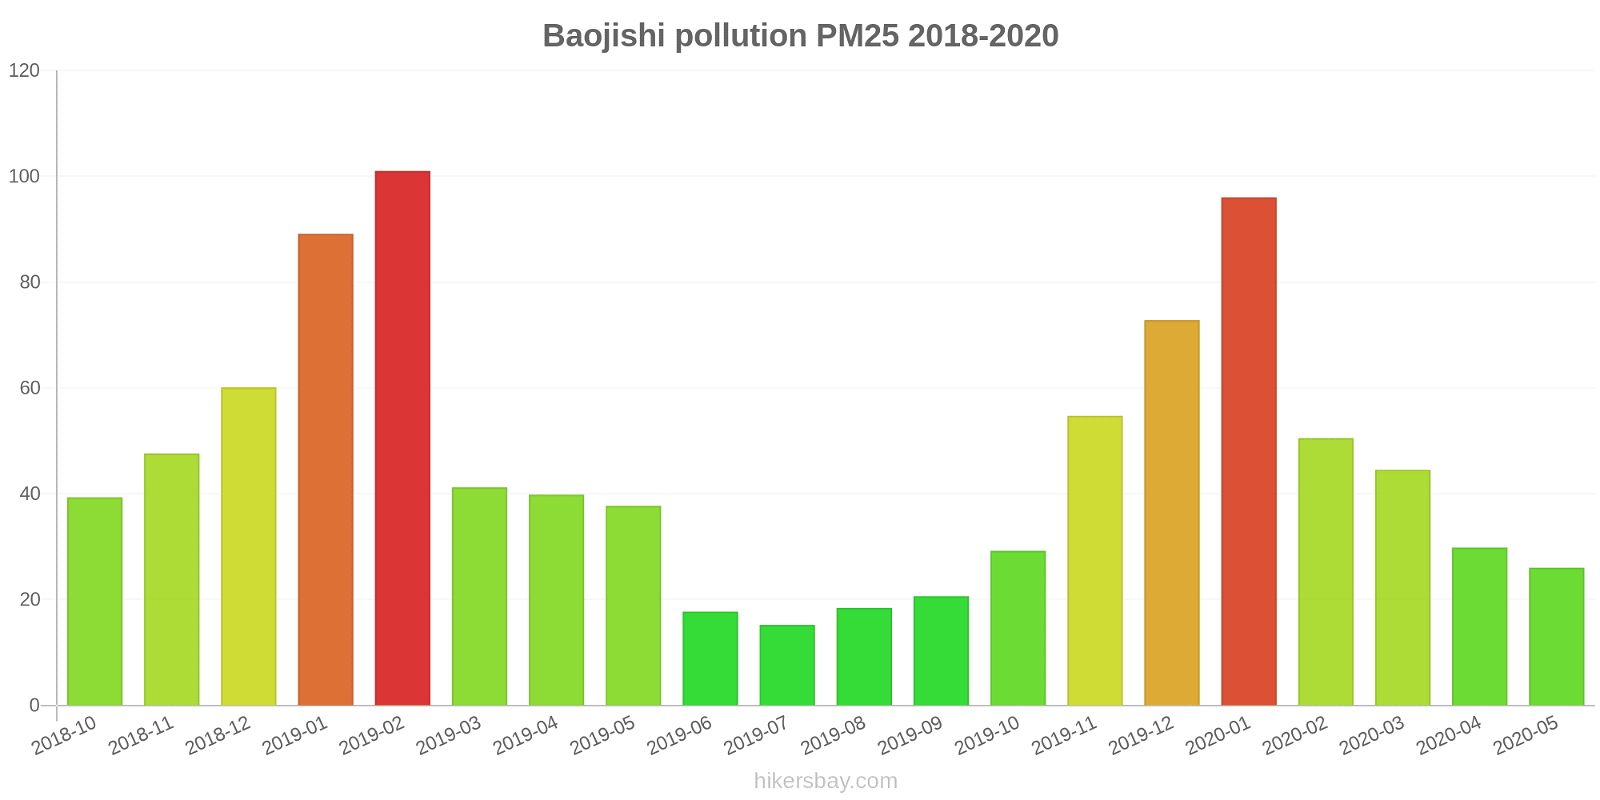
The highest PM2.5 values were recorded: 101 (February 2019).
The lowest level of particulate matter PM2.5 pollution occurs in month: July (15).
How is the O3 level today in Baojishi? (ozone (O3))
0 (Good)
How high is the level of NO2? (nitrogen dioxide (NO2))
0 (Good)
What is the level of SO2 pollution? (sulfur dioxide (SO2))
0 (Good)
Current data Friday, May 27, 2022, 12:00 PM
PM10 179 (Very bad Hazardous)
PM2,5 35 (Unhealthy for Sensitive Groups)
O3 0 (Good)
NO2 0 (Good)
SO2 0 (Good)
Data on air pollution from recent days in Baojishi
index
2022-05-27
pm10
56
Unhealthy for Sensitive Groups
pm25
56
Unhealthy
o3
0
Good
no2
0
Good
so2
0
Good
data source »
Air pollution in Baojishi from October 2018 to May 2020
index
2020-05
2020-04
2020-03
2020-02
2020-01
2019-12
2019-11
2019-10
2019-09
2019-08
2019-07
2019-06
2019-05
2019-04
2019-03
2019-02
2019-01
2018-12
2018-11
2018-10
pm25
26 (Moderate)
30 (Moderate)
45 (Unhealthy for Sensitive Groups)
51 (Unhealthy for Sensitive Groups)
96 (Very Unhealthy)
73 (Unhealthy)
55 (Unhealthy for Sensitive Groups)
29 (Moderate)
21 (Moderate)
18 (Moderate)
15 (Moderate)
18 (Moderate)
38 (Unhealthy for Sensitive Groups)
40 (Unhealthy for Sensitive Groups)
41 (Unhealthy for Sensitive Groups)
101 (Very Unhealthy)
89 (Very Unhealthy)
60 (Unhealthy)
48 (Unhealthy for Sensitive Groups)
39 (Unhealthy for Sensitive Groups)
co
451 (Good)
389 (Good)
423 (Good)
645 (Good)
1 (Good)
688 (Good)
622 (Good)
438 (Good)
418 (Good)
376 (Good)
362 (Good)
560 (Good)
494 (Good)
711 (Good)
694 (Good)
1 (Good)
1 (Good)
715 (Good)
516 (Good)
416 (Good)
no2
9.3 (Good)
16 (Good)
19 (Good)
13 (Good)
26 (Good)
32 (Good)
27 (Good)
18 (Good)
11 (Good)
12 (Good)
9.9 (Good)
6.9 (Good)
11 (Good)
16 (Good)
19 (Good)
18 (Good)
31 (Good)
33 (Good)
27 (Good)
21 (Good)
o3
132 (Unhealthy for Sensitive Groups)
129 (Unhealthy for Sensitive Groups)
109 (Moderate)
96 (Moderate)
72 (Moderate)
69 (Good)
70 (Moderate)
76 (Moderate)
108 (Moderate)
128 (Unhealthy for Sensitive Groups)
131 (Unhealthy for Sensitive Groups)
127 (Unhealthy for Sensitive Groups)
118 (Moderate)
124 (Unhealthy for Sensitive Groups)
102 (Moderate)
83 (Moderate)
79 (Moderate)
57 (Good)
69 (Good)
79 (Moderate)
pm10
66 (Unhealthy for Sensitive Groups)
60 (Unhealthy for Sensitive Groups)
104 (Unhealthy)
73 (Unhealthy for Sensitive Groups)
110 (Very Unhealthy)
96 (Unhealthy)
95 (Unhealthy)
60 (Unhealthy for Sensitive Groups)
42 (Moderate)
44 (Moderate)
38 (Moderate)
38 (Moderate)
98 (Unhealthy)
78 (Unhealthy for Sensitive Groups)
88 (Unhealthy)
125 (Very Unhealthy)
120 (Very Unhealthy)
130 (Very Unhealthy)
96 (Unhealthy)
79 (Unhealthy for Sensitive Groups)
so2
5.5 (Good)
5.8 (Good)
6.5 (Good)
7.9 (Good)
7.1 (Good)
6.8 (Good)
6.4 (Good)
5.1 (Good)
5 (Good)
4.6 (Good)
5.3 (Good)
4.7 (Good)
5.3 (Good)
6.2 (Good)
4.7 (Good)
4.7 (Good)
7.2 (Good)
6.6 (Good)
5.2 (Good)
4.9 (Good)
data source »
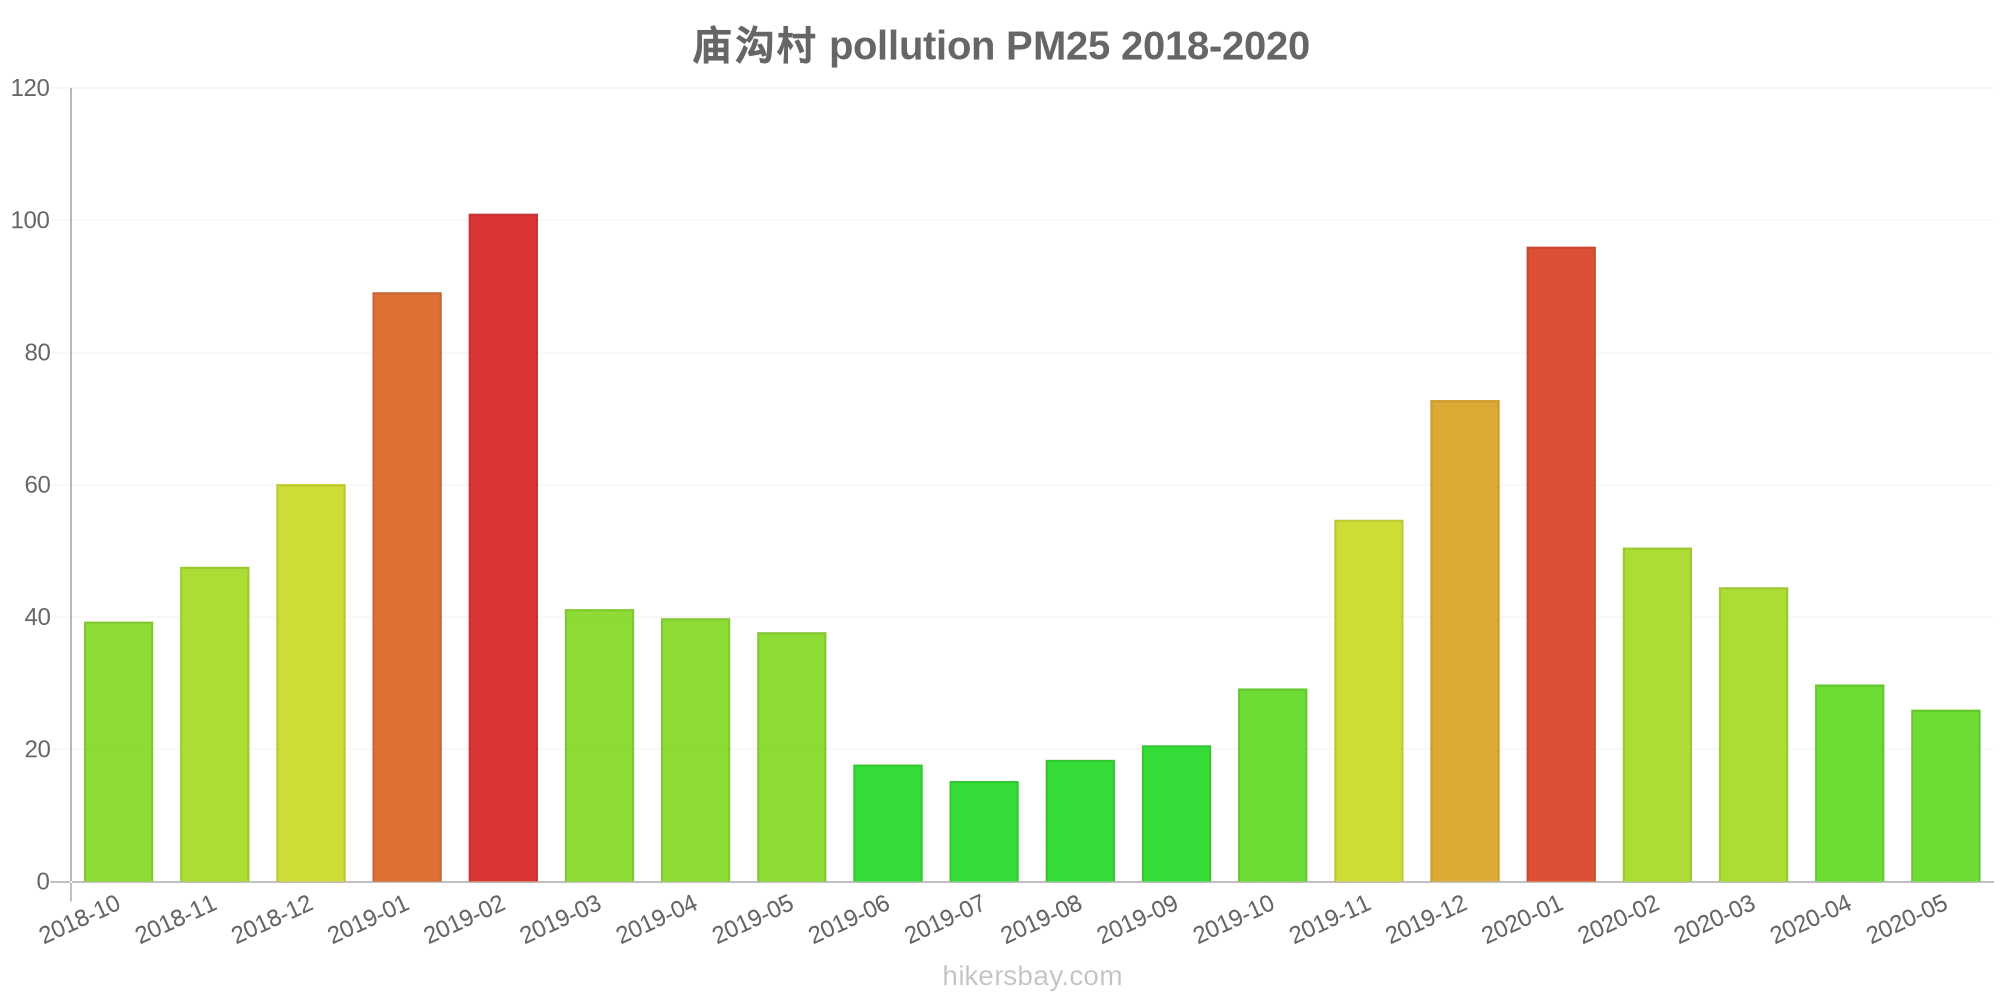
庙沟村
Friday, May 27, 2022, 12:00 PM
PM10 179 (Very bad Hazardous)
particulate matter (PM10) suspended dust
PM2,5 35 (Unhealthy for Sensitive Groups)
particulate matter (PM2.5) dust
O3 0.04 (Good)
ozone (O3)
NO2 0 (Good)
nitrogen dioxide (NO2)
SO2 0 (Good)
sulfur dioxide (SO2)
庙沟村
index
2022-05-27
pm10
56
pm25
56
o3
0.03
no2
0
so2
0
庙沟村
2018-10 2020-05

index
2020-05
2020-04
2020-03
2020-02
2020-01
2019-12
2019-11
2019-10
2019-09
2019-08
2019-07
2019-06
2019-05
2019-04
2019-03
2019-02
2019-01
2018-12
2018-11
2018-10
pm25
26
30
45
51
96
73
55
29
21
18
15
18
38
40
41
101
89
60
48
39
co
451
389
423
645
1
688
622
438
418
376
362
560
494
711
694
1
1
715
516
416
no2
9.3
16
19
13
26
32
27
18
11
12
9.9
6.9
11
16
19
18
31
33
27
21
o3
132
129
109
96
72
69
70
76
108
128
131
127
118
124
102
83
79
57
69
79
pm10
66
60
104
73
110
96
95
60
42
44
38
38
98
78
88
125
120
130
96
79
so2
5.5
5.8
6.5
7.9
7.1
6.8
6.4
5.1
5
4.6
5.3
4.7
5.3
6.2
4.7
4.7
7.2
6.6
5.2
4.9
* Pollution data source:
https://openaq.org
(ChinaAQIData)
The data is licensed under CC-By 4.0
PM10 179 (Very bad Hazardous)
PM2,5 35 (Unhealthy for Sensitive Groups)
O3 0 (Good)
NO2 0 (Good)
SO2 0 (Good)
Data on air pollution from recent days in Baojishi
| index | 2022-05-27 |
|---|---|
| pm10 | 56 Unhealthy for Sensitive Groups |
| pm25 | 56 Unhealthy |
| o3 | 0 Good |
| no2 | 0 Good |
| so2 | 0 Good |

| index | 2020-05 | 2020-04 | 2020-03 | 2020-02 | 2020-01 | 2019-12 | 2019-11 | 2019-10 | 2019-09 | 2019-08 | 2019-07 | 2019-06 | 2019-05 | 2019-04 | 2019-03 | 2019-02 | 2019-01 | 2018-12 | 2018-11 | 2018-10 |
|---|---|---|---|---|---|---|---|---|---|---|---|---|---|---|---|---|---|---|---|---|
| pm25 | 26 (Moderate) | 30 (Moderate) | 45 (Unhealthy for Sensitive Groups) | 51 (Unhealthy for Sensitive Groups) | 96 (Very Unhealthy) | 73 (Unhealthy) | 55 (Unhealthy for Sensitive Groups) | 29 (Moderate) | 21 (Moderate) | 18 (Moderate) | 15 (Moderate) | 18 (Moderate) | 38 (Unhealthy for Sensitive Groups) | 40 (Unhealthy for Sensitive Groups) | 41 (Unhealthy for Sensitive Groups) | 101 (Very Unhealthy) | 89 (Very Unhealthy) | 60 (Unhealthy) | 48 (Unhealthy for Sensitive Groups) | 39 (Unhealthy for Sensitive Groups) |
| co | 451 (Good) | 389 (Good) | 423 (Good) | 645 (Good) | 1 (Good) | 688 (Good) | 622 (Good) | 438 (Good) | 418 (Good) | 376 (Good) | 362 (Good) | 560 (Good) | 494 (Good) | 711 (Good) | 694 (Good) | 1 (Good) | 1 (Good) | 715 (Good) | 516 (Good) | 416 (Good) |
| no2 | 9.3 (Good) | 16 (Good) | 19 (Good) | 13 (Good) | 26 (Good) | 32 (Good) | 27 (Good) | 18 (Good) | 11 (Good) | 12 (Good) | 9.9 (Good) | 6.9 (Good) | 11 (Good) | 16 (Good) | 19 (Good) | 18 (Good) | 31 (Good) | 33 (Good) | 27 (Good) | 21 (Good) |
| o3 | 132 (Unhealthy for Sensitive Groups) | 129 (Unhealthy for Sensitive Groups) | 109 (Moderate) | 96 (Moderate) | 72 (Moderate) | 69 (Good) | 70 (Moderate) | 76 (Moderate) | 108 (Moderate) | 128 (Unhealthy for Sensitive Groups) | 131 (Unhealthy for Sensitive Groups) | 127 (Unhealthy for Sensitive Groups) | 118 (Moderate) | 124 (Unhealthy for Sensitive Groups) | 102 (Moderate) | 83 (Moderate) | 79 (Moderate) | 57 (Good) | 69 (Good) | 79 (Moderate) |
| pm10 | 66 (Unhealthy for Sensitive Groups) | 60 (Unhealthy for Sensitive Groups) | 104 (Unhealthy) | 73 (Unhealthy for Sensitive Groups) | 110 (Very Unhealthy) | 96 (Unhealthy) | 95 (Unhealthy) | 60 (Unhealthy for Sensitive Groups) | 42 (Moderate) | 44 (Moderate) | 38 (Moderate) | 38 (Moderate) | 98 (Unhealthy) | 78 (Unhealthy for Sensitive Groups) | 88 (Unhealthy) | 125 (Very Unhealthy) | 120 (Very Unhealthy) | 130 (Very Unhealthy) | 96 (Unhealthy) | 79 (Unhealthy for Sensitive Groups) |
| so2 | 5.5 (Good) | 5.8 (Good) | 6.5 (Good) | 7.9 (Good) | 7.1 (Good) | 6.8 (Good) | 6.4 (Good) | 5.1 (Good) | 5 (Good) | 4.6 (Good) | 5.3 (Good) | 4.7 (Good) | 5.3 (Good) | 6.2 (Good) | 4.7 (Good) | 4.7 (Good) | 7.2 (Good) | 6.6 (Good) | 5.2 (Good) | 4.9 (Good) |
PM10 179 (Very bad Hazardous)
particulate matter (PM10) suspended dustPM2,5 35 (Unhealthy for Sensitive Groups)
particulate matter (PM2.5) dustO3 0.04 (Good)
ozone (O3)NO2 0 (Good)
nitrogen dioxide (NO2)SO2 0 (Good)
sulfur dioxide (SO2)庙沟村
| index | 2022-05-27 |
|---|---|
| pm10 | 56 |
| pm25 | 56 |
| o3 | 0.03 |
| no2 | 0 |
| so2 | 0 |
庙沟村
| index | 2020-05 | 2020-04 | 2020-03 | 2020-02 | 2020-01 | 2019-12 | 2019-11 | 2019-10 | 2019-09 | 2019-08 | 2019-07 | 2019-06 | 2019-05 | 2019-04 | 2019-03 | 2019-02 | 2019-01 | 2018-12 | 2018-11 | 2018-10 |
|---|---|---|---|---|---|---|---|---|---|---|---|---|---|---|---|---|---|---|---|---|
| pm25 | 26 | 30 | 45 | 51 | 96 | 73 | 55 | 29 | 21 | 18 | 15 | 18 | 38 | 40 | 41 | 101 | 89 | 60 | 48 | 39 |
| co | 451 | 389 | 423 | 645 | 1 | 688 | 622 | 438 | 418 | 376 | 362 | 560 | 494 | 711 | 694 | 1 | 1 | 715 | 516 | 416 |
| no2 | 9.3 | 16 | 19 | 13 | 26 | 32 | 27 | 18 | 11 | 12 | 9.9 | 6.9 | 11 | 16 | 19 | 18 | 31 | 33 | 27 | 21 |
| o3 | 132 | 129 | 109 | 96 | 72 | 69 | 70 | 76 | 108 | 128 | 131 | 127 | 118 | 124 | 102 | 83 | 79 | 57 | 69 | 79 |
| pm10 | 66 | 60 | 104 | 73 | 110 | 96 | 95 | 60 | 42 | 44 | 38 | 38 | 98 | 78 | 88 | 125 | 120 | 130 | 96 | 79 |
| so2 | 5.5 | 5.8 | 6.5 | 7.9 | 7.1 | 6.8 | 6.4 | 5.1 | 5 | 4.6 | 5.3 | 4.7 | 5.3 | 6.2 | 4.7 | 4.7 | 7.2 | 6.6 | 5.2 | 4.9 |