Air Pollution in Gaojiacun: Real-time Air Quality Index and smog alert.
Pollution and air quality forecast for Gaojiacun. Today is Tuesday, June 2, 2026. The following air pollution values have been recorded for Gaojiacun:- particulate matter (PM10) suspended dust - 179 (Very bad Hazardous)
- particulate matter (PM2.5) dust - 35 (Unhealthy for Sensitive Groups)
- ozone (O3) - 0 (Good)
- nitrogen dioxide (NO2) - 0 (Good)
- sulfur dioxide (SO2) - 0 (Good)

What is the air quality in Gaojiacun today? Is the air polluted in Gaojiacun?. Is there smog?
What is the level of PM10 today in Gaojiacun? (particulate matter (PM10) suspended dust)
The current level of particulate matter PM10 in Gaojiacun is:
179 (Very bad Hazardous)
The highest PM10 values usually occur in month: 142 (January 2019).
The lowest value of particulate matter PM10 pollution in Gaojiacun is usually recorded in: July (52).
What is the current level of PM2.5 in Gaojiacun? (particulate matter (PM2.5) dust)
Today's PM2.5 level is:
35 (Unhealthy for Sensitive Groups)
For comparison, the highest level of PM2.5 in Gaojiacun in the last 7 days was: 56 (Friday, May 27, 2022) and the lowest: 56 (Friday, May 27, 2022).
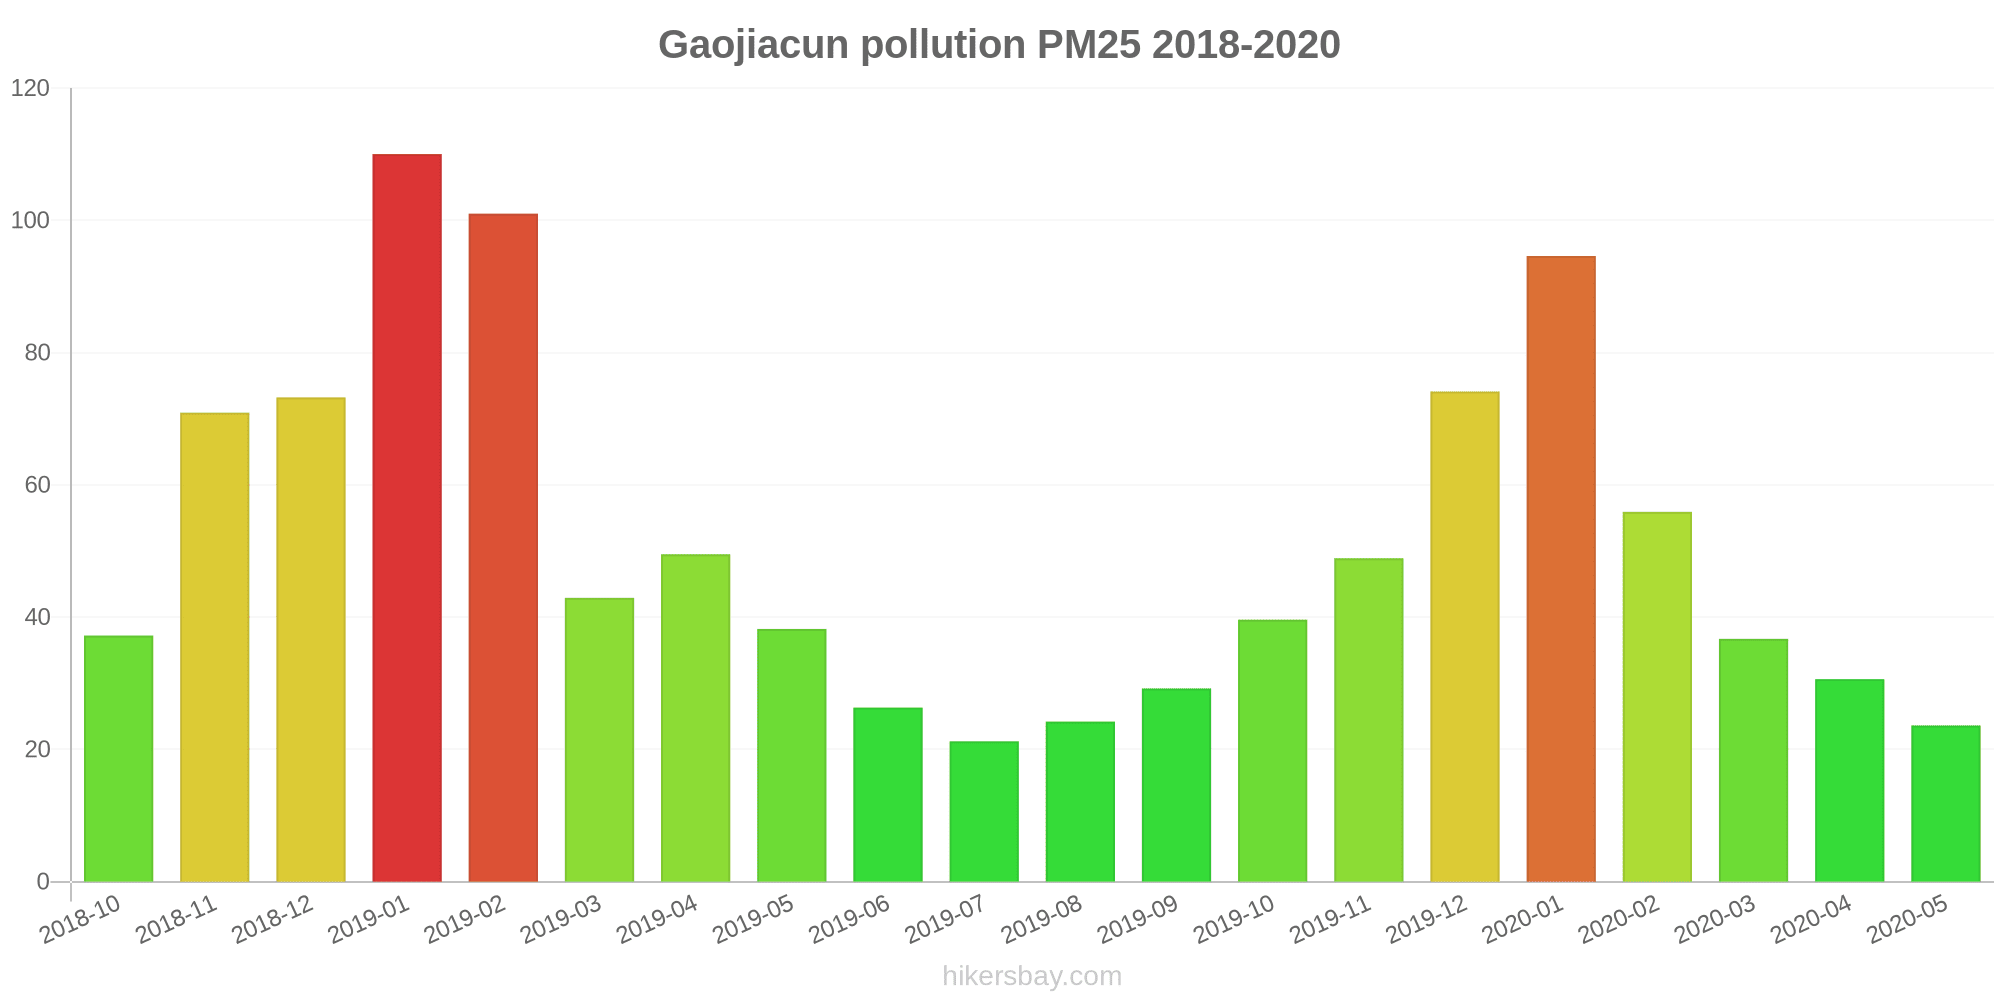
The highest PM2.5 values were recorded: 110 (January 2019).
The lowest level of particulate matter PM2.5 pollution occurs in month: July (21).
How is the O3 level today in Gaojiacun? (ozone (O3))
0 (Good)
How high is the level of NO2? (nitrogen dioxide (NO2))
0 (Good)
What is the level of SO2 pollution? (sulfur dioxide (SO2))
0 (Good)
Current data Friday, May 27, 2022, 12:00 PM
PM10 179 (Very bad Hazardous)
PM2,5 35 (Unhealthy for Sensitive Groups)
O3 0 (Good)
NO2 0 (Good)
SO2 0 (Good)
Data on air pollution from recent days in Gaojiacun
index
2022-05-27
pm10
56
Unhealthy for Sensitive Groups
pm25
56
Unhealthy
o3
0
Good
no2
0
Good
so2
0
Good
data source »
Air pollution in Gaojiacun from October 2018 to May 2020

index
2020-05
2020-04
2020-03
2020-02
2020-01
2019-12
2019-11
2019-10
2019-09
2019-08
2019-07
2019-06
2019-05
2019-04
2019-03
2019-02
2019-01
2018-12
2018-11
2018-10
pm25
24 (Moderate)
31 (Moderate)
37 (Unhealthy for Sensitive Groups)
56 (Unhealthy)
95 (Very Unhealthy)
74 (Unhealthy)
49 (Unhealthy for Sensitive Groups)
40 (Unhealthy for Sensitive Groups)
29 (Moderate)
24 (Moderate)
21 (Moderate)
26 (Moderate)
38 (Unhealthy for Sensitive Groups)
50 (Unhealthy for Sensitive Groups)
43 (Unhealthy for Sensitive Groups)
101 (Very Unhealthy)
110 (Very bad Hazardous)
73 (Unhealthy)
71 (Unhealthy)
37 (Unhealthy for Sensitive Groups)
co
434 (Good)
632 (Good)
596 (Good)
823 (Good)
1 (Good)
896 (Good)
815 (Good)
971 (Good)
815 (Good)
774 (Good)
667 (Good)
688 (Good)
522 (Good)
851 (Good)
636 (Good)
1 (Good)
1 (Good)
1 (Good)
1 (Good)
1 (Good)
no2
28 (Good)
48 (Moderate)
42 (Moderate)
22 (Good)
39 (Good)
55 (Moderate)
49 (Moderate)
42 (Moderate)
36 (Good)
35 (Good)
29 (Good)
28 (Good)
33 (Good)
35 (Good)
39 (Good)
30 (Good)
55 (Moderate)
57 (Moderate)
52 (Moderate)
32 (Good)
o3
144 (Unhealthy for Sensitive Groups)
118 (Moderate)
101 (Moderate)
95 (Moderate)
70 (Good)
65 (Good)
65 (Good)
79 (Moderate)
126 (Unhealthy for Sensitive Groups)
143 (Unhealthy for Sensitive Groups)
152 (Unhealthy)
153 (Unhealthy)
139 (Unhealthy for Sensitive Groups)
139 (Unhealthy for Sensitive Groups)
127 (Unhealthy for Sensitive Groups)
103 (Moderate)
78 (Moderate)
54 (Good)
79 (Moderate)
105 (Moderate)
pm10
63 (Unhealthy for Sensitive Groups)
85 (Unhealthy)
100 (Unhealthy)
84 (Unhealthy)
118 (Very Unhealthy)
110 (Very Unhealthy)
101 (Unhealthy)
80 (Unhealthy for Sensitive Groups)
52 (Unhealthy for Sensitive Groups)
52 (Unhealthy for Sensitive Groups)
52 (Unhealthy for Sensitive Groups)
55 (Unhealthy for Sensitive Groups)
99 (Unhealthy)
82 (Unhealthy)
101 (Unhealthy)
130 (Very Unhealthy)
142 (Very Unhealthy)
137 (Very Unhealthy)
121 (Very Unhealthy)
68 (Unhealthy for Sensitive Groups)
so2
9.9 (Good)
9.8 (Good)
9.9 (Good)
11 (Good)
15 (Good)
18 (Good)
8.7 (Good)
5.3 (Good)
6.6 (Good)
5.4 (Good)
5.5 (Good)
6.7 (Good)
8.7 (Good)
9.9 (Good)
13 (Good)
19 (Good)
33 (Good)
32 (Good)
20 (Good)
16 (Good)
data source »
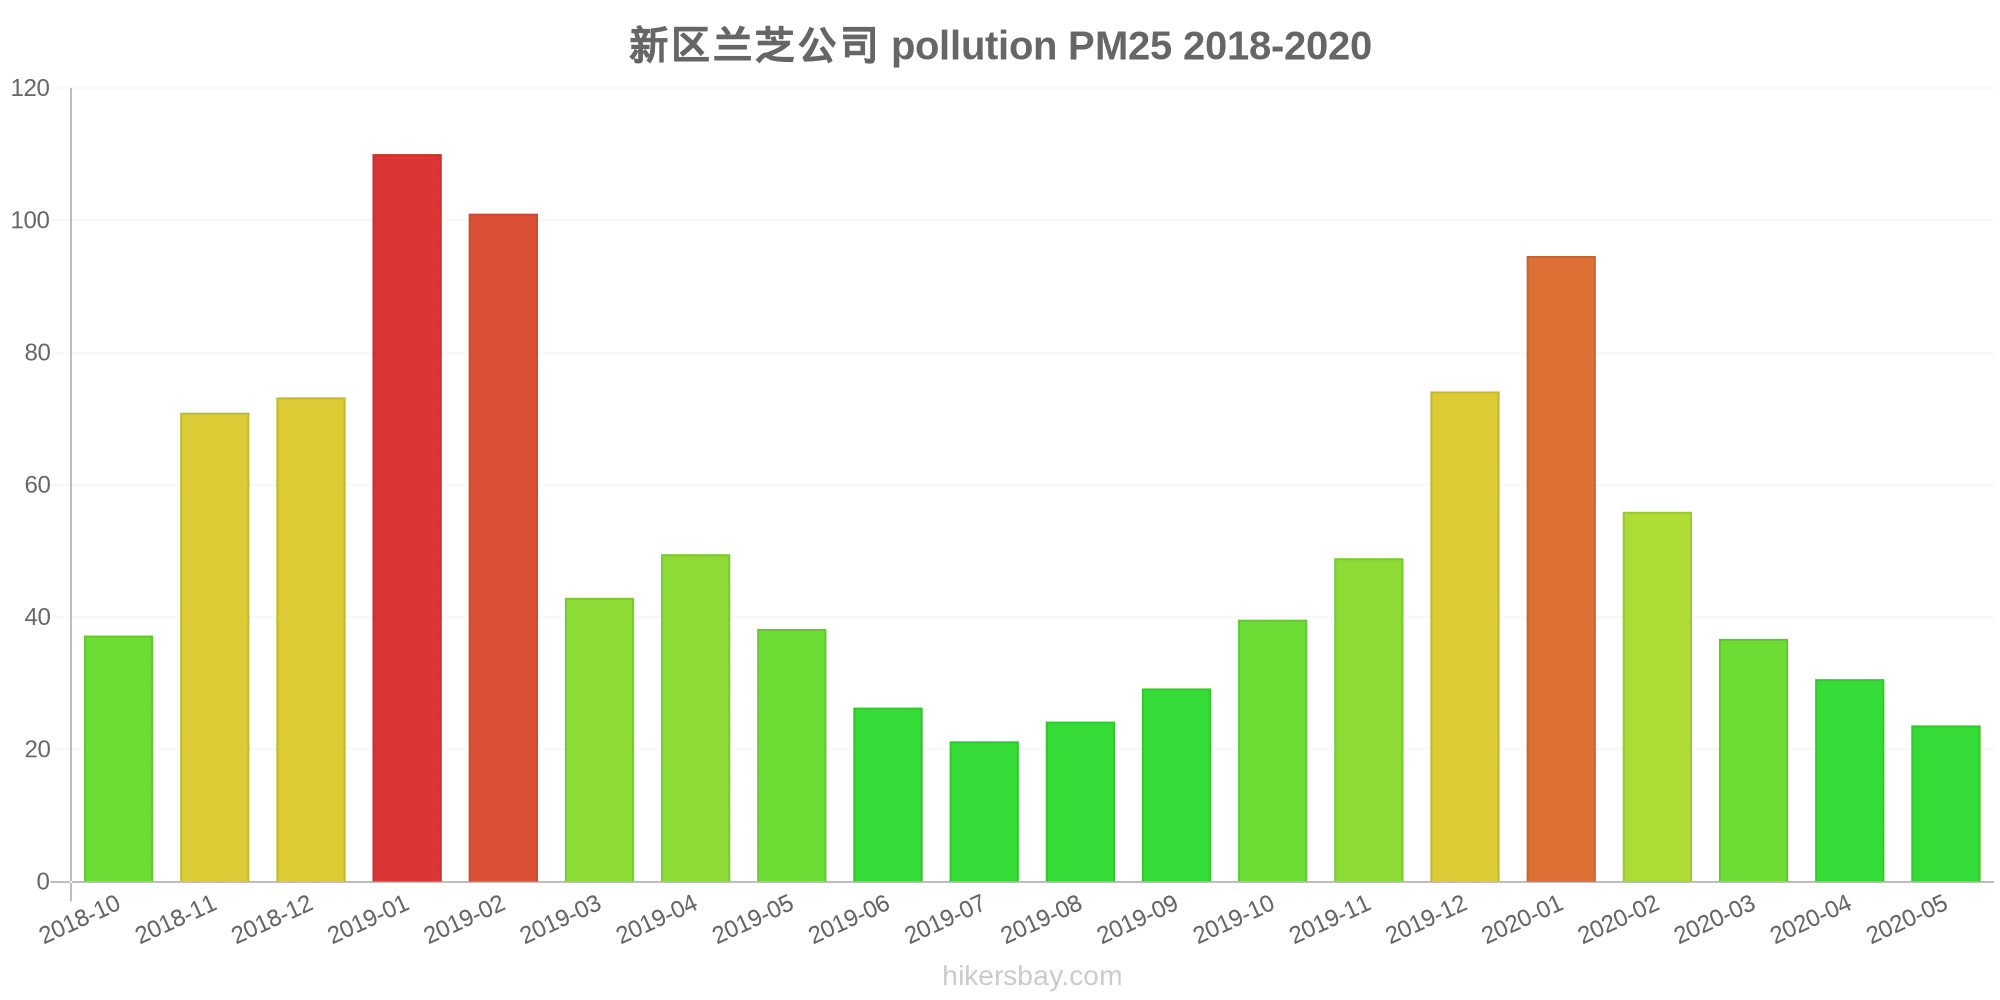
新区兰芝公司
Friday, May 27, 2022, 12:00 PM
PM10 179 (Very bad Hazardous)
particulate matter (PM10) suspended dust
PM2,5 35 (Unhealthy for Sensitive Groups)
particulate matter (PM2.5) dust
O3 0.04 (Good)
ozone (O3)
NO2 0 (Good)
nitrogen dioxide (NO2)
SO2 0 (Good)
sulfur dioxide (SO2)
新区兰芝公司
index
2022-05-27
pm10
56
pm25
56
o3
0.03
no2
0
so2
0
新区兰芝公司
2018-10 2020-05

index
2020-05
2020-04
2020-03
2020-02
2020-01
2019-12
2019-11
2019-10
2019-09
2019-08
2019-07
2019-06
2019-05
2019-04
2019-03
2019-02
2019-01
2018-12
2018-11
2018-10
pm25
24
31
37
56
95
74
49
40
29
24
21
26
38
50
43
101
110
73
71
37
co
434
632
596
823
1
896
815
971
815
774
667
688
522
851
636
1
1
1
1
1
no2
28
48
42
22
39
55
49
42
36
35
29
28
33
35
39
30
55
57
52
32
o3
144
118
101
95
70
65
65
79
126
143
152
153
139
139
127
103
78
54
79
105
pm10
63
85
100
84
118
110
101
80
52
52
52
55
99
82
101
130
142
137
121
68
so2
9.9
9.8
9.9
11
15
18
8.7
5.3
6.6
5.4
5.5
6.7
8.7
9.9
13
19
33
32
20
16
* Pollution data source:
https://openaq.org
(ChinaAQIData)
The data is licensed under CC-By 4.0
PM10 179 (Very bad Hazardous)
PM2,5 35 (Unhealthy for Sensitive Groups)
O3 0 (Good)
NO2 0 (Good)
SO2 0 (Good)
Data on air pollution from recent days in Gaojiacun
| index | 2022-05-27 |
|---|---|
| pm10 | 56 Unhealthy for Sensitive Groups |
| pm25 | 56 Unhealthy |
| o3 | 0 Good |
| no2 | 0 Good |
| so2 | 0 Good |
| index | 2020-05 | 2020-04 | 2020-03 | 2020-02 | 2020-01 | 2019-12 | 2019-11 | 2019-10 | 2019-09 | 2019-08 | 2019-07 | 2019-06 | 2019-05 | 2019-04 | 2019-03 | 2019-02 | 2019-01 | 2018-12 | 2018-11 | 2018-10 |
|---|---|---|---|---|---|---|---|---|---|---|---|---|---|---|---|---|---|---|---|---|
| pm25 | 24 (Moderate) | 31 (Moderate) | 37 (Unhealthy for Sensitive Groups) | 56 (Unhealthy) | 95 (Very Unhealthy) | 74 (Unhealthy) | 49 (Unhealthy for Sensitive Groups) | 40 (Unhealthy for Sensitive Groups) | 29 (Moderate) | 24 (Moderate) | 21 (Moderate) | 26 (Moderate) | 38 (Unhealthy for Sensitive Groups) | 50 (Unhealthy for Sensitive Groups) | 43 (Unhealthy for Sensitive Groups) | 101 (Very Unhealthy) | 110 (Very bad Hazardous) | 73 (Unhealthy) | 71 (Unhealthy) | 37 (Unhealthy for Sensitive Groups) |
| co | 434 (Good) | 632 (Good) | 596 (Good) | 823 (Good) | 1 (Good) | 896 (Good) | 815 (Good) | 971 (Good) | 815 (Good) | 774 (Good) | 667 (Good) | 688 (Good) | 522 (Good) | 851 (Good) | 636 (Good) | 1 (Good) | 1 (Good) | 1 (Good) | 1 (Good) | 1 (Good) |
| no2 | 28 (Good) | 48 (Moderate) | 42 (Moderate) | 22 (Good) | 39 (Good) | 55 (Moderate) | 49 (Moderate) | 42 (Moderate) | 36 (Good) | 35 (Good) | 29 (Good) | 28 (Good) | 33 (Good) | 35 (Good) | 39 (Good) | 30 (Good) | 55 (Moderate) | 57 (Moderate) | 52 (Moderate) | 32 (Good) |
| o3 | 144 (Unhealthy for Sensitive Groups) | 118 (Moderate) | 101 (Moderate) | 95 (Moderate) | 70 (Good) | 65 (Good) | 65 (Good) | 79 (Moderate) | 126 (Unhealthy for Sensitive Groups) | 143 (Unhealthy for Sensitive Groups) | 152 (Unhealthy) | 153 (Unhealthy) | 139 (Unhealthy for Sensitive Groups) | 139 (Unhealthy for Sensitive Groups) | 127 (Unhealthy for Sensitive Groups) | 103 (Moderate) | 78 (Moderate) | 54 (Good) | 79 (Moderate) | 105 (Moderate) |
| pm10 | 63 (Unhealthy for Sensitive Groups) | 85 (Unhealthy) | 100 (Unhealthy) | 84 (Unhealthy) | 118 (Very Unhealthy) | 110 (Very Unhealthy) | 101 (Unhealthy) | 80 (Unhealthy for Sensitive Groups) | 52 (Unhealthy for Sensitive Groups) | 52 (Unhealthy for Sensitive Groups) | 52 (Unhealthy for Sensitive Groups) | 55 (Unhealthy for Sensitive Groups) | 99 (Unhealthy) | 82 (Unhealthy) | 101 (Unhealthy) | 130 (Very Unhealthy) | 142 (Very Unhealthy) | 137 (Very Unhealthy) | 121 (Very Unhealthy) | 68 (Unhealthy for Sensitive Groups) |
| so2 | 9.9 (Good) | 9.8 (Good) | 9.9 (Good) | 11 (Good) | 15 (Good) | 18 (Good) | 8.7 (Good) | 5.3 (Good) | 6.6 (Good) | 5.4 (Good) | 5.5 (Good) | 6.7 (Good) | 8.7 (Good) | 9.9 (Good) | 13 (Good) | 19 (Good) | 33 (Good) | 32 (Good) | 20 (Good) | 16 (Good) |
PM10 179 (Very bad Hazardous)
particulate matter (PM10) suspended dustPM2,5 35 (Unhealthy for Sensitive Groups)
particulate matter (PM2.5) dustO3 0.04 (Good)
ozone (O3)NO2 0 (Good)
nitrogen dioxide (NO2)SO2 0 (Good)
sulfur dioxide (SO2)新区兰芝公司
| index | 2022-05-27 |
|---|---|
| pm10 | 56 |
| pm25 | 56 |
| o3 | 0.03 |
| no2 | 0 |
| so2 | 0 |
新区兰芝公司
| index | 2020-05 | 2020-04 | 2020-03 | 2020-02 | 2020-01 | 2019-12 | 2019-11 | 2019-10 | 2019-09 | 2019-08 | 2019-07 | 2019-06 | 2019-05 | 2019-04 | 2019-03 | 2019-02 | 2019-01 | 2018-12 | 2018-11 | 2018-10 |
|---|---|---|---|---|---|---|---|---|---|---|---|---|---|---|---|---|---|---|---|---|
| pm25 | 24 | 31 | 37 | 56 | 95 | 74 | 49 | 40 | 29 | 24 | 21 | 26 | 38 | 50 | 43 | 101 | 110 | 73 | 71 | 37 |
| co | 434 | 632 | 596 | 823 | 1 | 896 | 815 | 971 | 815 | 774 | 667 | 688 | 522 | 851 | 636 | 1 | 1 | 1 | 1 | 1 |
| no2 | 28 | 48 | 42 | 22 | 39 | 55 | 49 | 42 | 36 | 35 | 29 | 28 | 33 | 35 | 39 | 30 | 55 | 57 | 52 | 32 |
| o3 | 144 | 118 | 101 | 95 | 70 | 65 | 65 | 79 | 126 | 143 | 152 | 153 | 139 | 139 | 127 | 103 | 78 | 54 | 79 | 105 |
| pm10 | 63 | 85 | 100 | 84 | 118 | 110 | 101 | 80 | 52 | 52 | 52 | 55 | 99 | 82 | 101 | 130 | 142 | 137 | 121 | 68 |
| so2 | 9.9 | 9.8 | 9.9 | 11 | 15 | 18 | 8.7 | 5.3 | 6.6 | 5.4 | 5.5 | 6.7 | 8.7 | 9.9 | 13 | 19 | 33 | 32 | 20 | 16 |