Air Pollution in Shaolou: Real-time Air Quality Index and smog alert.
Pollution and air quality forecast for Shaolou. Today is Tuesday, June 2, 2026. The following air pollution values have been recorded for Shaolou:- particulate matter (PM10) suspended dust - 179 (Very bad Hazardous)
- particulate matter (PM2.5) dust - 35 (Unhealthy for Sensitive Groups)
- ozone (O3) - 0 (Good)
- nitrogen dioxide (NO2) - 0 (Good)
- sulfur dioxide (SO2) - 0 (Good)

What is the air quality in Shaolou today? Is the air polluted in Shaolou?. Is there smog?
What is the level of PM10 today in Shaolou? (particulate matter (PM10) suspended dust)
The current level of particulate matter PM10 in Shaolou is:
179 (Very bad Hazardous)
The highest PM10 values usually occur in month: 156 (January 2019).
The lowest value of particulate matter PM10 pollution in Shaolou is usually recorded in: August (57).
What is the current level of PM2.5 in Shaolou? (particulate matter (PM2.5) dust)
Today's PM2.5 level is:
35 (Unhealthy for Sensitive Groups)
For comparison, the highest level of PM2.5 in Shaolou in the last 7 days was: 56 (Friday, May 27, 2022) and the lowest: 56 (Friday, May 27, 2022).
The highest PM2.5 values were recorded: 101 (January 2019).
The lowest level of particulate matter PM2.5 pollution occurs in month: August (26).
How is the O3 level today in Shaolou? (ozone (O3))
0 (Good)
How high is the level of NO2? (nitrogen dioxide (NO2))
0 (Good)
What is the level of SO2 pollution? (sulfur dioxide (SO2))
0 (Good)
Current data Friday, May 27, 2022, 12:00 PM
PM10 179 (Very bad Hazardous)
PM2,5 35 (Unhealthy for Sensitive Groups)
O3 0 (Good)
NO2 0 (Good)
SO2 0 (Good)
Data on air pollution from recent days in Shaolou
index
2022-05-27
pm10
56
Unhealthy for Sensitive Groups
pm25
56
Unhealthy
o3
0
Good
no2
0
Good
so2
0
Good
data source »
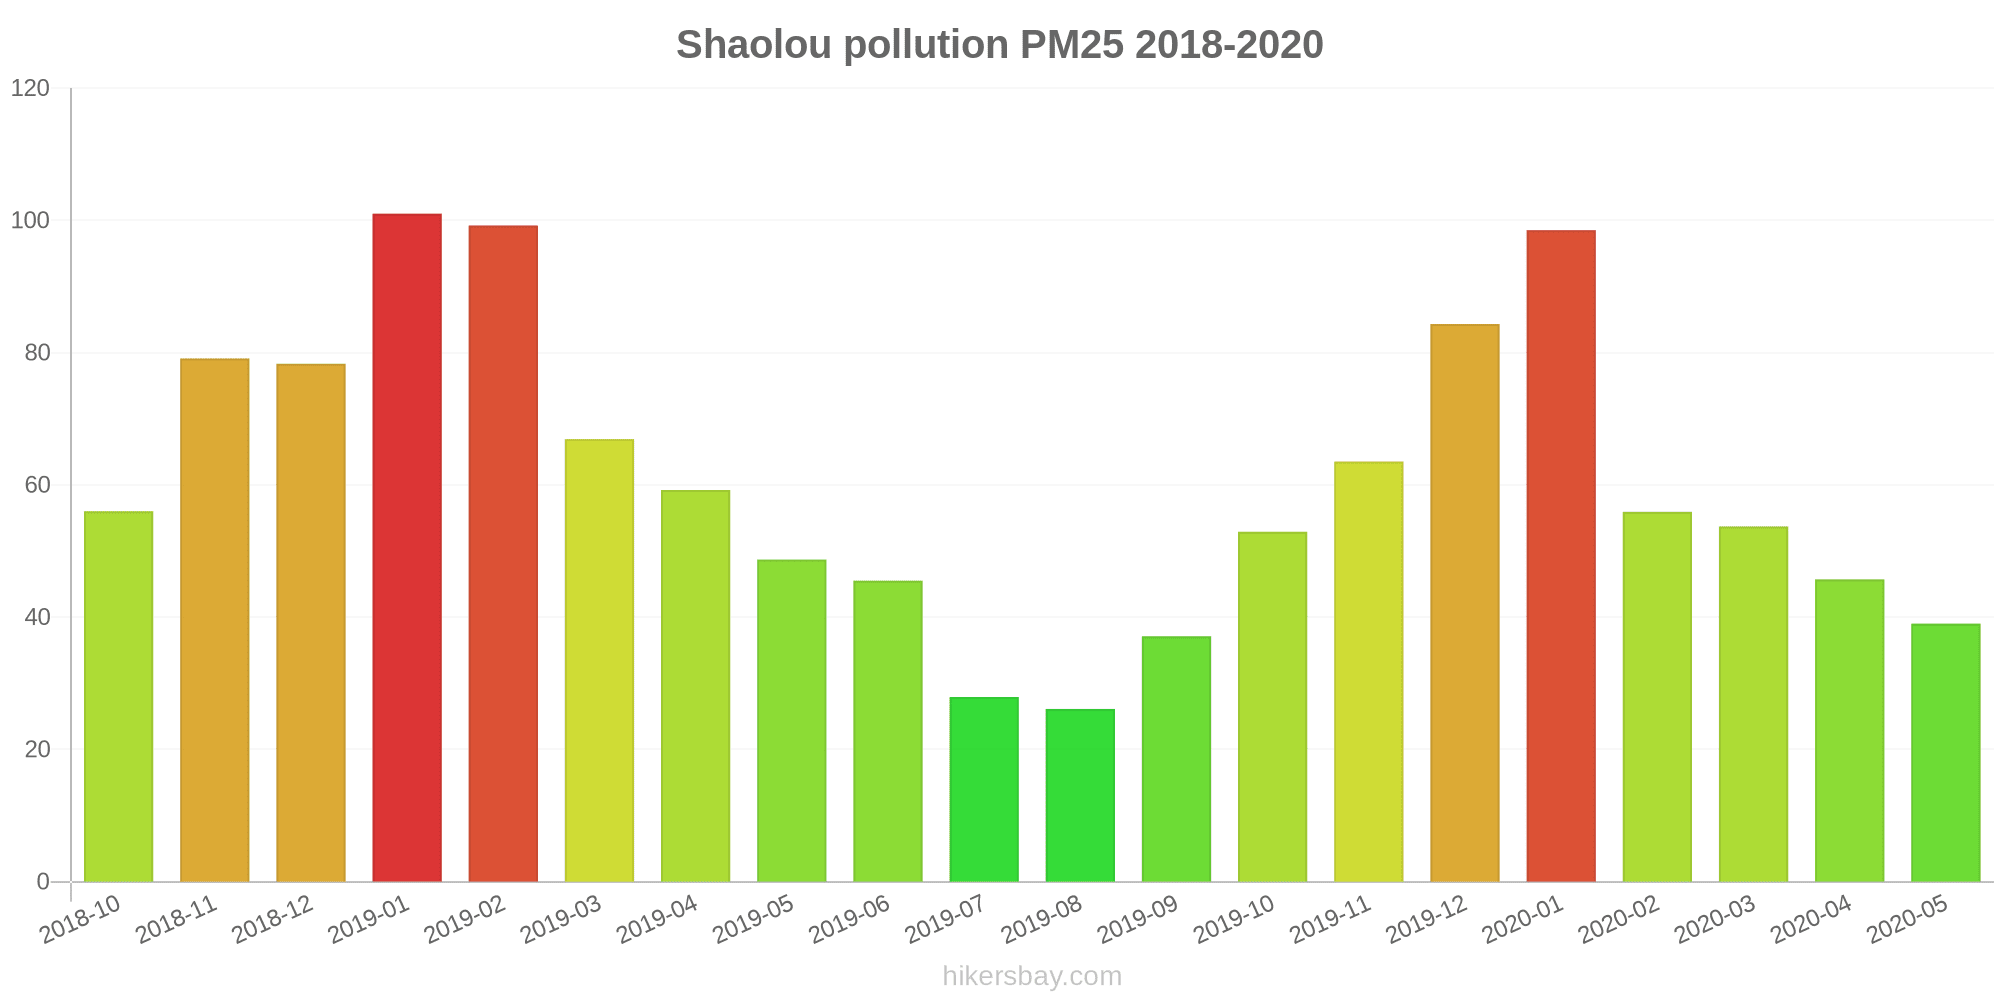
Air pollution in Shaolou from October 2018 to May 2020

index
2020-05
2020-04
2020-03
2020-02
2020-01
2019-12
2019-11
2019-10
2019-09
2019-08
2019-07
2019-06
2019-05
2019-04
2019-03
2019-02
2019-01
2018-12
2018-11
2018-10
pm25
39 (Unhealthy for Sensitive Groups)
46 (Unhealthy for Sensitive Groups)
54 (Unhealthy for Sensitive Groups)
56 (Unhealthy)
99 (Very Unhealthy)
84 (Very Unhealthy)
64 (Unhealthy)
53 (Unhealthy for Sensitive Groups)
37 (Unhealthy for Sensitive Groups)
26 (Moderate)
28 (Moderate)
46 (Unhealthy for Sensitive Groups)
49 (Unhealthy for Sensitive Groups)
59 (Unhealthy)
67 (Unhealthy)
99 (Very Unhealthy)
101 (Very Unhealthy)
78 (Very Unhealthy)
79 (Very Unhealthy)
56 (Unhealthy)
co
629 (Good)
706 (Good)
818 (Good)
909 (Good)
1 (Good)
1 (Good)
815 (Good)
824 (Good)
760 (Good)
557 (Good)
533 (Good)
711 (Good)
573 (Good)
729 (Good)
796 (Good)
1 (Good)
1 (Good)
926 (Good)
1 (Good)
853 (Good)
no2
21 (Good)
40 (Good)
39 (Good)
17 (Good)
38 (Good)
50 (Moderate)
47 (Moderate)
50 (Moderate)
34 (Good)
24 (Good)
17 (Good)
19 (Good)
33 (Good)
31 (Good)
43 (Moderate)
32 (Good)
47 (Moderate)
45 (Moderate)
48 (Moderate)
55 (Moderate)
o3
133 (Unhealthy for Sensitive Groups)
137 (Unhealthy for Sensitive Groups)
102 (Moderate)
89 (Moderate)
74 (Moderate)
62 (Good)
98 (Moderate)
127 (Unhealthy for Sensitive Groups)
180 (Very Unhealthy)
144 (Unhealthy for Sensitive Groups)
175 (Unhealthy)
201 (Very Unhealthy)
160 (Unhealthy)
132 (Unhealthy for Sensitive Groups)
125 (Unhealthy for Sensitive Groups)
89 (Moderate)
59 (Good)
51 (Good)
93 (Moderate)
115 (Moderate)
pm10
70 (Unhealthy for Sensitive Groups)
83 (Unhealthy)
89 (Unhealthy)
72 (Unhealthy for Sensitive Groups)
132 (Very Unhealthy)
113 (Very Unhealthy)
122 (Very Unhealthy)
121 (Very Unhealthy)
84 (Unhealthy)
57 (Unhealthy for Sensitive Groups)
64 (Unhealthy for Sensitive Groups)
88 (Unhealthy)
96 (Unhealthy)
96 (Unhealthy)
123 (Very Unhealthy)
137 (Very Unhealthy)
156 (Very bad Hazardous)
135 (Very Unhealthy)
135 (Very Unhealthy)
121 (Very Unhealthy)
so2
7.3 (Good)
10 (Good)
8.9 (Good)
6.5 (Good)
10 (Good)
10 (Good)
12 (Good)
10 (Good)
10 (Good)
7.2 (Good)
3.3 (Good)
3.8 (Good)
5.6 (Good)
5.2 (Good)
7.6 (Good)
7.4 (Good)
9.2 (Good)
13 (Good)
14 (Good)
18 (Good)
data source »
新城区
Friday, May 27, 2022, 12:00 PM
PM10 179 (Very bad Hazardous)
particulate matter (PM10) suspended dust
PM2,5 35 (Unhealthy for Sensitive Groups)
particulate matter (PM2.5) dust
O3 0.04 (Good)
ozone (O3)
NO2 0 (Good)
nitrogen dioxide (NO2)
SO2 0 (Good)
sulfur dioxide (SO2)
新城区
index
2022-05-27
pm10
56
pm25
56
o3
0.03
no2
0
so2
0
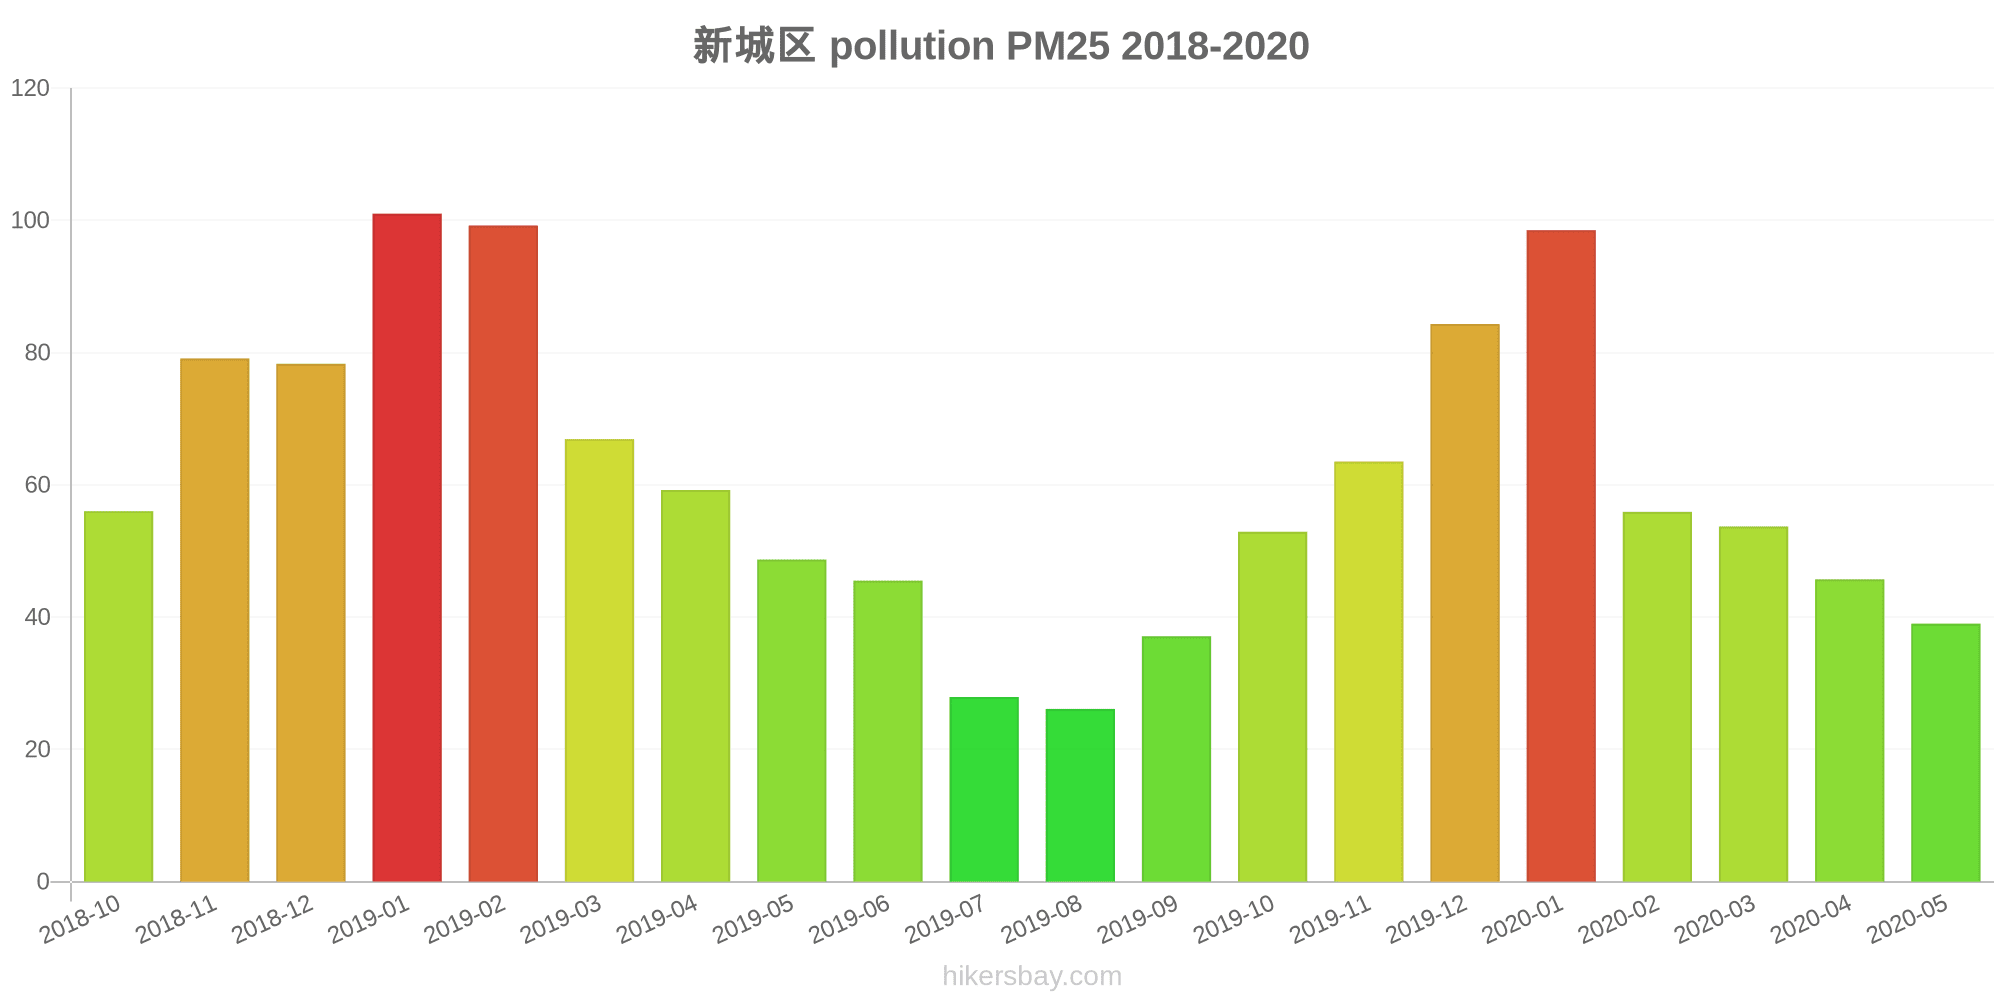
新城区
2018-10 2020-05

index
2020-05
2020-04
2020-03
2020-02
2020-01
2019-12
2019-11
2019-10
2019-09
2019-08
2019-07
2019-06
2019-05
2019-04
2019-03
2019-02
2019-01
2018-12
2018-11
2018-10
pm25
39
46
54
56
99
84
64
53
37
26
28
46
49
59
67
99
101
78
79
56
co
629
706
818
909
1
1
815
824
760
557
533
711
573
729
796
1
1
926
1
853
no2
21
40
39
17
38
50
47
50
34
24
17
19
33
31
43
32
47
45
48
55
o3
133
137
102
89
74
62
98
127
180
144
175
201
160
132
125
89
59
51
93
115
pm10
70
83
89
72
132
113
122
121
84
57
64
88
96
96
123
137
156
135
135
121
so2
7.3
10
8.9
6.5
10
10
12
10
10
7.2
3.3
3.8
5.6
5.2
7.6
7.4
9.2
13
14
18
* Pollution data source:
https://openaq.org
(ChinaAQIData)
The data is licensed under CC-By 4.0
PM10 179 (Very bad Hazardous)
PM2,5 35 (Unhealthy for Sensitive Groups)
O3 0 (Good)
NO2 0 (Good)
SO2 0 (Good)
Data on air pollution from recent days in Shaolou
| index | 2022-05-27 |
|---|---|
| pm10 | 56 Unhealthy for Sensitive Groups |
| pm25 | 56 Unhealthy |
| o3 | 0 Good |
| no2 | 0 Good |
| so2 | 0 Good |
| index | 2020-05 | 2020-04 | 2020-03 | 2020-02 | 2020-01 | 2019-12 | 2019-11 | 2019-10 | 2019-09 | 2019-08 | 2019-07 | 2019-06 | 2019-05 | 2019-04 | 2019-03 | 2019-02 | 2019-01 | 2018-12 | 2018-11 | 2018-10 |
|---|---|---|---|---|---|---|---|---|---|---|---|---|---|---|---|---|---|---|---|---|
| pm25 | 39 (Unhealthy for Sensitive Groups) | 46 (Unhealthy for Sensitive Groups) | 54 (Unhealthy for Sensitive Groups) | 56 (Unhealthy) | 99 (Very Unhealthy) | 84 (Very Unhealthy) | 64 (Unhealthy) | 53 (Unhealthy for Sensitive Groups) | 37 (Unhealthy for Sensitive Groups) | 26 (Moderate) | 28 (Moderate) | 46 (Unhealthy for Sensitive Groups) | 49 (Unhealthy for Sensitive Groups) | 59 (Unhealthy) | 67 (Unhealthy) | 99 (Very Unhealthy) | 101 (Very Unhealthy) | 78 (Very Unhealthy) | 79 (Very Unhealthy) | 56 (Unhealthy) |
| co | 629 (Good) | 706 (Good) | 818 (Good) | 909 (Good) | 1 (Good) | 1 (Good) | 815 (Good) | 824 (Good) | 760 (Good) | 557 (Good) | 533 (Good) | 711 (Good) | 573 (Good) | 729 (Good) | 796 (Good) | 1 (Good) | 1 (Good) | 926 (Good) | 1 (Good) | 853 (Good) |
| no2 | 21 (Good) | 40 (Good) | 39 (Good) | 17 (Good) | 38 (Good) | 50 (Moderate) | 47 (Moderate) | 50 (Moderate) | 34 (Good) | 24 (Good) | 17 (Good) | 19 (Good) | 33 (Good) | 31 (Good) | 43 (Moderate) | 32 (Good) | 47 (Moderate) | 45 (Moderate) | 48 (Moderate) | 55 (Moderate) |
| o3 | 133 (Unhealthy for Sensitive Groups) | 137 (Unhealthy for Sensitive Groups) | 102 (Moderate) | 89 (Moderate) | 74 (Moderate) | 62 (Good) | 98 (Moderate) | 127 (Unhealthy for Sensitive Groups) | 180 (Very Unhealthy) | 144 (Unhealthy for Sensitive Groups) | 175 (Unhealthy) | 201 (Very Unhealthy) | 160 (Unhealthy) | 132 (Unhealthy for Sensitive Groups) | 125 (Unhealthy for Sensitive Groups) | 89 (Moderate) | 59 (Good) | 51 (Good) | 93 (Moderate) | 115 (Moderate) |
| pm10 | 70 (Unhealthy for Sensitive Groups) | 83 (Unhealthy) | 89 (Unhealthy) | 72 (Unhealthy for Sensitive Groups) | 132 (Very Unhealthy) | 113 (Very Unhealthy) | 122 (Very Unhealthy) | 121 (Very Unhealthy) | 84 (Unhealthy) | 57 (Unhealthy for Sensitive Groups) | 64 (Unhealthy for Sensitive Groups) | 88 (Unhealthy) | 96 (Unhealthy) | 96 (Unhealthy) | 123 (Very Unhealthy) | 137 (Very Unhealthy) | 156 (Very bad Hazardous) | 135 (Very Unhealthy) | 135 (Very Unhealthy) | 121 (Very Unhealthy) |
| so2 | 7.3 (Good) | 10 (Good) | 8.9 (Good) | 6.5 (Good) | 10 (Good) | 10 (Good) | 12 (Good) | 10 (Good) | 10 (Good) | 7.2 (Good) | 3.3 (Good) | 3.8 (Good) | 5.6 (Good) | 5.2 (Good) | 7.6 (Good) | 7.4 (Good) | 9.2 (Good) | 13 (Good) | 14 (Good) | 18 (Good) |
PM10 179 (Very bad Hazardous)
particulate matter (PM10) suspended dustPM2,5 35 (Unhealthy for Sensitive Groups)
particulate matter (PM2.5) dustO3 0.04 (Good)
ozone (O3)NO2 0 (Good)
nitrogen dioxide (NO2)SO2 0 (Good)
sulfur dioxide (SO2)新城区
| index | 2022-05-27 |
|---|---|
| pm10 | 56 |
| pm25 | 56 |
| o3 | 0.03 |
| no2 | 0 |
| so2 | 0 |
新城区
| index | 2020-05 | 2020-04 | 2020-03 | 2020-02 | 2020-01 | 2019-12 | 2019-11 | 2019-10 | 2019-09 | 2019-08 | 2019-07 | 2019-06 | 2019-05 | 2019-04 | 2019-03 | 2019-02 | 2019-01 | 2018-12 | 2018-11 | 2018-10 |
|---|---|---|---|---|---|---|---|---|---|---|---|---|---|---|---|---|---|---|---|---|
| pm25 | 39 | 46 | 54 | 56 | 99 | 84 | 64 | 53 | 37 | 26 | 28 | 46 | 49 | 59 | 67 | 99 | 101 | 78 | 79 | 56 |
| co | 629 | 706 | 818 | 909 | 1 | 1 | 815 | 824 | 760 | 557 | 533 | 711 | 573 | 729 | 796 | 1 | 1 | 926 | 1 | 853 |
| no2 | 21 | 40 | 39 | 17 | 38 | 50 | 47 | 50 | 34 | 24 | 17 | 19 | 33 | 31 | 43 | 32 | 47 | 45 | 48 | 55 |
| o3 | 133 | 137 | 102 | 89 | 74 | 62 | 98 | 127 | 180 | 144 | 175 | 201 | 160 | 132 | 125 | 89 | 59 | 51 | 93 | 115 |
| pm10 | 70 | 83 | 89 | 72 | 132 | 113 | 122 | 121 | 84 | 57 | 64 | 88 | 96 | 96 | 123 | 137 | 156 | 135 | 135 | 121 |
| so2 | 7.3 | 10 | 8.9 | 6.5 | 10 | 10 | 12 | 10 | 10 | 7.2 | 3.3 | 3.8 | 5.6 | 5.2 | 7.6 | 7.4 | 9.2 | 13 | 14 | 18 |