Air Pollution in Chengguan Shisidui: Real-time Air Quality Index and smog alert.
Pollution and air quality forecast for Chengguan Shisidui. Today is Tuesday, June 2, 2026. The following air pollution values have been recorded for Chengguan Shisidui:- particulate matter (PM10) suspended dust - 179 (Very bad Hazardous)
- particulate matter (PM2.5) dust - 35 (Unhealthy for Sensitive Groups)
- ozone (O3) - 0 (Good)
- nitrogen dioxide (NO2) - 0 (Good)
- sulfur dioxide (SO2) - 0 (Good)

What is the air quality in Chengguan Shisidui today? Is the air polluted in Chengguan Shisidui?. Is there smog?
What is the level of PM10 today in Chengguan Shisidui? (particulate matter (PM10) suspended dust)
The current level of particulate matter PM10 in Chengguan Shisidui is:
179 (Very bad Hazardous)
The highest PM10 values usually occur in month: 95 (May 2019).
The lowest value of particulate matter PM10 pollution in Chengguan Shisidui is usually recorded in: August (39).
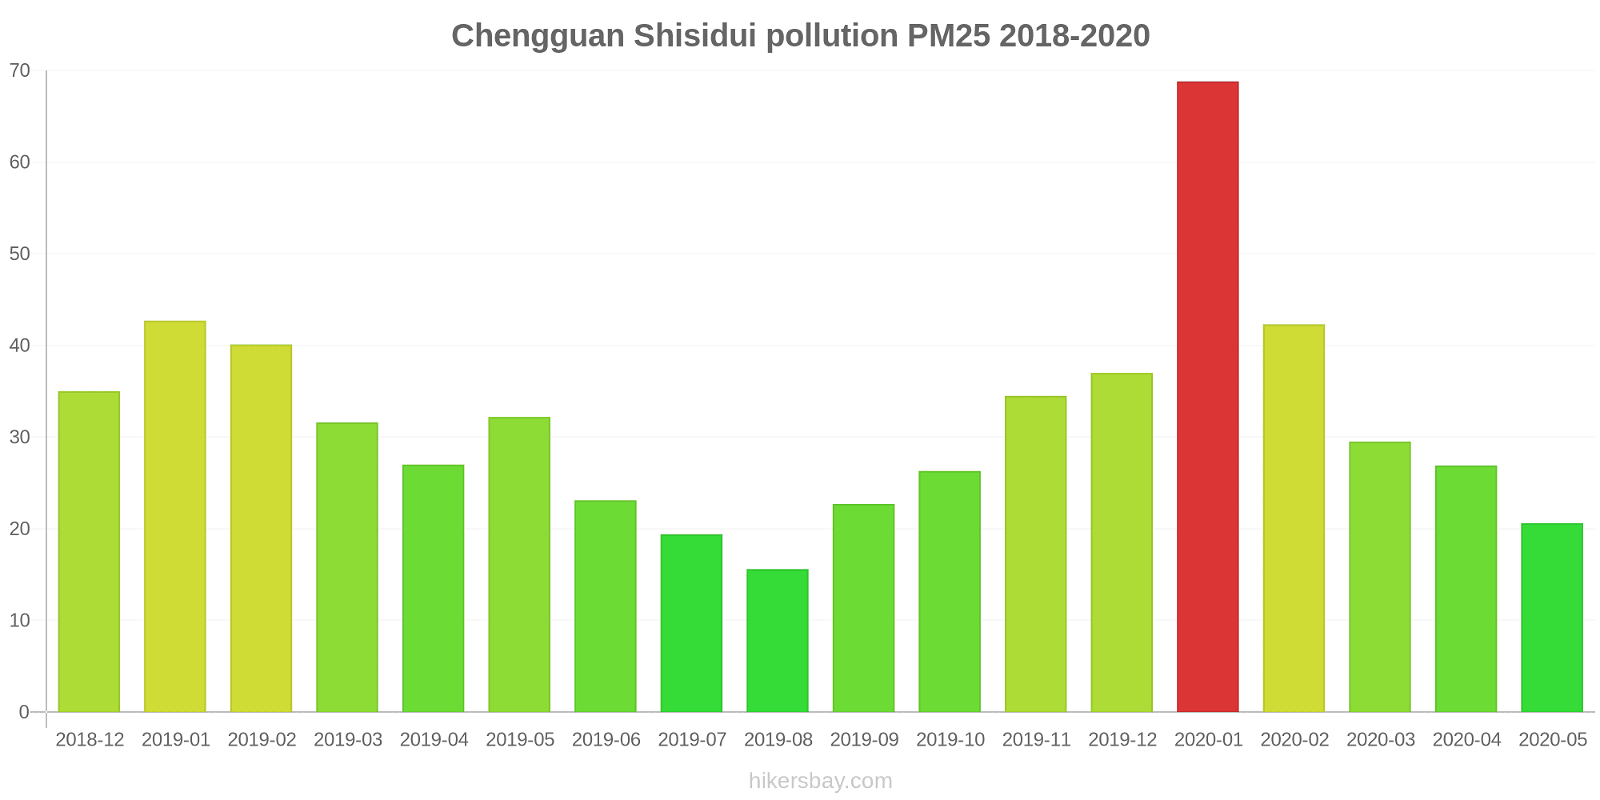
What is the current level of PM2.5 in Chengguan Shisidui? (particulate matter (PM2.5) dust)
Today's PM2.5 level is:
35 (Unhealthy for Sensitive Groups)
For comparison, the highest level of PM2.5 in Chengguan Shisidui in the last 7 days was: 56 (Friday, May 27, 2022) and the lowest: 56 (Friday, May 27, 2022).
The highest PM2.5 values were recorded: 69 (January 2020).
The lowest level of particulate matter PM2.5 pollution occurs in month: August (16).
How is the O3 level today in Chengguan Shisidui? (ozone (O3))
0 (Good)
How high is the level of NO2? (nitrogen dioxide (NO2))
0 (Good)
What is the level of SO2 pollution? (sulfur dioxide (SO2))
0 (Good)
Current data Friday, May 27, 2022, 12:00 PM
PM10 179 (Very bad Hazardous)
PM2,5 35 (Unhealthy for Sensitive Groups)
O3 0 (Good)
NO2 0 (Good)
SO2 0 (Good)
Data on air pollution from recent days in Chengguan Shisidui
index
2022-05-27
pm10
56
Unhealthy for Sensitive Groups
pm25
56
Unhealthy
o3
0
Good
no2
0
Good
so2
0
Good
data source »
Air pollution in Chengguan Shisidui from December 2018 to May 2020
index
2020-05
2020-04
2020-03
2020-02
2020-01
2019-12
2019-11
2019-10
2019-09
2019-08
2019-07
2019-06
2019-05
2019-04
2019-03
2019-02
2019-01
2018-12
pm25
21 (Moderate)
27 (Moderate)
30 (Moderate)
42 (Unhealthy for Sensitive Groups)
69 (Unhealthy)
37 (Unhealthy for Sensitive Groups)
35 (Moderate)
26 (Moderate)
23 (Moderate)
16 (Moderate)
19 (Moderate)
23 (Moderate)
32 (Moderate)
27 (Moderate)
32 (Moderate)
40 (Unhealthy for Sensitive Groups)
43 (Unhealthy for Sensitive Groups)
35 (Unhealthy for Sensitive Groups)
co
484 (Good)
479 (Good)
497 (Good)
676 (Good)
942 (Good)
762 (Good)
698 (Good)
587 (Good)
587 (Good)
449 (Good)
481 (Good)
450 (Good)
466 (Good)
524 (Good)
715 (Good)
801 (Good)
941 (Good)
765 (Good)
no2
30 (Good)
51 (Moderate)
41 (Moderate)
35 (Good)
47 (Moderate)
53 (Moderate)
46 (Moderate)
38 (Good)
36 (Good)
29 (Good)
30 (Good)
33 (Good)
36 (Good)
42 (Moderate)
51 (Moderate)
42 (Moderate)
52 (Moderate)
52 (Moderate)
o3
132 (Unhealthy for Sensitive Groups)
130 (Unhealthy for Sensitive Groups)
112 (Moderate)
103 (Moderate)
93 (Moderate)
76 (Moderate)
81 (Moderate)
103 (Moderate)
147 (Unhealthy for Sensitive Groups)
147 (Unhealthy for Sensitive Groups)
168 (Unhealthy)
165 (Unhealthy)
144 (Unhealthy for Sensitive Groups)
135 (Unhealthy for Sensitive Groups)
115 (Moderate)
99 (Moderate)
74 (Moderate)
62 (Good)
pm10
61 (Unhealthy for Sensitive Groups)
69 (Unhealthy for Sensitive Groups)
71 (Unhealthy for Sensitive Groups)
74 (Unhealthy for Sensitive Groups)
68 (Unhealthy for Sensitive Groups)
65 (Unhealthy for Sensitive Groups)
84 (Unhealthy)
70 (Unhealthy for Sensitive Groups)
51 (Unhealthy for Sensitive Groups)
39 (Moderate)
45 (Moderate)
52 (Unhealthy for Sensitive Groups)
95 (Unhealthy)
84 (Unhealthy)
82 (Unhealthy)
79 (Unhealthy for Sensitive Groups)
80 (Unhealthy for Sensitive Groups)
69 (Unhealthy for Sensitive Groups)
so2
7.8 (Good)
11 (Good)
12 (Good)
11 (Good)
19 (Good)
16 (Good)
12 (Good)
8.5 (Good)
7.1 (Good)
6.7 (Good)
6.3 (Good)
5.9 (Good)
6 (Good)
7.7 (Good)
13 (Good)
17 (Good)
27 (Good)
24 (Good)
data source »
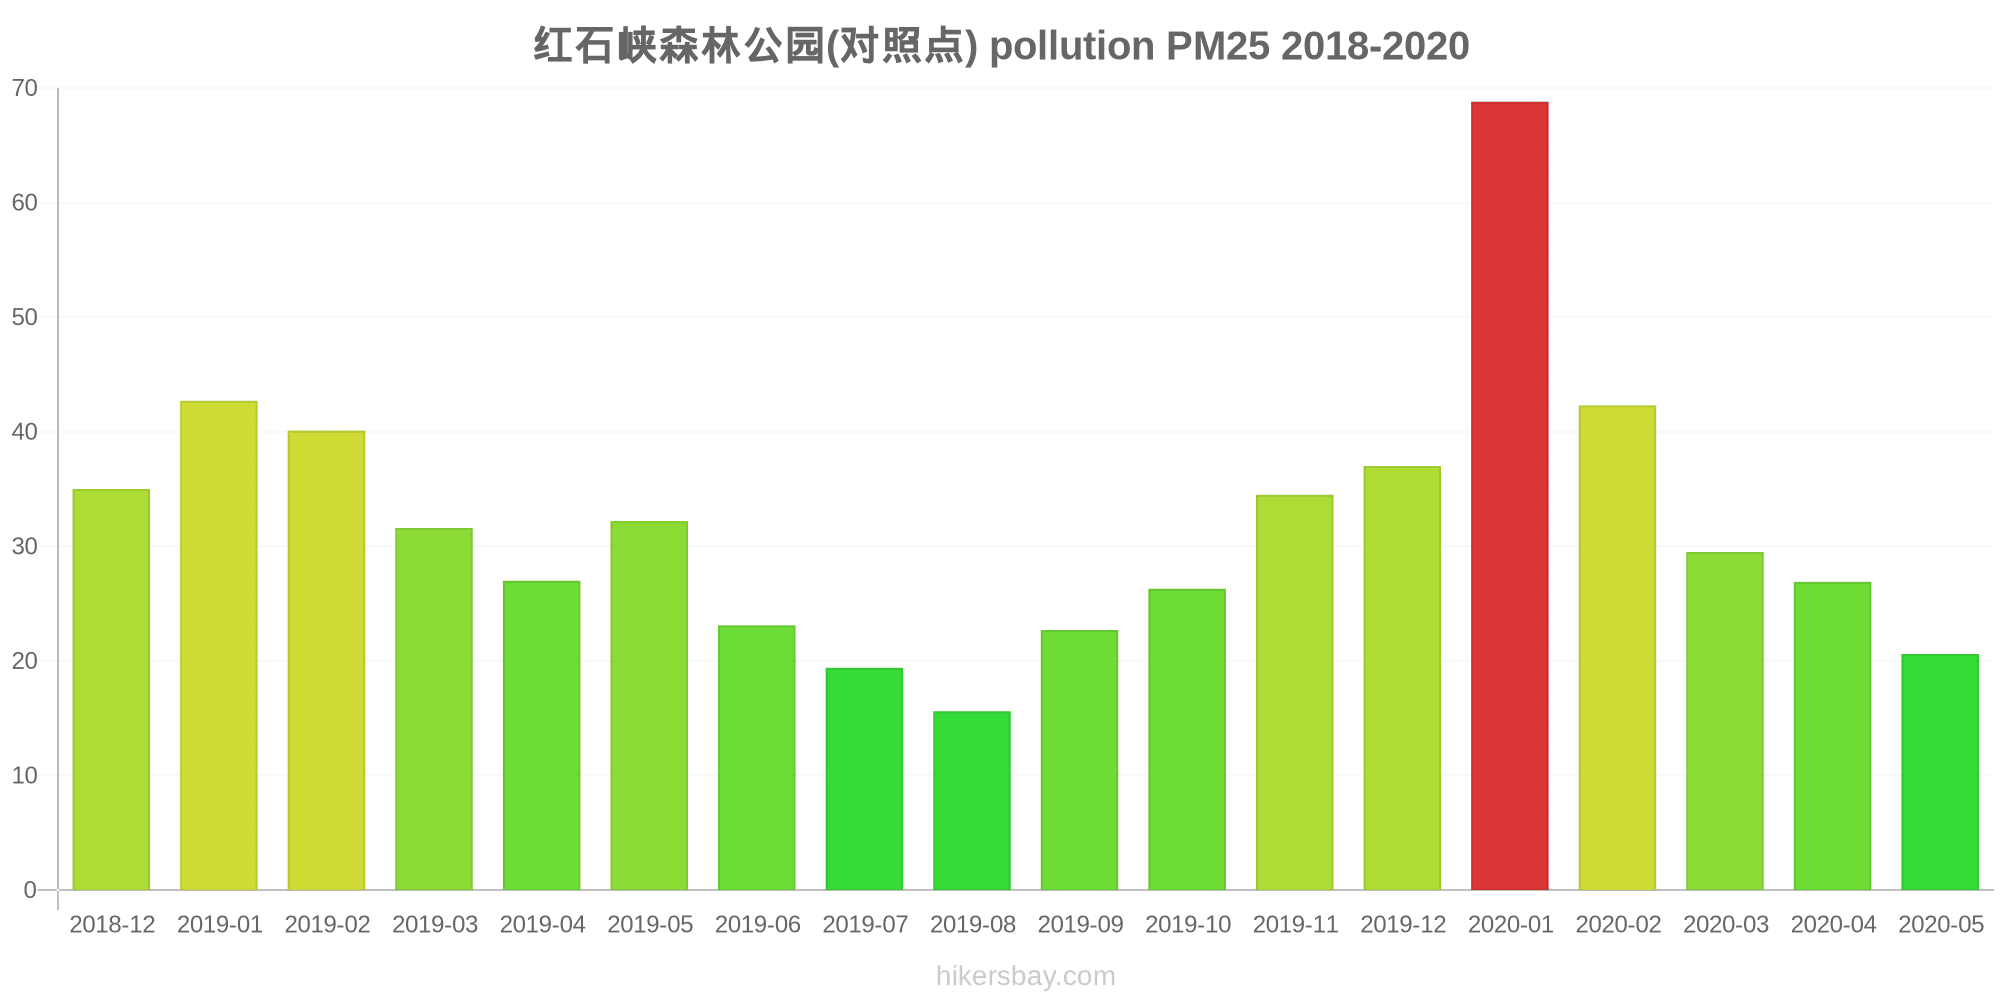
红石峡森林公园(对照点)
Friday, May 27, 2022, 12:00 PM
PM10 179 (Very bad Hazardous)
particulate matter (PM10) suspended dust
PM2,5 35 (Unhealthy for Sensitive Groups)
particulate matter (PM2.5) dust
O3 0.04 (Good)
ozone (O3)
NO2 0 (Good)
nitrogen dioxide (NO2)
SO2 0 (Good)
sulfur dioxide (SO2)
红石峡森林公园(对照点)
index
2022-05-27
pm10
56
pm25
56
o3
0.03
no2
0
so2
0
红石峡森林公园(对照点)
2018-12 2020-05

index
2020-05
2020-04
2020-03
2020-02
2020-01
2019-12
2019-11
2019-10
2019-09
2019-08
2019-07
2019-06
2019-05
2019-04
2019-03
2019-02
2019-01
2018-12
pm25
21
27
30
42
69
37
35
26
23
16
19
23
32
27
32
40
43
35
co
484
479
497
676
942
762
698
587
587
449
481
450
466
524
715
801
941
765
no2
30
51
41
35
47
53
46
38
36
29
30
33
36
42
51
42
52
52
o3
132
130
112
103
93
76
81
103
147
147
168
165
144
135
115
99
74
62
pm10
61
69
71
74
68
65
84
70
51
39
45
52
95
84
82
79
80
69
so2
7.8
11
12
11
19
16
12
8.5
7.1
6.7
6.3
5.9
6
7.7
13
17
27
24
* Pollution data source:
https://openaq.org
(ChinaAQIData)
The data is licensed under CC-By 4.0
PM10 179 (Very bad Hazardous)
PM2,5 35 (Unhealthy for Sensitive Groups)
O3 0 (Good)
NO2 0 (Good)
SO2 0 (Good)
Data on air pollution from recent days in Chengguan Shisidui
| index | 2022-05-27 |
|---|---|
| pm10 | 56 Unhealthy for Sensitive Groups |
| pm25 | 56 Unhealthy |
| o3 | 0 Good |
| no2 | 0 Good |
| so2 | 0 Good |

| index | 2020-05 | 2020-04 | 2020-03 | 2020-02 | 2020-01 | 2019-12 | 2019-11 | 2019-10 | 2019-09 | 2019-08 | 2019-07 | 2019-06 | 2019-05 | 2019-04 | 2019-03 | 2019-02 | 2019-01 | 2018-12 |
|---|---|---|---|---|---|---|---|---|---|---|---|---|---|---|---|---|---|---|
| pm25 | 21 (Moderate) | 27 (Moderate) | 30 (Moderate) | 42 (Unhealthy for Sensitive Groups) | 69 (Unhealthy) | 37 (Unhealthy for Sensitive Groups) | 35 (Moderate) | 26 (Moderate) | 23 (Moderate) | 16 (Moderate) | 19 (Moderate) | 23 (Moderate) | 32 (Moderate) | 27 (Moderate) | 32 (Moderate) | 40 (Unhealthy for Sensitive Groups) | 43 (Unhealthy for Sensitive Groups) | 35 (Unhealthy for Sensitive Groups) |
| co | 484 (Good) | 479 (Good) | 497 (Good) | 676 (Good) | 942 (Good) | 762 (Good) | 698 (Good) | 587 (Good) | 587 (Good) | 449 (Good) | 481 (Good) | 450 (Good) | 466 (Good) | 524 (Good) | 715 (Good) | 801 (Good) | 941 (Good) | 765 (Good) |
| no2 | 30 (Good) | 51 (Moderate) | 41 (Moderate) | 35 (Good) | 47 (Moderate) | 53 (Moderate) | 46 (Moderate) | 38 (Good) | 36 (Good) | 29 (Good) | 30 (Good) | 33 (Good) | 36 (Good) | 42 (Moderate) | 51 (Moderate) | 42 (Moderate) | 52 (Moderate) | 52 (Moderate) |
| o3 | 132 (Unhealthy for Sensitive Groups) | 130 (Unhealthy for Sensitive Groups) | 112 (Moderate) | 103 (Moderate) | 93 (Moderate) | 76 (Moderate) | 81 (Moderate) | 103 (Moderate) | 147 (Unhealthy for Sensitive Groups) | 147 (Unhealthy for Sensitive Groups) | 168 (Unhealthy) | 165 (Unhealthy) | 144 (Unhealthy for Sensitive Groups) | 135 (Unhealthy for Sensitive Groups) | 115 (Moderate) | 99 (Moderate) | 74 (Moderate) | 62 (Good) |
| pm10 | 61 (Unhealthy for Sensitive Groups) | 69 (Unhealthy for Sensitive Groups) | 71 (Unhealthy for Sensitive Groups) | 74 (Unhealthy for Sensitive Groups) | 68 (Unhealthy for Sensitive Groups) | 65 (Unhealthy for Sensitive Groups) | 84 (Unhealthy) | 70 (Unhealthy for Sensitive Groups) | 51 (Unhealthy for Sensitive Groups) | 39 (Moderate) | 45 (Moderate) | 52 (Unhealthy for Sensitive Groups) | 95 (Unhealthy) | 84 (Unhealthy) | 82 (Unhealthy) | 79 (Unhealthy for Sensitive Groups) | 80 (Unhealthy for Sensitive Groups) | 69 (Unhealthy for Sensitive Groups) |
| so2 | 7.8 (Good) | 11 (Good) | 12 (Good) | 11 (Good) | 19 (Good) | 16 (Good) | 12 (Good) | 8.5 (Good) | 7.1 (Good) | 6.7 (Good) | 6.3 (Good) | 5.9 (Good) | 6 (Good) | 7.7 (Good) | 13 (Good) | 17 (Good) | 27 (Good) | 24 (Good) |
PM10 179 (Very bad Hazardous)
particulate matter (PM10) suspended dustPM2,5 35 (Unhealthy for Sensitive Groups)
particulate matter (PM2.5) dustO3 0.04 (Good)
ozone (O3)NO2 0 (Good)
nitrogen dioxide (NO2)SO2 0 (Good)
sulfur dioxide (SO2)红石峡森林公园(对照点)
| index | 2022-05-27 |
|---|---|
| pm10 | 56 |
| pm25 | 56 |
| o3 | 0.03 |
| no2 | 0 |
| so2 | 0 |
红石峡森林公园(对照点)
| index | 2020-05 | 2020-04 | 2020-03 | 2020-02 | 2020-01 | 2019-12 | 2019-11 | 2019-10 | 2019-09 | 2019-08 | 2019-07 | 2019-06 | 2019-05 | 2019-04 | 2019-03 | 2019-02 | 2019-01 | 2018-12 |
|---|---|---|---|---|---|---|---|---|---|---|---|---|---|---|---|---|---|---|
| pm25 | 21 | 27 | 30 | 42 | 69 | 37 | 35 | 26 | 23 | 16 | 19 | 23 | 32 | 27 | 32 | 40 | 43 | 35 |
| co | 484 | 479 | 497 | 676 | 942 | 762 | 698 | 587 | 587 | 449 | 481 | 450 | 466 | 524 | 715 | 801 | 941 | 765 |
| no2 | 30 | 51 | 41 | 35 | 47 | 53 | 46 | 38 | 36 | 29 | 30 | 33 | 36 | 42 | 51 | 42 | 52 | 52 |
| o3 | 132 | 130 | 112 | 103 | 93 | 76 | 81 | 103 | 147 | 147 | 168 | 165 | 144 | 135 | 115 | 99 | 74 | 62 |
| pm10 | 61 | 69 | 71 | 74 | 68 | 65 | 84 | 70 | 51 | 39 | 45 | 52 | 95 | 84 | 82 | 79 | 80 | 69 |
| so2 | 7.8 | 11 | 12 | 11 | 19 | 16 | 12 | 8.5 | 7.1 | 6.7 | 6.3 | 5.9 | 6 | 7.7 | 13 | 17 | 27 | 24 |