Air Pollution in Zhangjiawan: Real-time Air Quality Index and smog alert.
Pollution and air quality forecast for Zhangjiawan. Today is Tuesday, June 2, 2026. The following air pollution values have been recorded for Zhangjiawan:- particulate matter (PM10) suspended dust - 179 (Very bad Hazardous)
- particulate matter (PM2.5) dust - 35 (Unhealthy for Sensitive Groups)
- ozone (O3) - 0 (Good)
- nitrogen dioxide (NO2) - 0 (Good)
- sulfur dioxide (SO2) - 0 (Good)

What is the air quality in Zhangjiawan today? Is the air polluted in Zhangjiawan?. Is there smog?
What is the level of PM10 today in Zhangjiawan? (particulate matter (PM10) suspended dust)
The current level of particulate matter PM10 in Zhangjiawan is:
179 (Very bad Hazardous)
The highest PM10 values usually occur in month: 102 (May 2019).
The lowest value of particulate matter PM10 pollution in Zhangjiawan is usually recorded in: August (41).
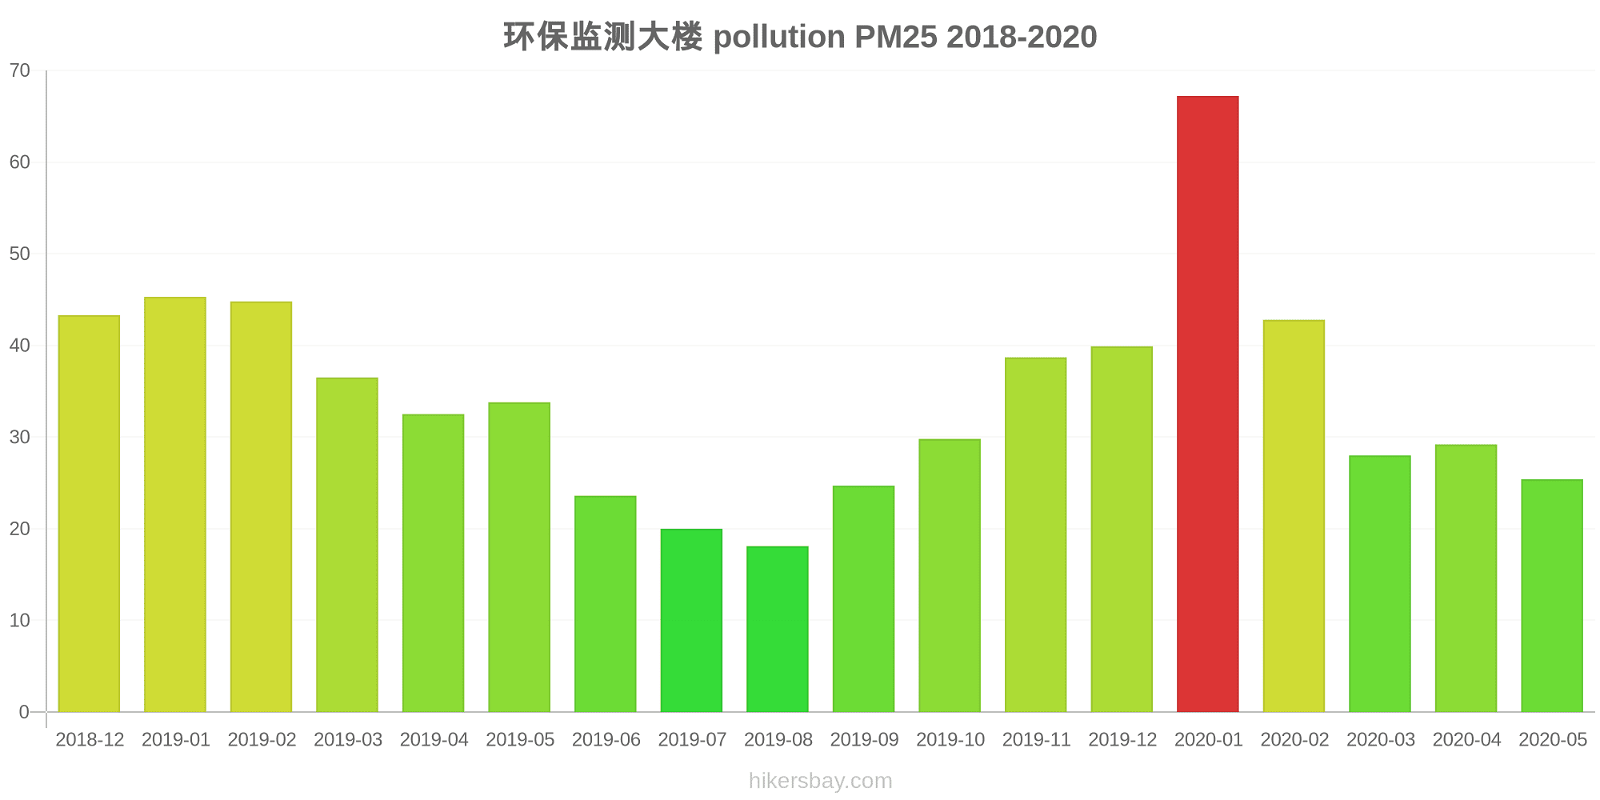
What is the current level of PM2.5 in Zhangjiawan? (particulate matter (PM2.5) dust)
Today's PM2.5 level is:
35 (Unhealthy for Sensitive Groups)
For comparison, the highest level of PM2.5 in Zhangjiawan in the last 7 days was: 56 (Friday, May 27, 2022) and the lowest: 56 (Friday, May 27, 2022).
The highest PM2.5 values were recorded: 67 (January 2020).
The lowest level of particulate matter PM2.5 pollution occurs in month: August (18).
How is the O3 level today in Zhangjiawan? (ozone (O3))
0 (Good)
How high is the level of NO2? (nitrogen dioxide (NO2))
0 (Good)
What is the level of SO2 pollution? (sulfur dioxide (SO2))
0 (Good)
Current data Friday, May 27, 2022, 12:00 PM
PM10 179 (Very bad Hazardous)
PM2,5 35 (Unhealthy for Sensitive Groups)
O3 0 (Good)
NO2 0 (Good)
SO2 0 (Good)
Data on air pollution from recent days in Zhangjiawan
index
2022-05-27
pm10
56
Unhealthy for Sensitive Groups
pm25
56
Unhealthy
o3
0
Good
no2
0
Good
so2
0
Good
data source »
Air pollution in Zhangjiawan from December 2018 to May 2020

index
2020-05
2020-04
2020-03
2020-02
2020-01
2019-12
2019-11
2019-10
2019-09
2019-08
2019-07
2019-06
2019-05
2019-04
2019-03
2019-02
2019-01
2018-12
pm25
25 (Moderate)
29 (Moderate)
28 (Moderate)
43 (Unhealthy for Sensitive Groups)
67 (Unhealthy)
40 (Unhealthy for Sensitive Groups)
39 (Unhealthy for Sensitive Groups)
30 (Moderate)
25 (Moderate)
18 (Moderate)
20 (Moderate)
24 (Moderate)
34 (Moderate)
33 (Moderate)
37 (Unhealthy for Sensitive Groups)
45 (Unhealthy for Sensitive Groups)
45 (Unhealthy for Sensitive Groups)
43 (Unhealthy for Sensitive Groups)
co
546 (Good)
547 (Good)
496 (Good)
752 (Good)
1 (Good)
992 (Good)
861 (Good)
673 (Good)
733 (Good)
607 (Good)
587 (Good)
507 (Good)
529 (Good)
558 (Good)
749 (Good)
930 (Good)
1 (Good)
1 (Good)
no2
27 (Good)
45 (Moderate)
32 (Good)
31 (Good)
48 (Moderate)
50 (Moderate)
45 (Moderate)
37 (Good)
36 (Good)
29 (Good)
29 (Good)
26 (Good)
30 (Good)
40 (Good)
48 (Moderate)
42 (Moderate)
54 (Moderate)
61 (Moderate)
o3
134 (Unhealthy for Sensitive Groups)
130 (Unhealthy for Sensitive Groups)
113 (Moderate)
97 (Moderate)
87 (Moderate)
73 (Moderate)
78 (Moderate)
101 (Moderate)
145 (Unhealthy for Sensitive Groups)
147 (Unhealthy for Sensitive Groups)
172 (Unhealthy)
168 (Unhealthy)
143 (Unhealthy for Sensitive Groups)
137 (Unhealthy for Sensitive Groups)
113 (Moderate)
99 (Moderate)
63 (Good)
57 (Good)
pm10
77 (Unhealthy for Sensitive Groups)
78 (Unhealthy for Sensitive Groups)
75 (Unhealthy for Sensitive Groups)
76 (Unhealthy for Sensitive Groups)
79 (Unhealthy for Sensitive Groups)
68 (Unhealthy for Sensitive Groups)
88 (Unhealthy)
71 (Unhealthy for Sensitive Groups)
52 (Unhealthy for Sensitive Groups)
41 (Moderate)
44 (Moderate)
51 (Unhealthy for Sensitive Groups)
102 (Unhealthy)
88 (Unhealthy)
85 (Unhealthy)
86 (Unhealthy)
83 (Unhealthy)
77 (Unhealthy for Sensitive Groups)
so2
8.2 (Good)
11 (Good)
10 (Good)
9.6 (Good)
19 (Good)
16 (Good)
11 (Good)
12 (Good)
9.9 (Good)
10 (Good)
8.2 (Good)
7.9 (Good)
7.8 (Good)
9.6 (Good)
14 (Good)
19 (Good)
30 (Good)
33 (Good)
data source »
环保监测大楼
Friday, May 27, 2022, 12:00 PM
PM10 179 (Very bad Hazardous)
particulate matter (PM10) suspended dust
PM2,5 35 (Unhealthy for Sensitive Groups)
particulate matter (PM2.5) dust
O3 0.04 (Good)
ozone (O3)
NO2 0 (Good)
nitrogen dioxide (NO2)
SO2 0 (Good)
sulfur dioxide (SO2)
环保监测大楼
index
2022-05-27
pm10
56
pm25
56
o3
0.03
no2
0
so2
0
环保监测大楼
2018-12 2020-05
index
2020-05
2020-04
2020-03
2020-02
2020-01
2019-12
2019-11
2019-10
2019-09
2019-08
2019-07
2019-06
2019-05
2019-04
2019-03
2019-02
2019-01
2018-12
pm25
25
29
28
43
67
40
39
30
25
18
20
24
34
33
37
45
45
43
co
546
547
496
752
1
992
861
673
733
607
587
507
529
558
749
930
1
1
no2
27
45
32
31
48
50
45
37
36
29
29
26
30
40
48
42
54
61
o3
134
130
113
97
87
73
78
101
145
147
172
168
143
137
113
99
63
57
pm10
77
78
75
76
79
68
88
71
52
41
44
51
102
88
85
86
83
77
so2
8.2
11
10
9.6
19
16
11
12
9.9
10
8.2
7.9
7.8
9.6
14
19
30
33
* Pollution data source:
https://openaq.org
(ChinaAQIData)
The data is licensed under CC-By 4.0
PM10 179 (Very bad Hazardous)
PM2,5 35 (Unhealthy for Sensitive Groups)
O3 0 (Good)
NO2 0 (Good)
SO2 0 (Good)
Data on air pollution from recent days in Zhangjiawan
| index | 2022-05-27 |
|---|---|
| pm10 | 56 Unhealthy for Sensitive Groups |
| pm25 | 56 Unhealthy |
| o3 | 0 Good |
| no2 | 0 Good |
| so2 | 0 Good |

| index | 2020-05 | 2020-04 | 2020-03 | 2020-02 | 2020-01 | 2019-12 | 2019-11 | 2019-10 | 2019-09 | 2019-08 | 2019-07 | 2019-06 | 2019-05 | 2019-04 | 2019-03 | 2019-02 | 2019-01 | 2018-12 |
|---|---|---|---|---|---|---|---|---|---|---|---|---|---|---|---|---|---|---|
| pm25 | 25 (Moderate) | 29 (Moderate) | 28 (Moderate) | 43 (Unhealthy for Sensitive Groups) | 67 (Unhealthy) | 40 (Unhealthy for Sensitive Groups) | 39 (Unhealthy for Sensitive Groups) | 30 (Moderate) | 25 (Moderate) | 18 (Moderate) | 20 (Moderate) | 24 (Moderate) | 34 (Moderate) | 33 (Moderate) | 37 (Unhealthy for Sensitive Groups) | 45 (Unhealthy for Sensitive Groups) | 45 (Unhealthy for Sensitive Groups) | 43 (Unhealthy for Sensitive Groups) |
| co | 546 (Good) | 547 (Good) | 496 (Good) | 752 (Good) | 1 (Good) | 992 (Good) | 861 (Good) | 673 (Good) | 733 (Good) | 607 (Good) | 587 (Good) | 507 (Good) | 529 (Good) | 558 (Good) | 749 (Good) | 930 (Good) | 1 (Good) | 1 (Good) |
| no2 | 27 (Good) | 45 (Moderate) | 32 (Good) | 31 (Good) | 48 (Moderate) | 50 (Moderate) | 45 (Moderate) | 37 (Good) | 36 (Good) | 29 (Good) | 29 (Good) | 26 (Good) | 30 (Good) | 40 (Good) | 48 (Moderate) | 42 (Moderate) | 54 (Moderate) | 61 (Moderate) |
| o3 | 134 (Unhealthy for Sensitive Groups) | 130 (Unhealthy for Sensitive Groups) | 113 (Moderate) | 97 (Moderate) | 87 (Moderate) | 73 (Moderate) | 78 (Moderate) | 101 (Moderate) | 145 (Unhealthy for Sensitive Groups) | 147 (Unhealthy for Sensitive Groups) | 172 (Unhealthy) | 168 (Unhealthy) | 143 (Unhealthy for Sensitive Groups) | 137 (Unhealthy for Sensitive Groups) | 113 (Moderate) | 99 (Moderate) | 63 (Good) | 57 (Good) |
| pm10 | 77 (Unhealthy for Sensitive Groups) | 78 (Unhealthy for Sensitive Groups) | 75 (Unhealthy for Sensitive Groups) | 76 (Unhealthy for Sensitive Groups) | 79 (Unhealthy for Sensitive Groups) | 68 (Unhealthy for Sensitive Groups) | 88 (Unhealthy) | 71 (Unhealthy for Sensitive Groups) | 52 (Unhealthy for Sensitive Groups) | 41 (Moderate) | 44 (Moderate) | 51 (Unhealthy for Sensitive Groups) | 102 (Unhealthy) | 88 (Unhealthy) | 85 (Unhealthy) | 86 (Unhealthy) | 83 (Unhealthy) | 77 (Unhealthy for Sensitive Groups) |
| so2 | 8.2 (Good) | 11 (Good) | 10 (Good) | 9.6 (Good) | 19 (Good) | 16 (Good) | 11 (Good) | 12 (Good) | 9.9 (Good) | 10 (Good) | 8.2 (Good) | 7.9 (Good) | 7.8 (Good) | 9.6 (Good) | 14 (Good) | 19 (Good) | 30 (Good) | 33 (Good) |
PM10 179 (Very bad Hazardous)
particulate matter (PM10) suspended dustPM2,5 35 (Unhealthy for Sensitive Groups)
particulate matter (PM2.5) dustO3 0.04 (Good)
ozone (O3)NO2 0 (Good)
nitrogen dioxide (NO2)SO2 0 (Good)
sulfur dioxide (SO2)环保监测大楼
| index | 2022-05-27 |
|---|---|
| pm10 | 56 |
| pm25 | 56 |
| o3 | 0.03 |
| no2 | 0 |
| so2 | 0 |
环保监测大楼

| index | 2020-05 | 2020-04 | 2020-03 | 2020-02 | 2020-01 | 2019-12 | 2019-11 | 2019-10 | 2019-09 | 2019-08 | 2019-07 | 2019-06 | 2019-05 | 2019-04 | 2019-03 | 2019-02 | 2019-01 | 2018-12 |
|---|---|---|---|---|---|---|---|---|---|---|---|---|---|---|---|---|---|---|
| pm25 | 25 | 29 | 28 | 43 | 67 | 40 | 39 | 30 | 25 | 18 | 20 | 24 | 34 | 33 | 37 | 45 | 45 | 43 |
| co | 546 | 547 | 496 | 752 | 1 | 992 | 861 | 673 | 733 | 607 | 587 | 507 | 529 | 558 | 749 | 930 | 1 | 1 |
| no2 | 27 | 45 | 32 | 31 | 48 | 50 | 45 | 37 | 36 | 29 | 29 | 26 | 30 | 40 | 48 | 42 | 54 | 61 |
| o3 | 134 | 130 | 113 | 97 | 87 | 73 | 78 | 101 | 145 | 147 | 172 | 168 | 143 | 137 | 113 | 99 | 63 | 57 |
| pm10 | 77 | 78 | 75 | 76 | 79 | 68 | 88 | 71 | 52 | 41 | 44 | 51 | 102 | 88 | 85 | 86 | 83 | 77 |
| so2 | 8.2 | 11 | 10 | 9.6 | 19 | 16 | 11 | 12 | 9.9 | 10 | 8.2 | 7.9 | 7.8 | 9.6 | 14 | 19 | 30 | 33 |