Air Pollution in Pingshancun: Real-time Air Quality Index and smog alert.
Pollution and air quality forecast for Pingshancun. Today is Tuesday, June 16, 2026. The following air pollution values have been recorded for Pingshancun:- particulate matter (PM10) suspended dust - 7 (Good)
- particulate matter (PM2.5) dust - 2 (Good)
- carbon monoxide (CO) - 100 (Good)
- nitrogen dioxide (NO2) - 8 (Good)
- ozone (O3) - 0 (Good)
- sulfur dioxide (SO2) - 9 (Good)

What is the air quality in Pingshancun today? Is the air polluted in Pingshancun?. Is there smog?
What is the level of PM10 today in Pingshancun? (particulate matter (PM10) suspended dust)
The current level of particulate matter PM10 in Pingshancun is:
7 (Good)
The highest PM10 values usually occur in month: 95 (December 2019).
The lowest value of particulate matter PM10 pollution in Pingshancun is usually recorded in: June (25).
What is the current level of PM2.5 in Pingshancun? (particulate matter (PM2.5) dust)
Today's PM2.5 level is:
2 (Good)
For comparison, the highest level of PM2.5 in Pingshancun in the last 7 days was: 24 (Friday, May 27, 2022) and the lowest: 24 (Friday, May 27, 2022).
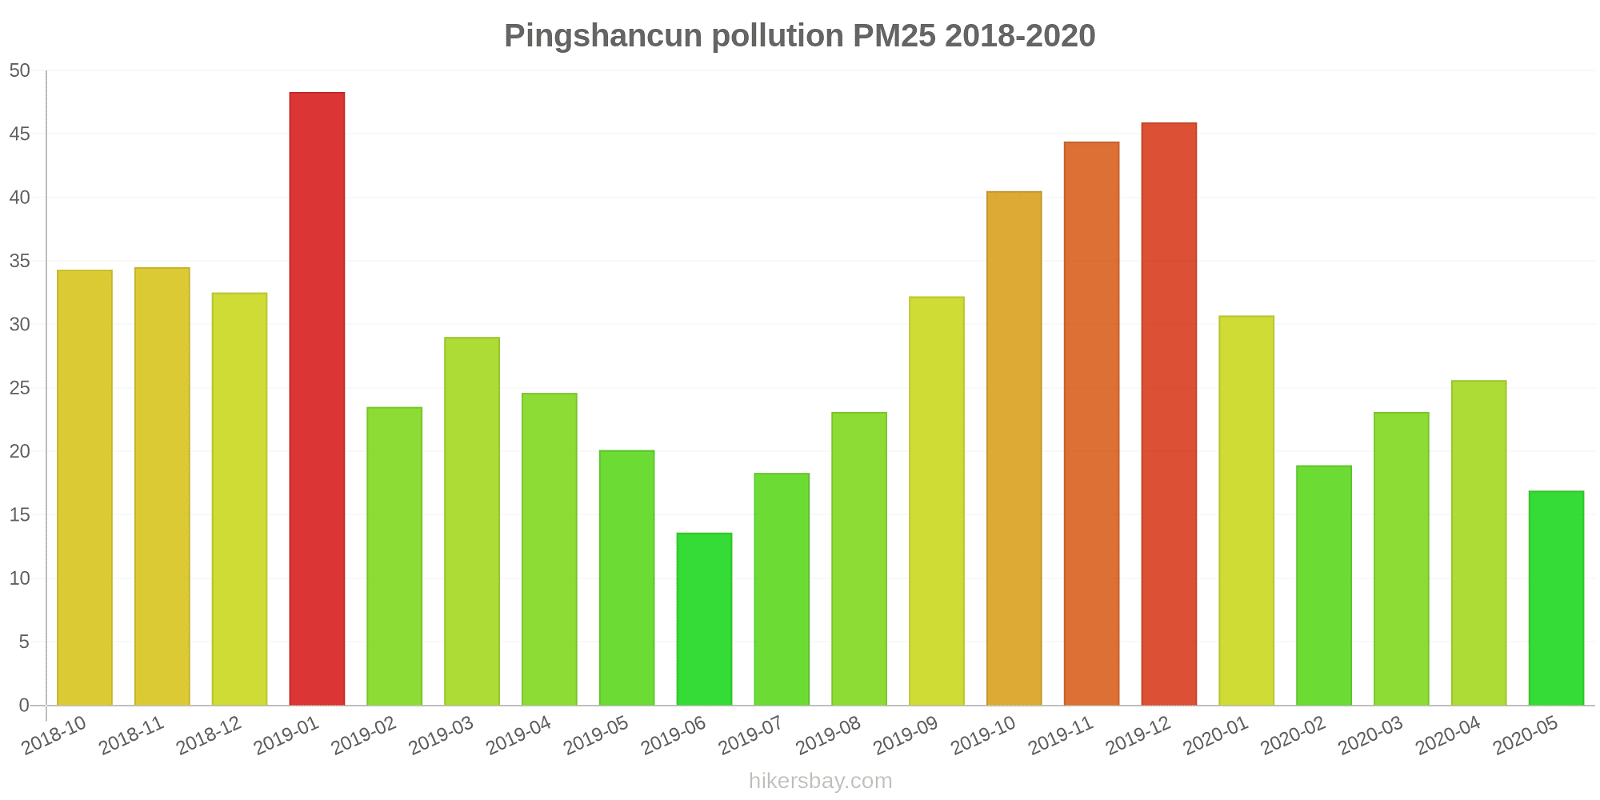
The highest PM2.5 values were recorded: 48 (January 2019).
The lowest level of particulate matter PM2.5 pollution occurs in month: June (14).
How high is the CO level? (carbon monoxide (CO))
100 (Good)
How high is the level of NO2? (nitrogen dioxide (NO2))
8 (Good)
How is the O3 level today in Pingshancun? (ozone (O3))
0 (Good)
What is the level of SO2 pollution? (sulfur dioxide (SO2))
9 (Good)
Current data Friday, May 27, 2022, 12:00 PM
PM10 7 (Good)
PM2,5 2 (Good)
CO 100 (Good)
NO2 8 (Good)
O3 0 (Good)
SO2 9 (Good)
Data on air pollution from recent days in Pingshancun
index
2022-05-27
pm10
32
Moderate
pm25
24
Moderate
co
468
Good
no2
21
Good
o3
32
Good
so2
5
Good
data source »
Air pollution in Pingshancun from October 2018 to May 2020
index
2020-05
2020-04
2020-03
2020-02
2020-01
2019-12
2019-11
2019-10
2019-09
2019-08
2019-07
2019-06
2019-05
2019-04
2019-03
2019-02
2019-01
2018-12
2018-11
2018-10
pm25
17 (Moderate)
26 (Moderate)
23 (Moderate)
19 (Moderate)
31 (Moderate)
46 (Unhealthy for Sensitive Groups)
44 (Unhealthy for Sensitive Groups)
41 (Unhealthy for Sensitive Groups)
32 (Moderate)
23 (Moderate)
18 (Moderate)
14 (Moderate)
20 (Moderate)
25 (Moderate)
29 (Moderate)
24 (Moderate)
48 (Unhealthy for Sensitive Groups)
33 (Moderate)
35 (Moderate)
34 (Moderate)
co
488 (Good)
607 (Good)
714 (Good)
640 (Good)
742 (Good)
629 (Good)
681 (Good)
789 (Good)
663 (Good)
590 (Good)
583 (Good)
540 (Good)
617 (Good)
670 (Good)
710 (Good)
703 (Good)
945 (Good)
739 (Good)
765 (Good)
647 (Good)
no2
20 (Good)
33 (Good)
29 (Good)
19 (Good)
17 (Good)
36 (Good)
34 (Good)
22 (Good)
21 (Good)
22 (Good)
27 (Good)
20 (Good)
14 (Good)
21 (Good)
23 (Good)
12 (Good)
28 (Good)
38 (Good)
41 (Moderate)
37 (Good)
o3
98 (Moderate)
118 (Moderate)
82 (Moderate)
94 (Moderate)
98 (Moderate)
128 (Unhealthy for Sensitive Groups)
186 (Very Unhealthy)
185 (Very Unhealthy)
181 (Very Unhealthy)
154 (Unhealthy)
93 (Moderate)
87 (Moderate)
109 (Moderate)
103 (Moderate)
61 (Good)
64 (Good)
91 (Moderate)
78 (Moderate)
111 (Moderate)
131 (Unhealthy for Sensitive Groups)
pm10
33 (Moderate)
52 (Unhealthy for Sensitive Groups)
42 (Moderate)
30 (Moderate)
54 (Unhealthy for Sensitive Groups)
95 (Unhealthy)
93 (Unhealthy)
69 (Unhealthy for Sensitive Groups)
57 (Unhealthy for Sensitive Groups)
39 (Moderate)
34 (Moderate)
25 (Moderate)
37 (Moderate)
44 (Moderate)
50 (Unhealthy for Sensitive Groups)
37 (Moderate)
84 (Unhealthy)
63 (Unhealthy for Sensitive Groups)
75 (Unhealthy for Sensitive Groups)
69 (Unhealthy for Sensitive Groups)
so2
4.2 (Good)
4.5 (Good)
4.3 (Good)
4.5 (Good)
4.9 (Good)
7.2 (Good)
9.6 (Good)
9.1 (Good)
9.2 (Good)
6.5 (Good)
5.5 (Good)
6.2 (Good)
4.3 (Good)
4.3 (Good)
3.9 (Good)
3.2 (Good)
5.5 (Good)
7.3 (Good)
8 (Good)
10 (Good)
data source »
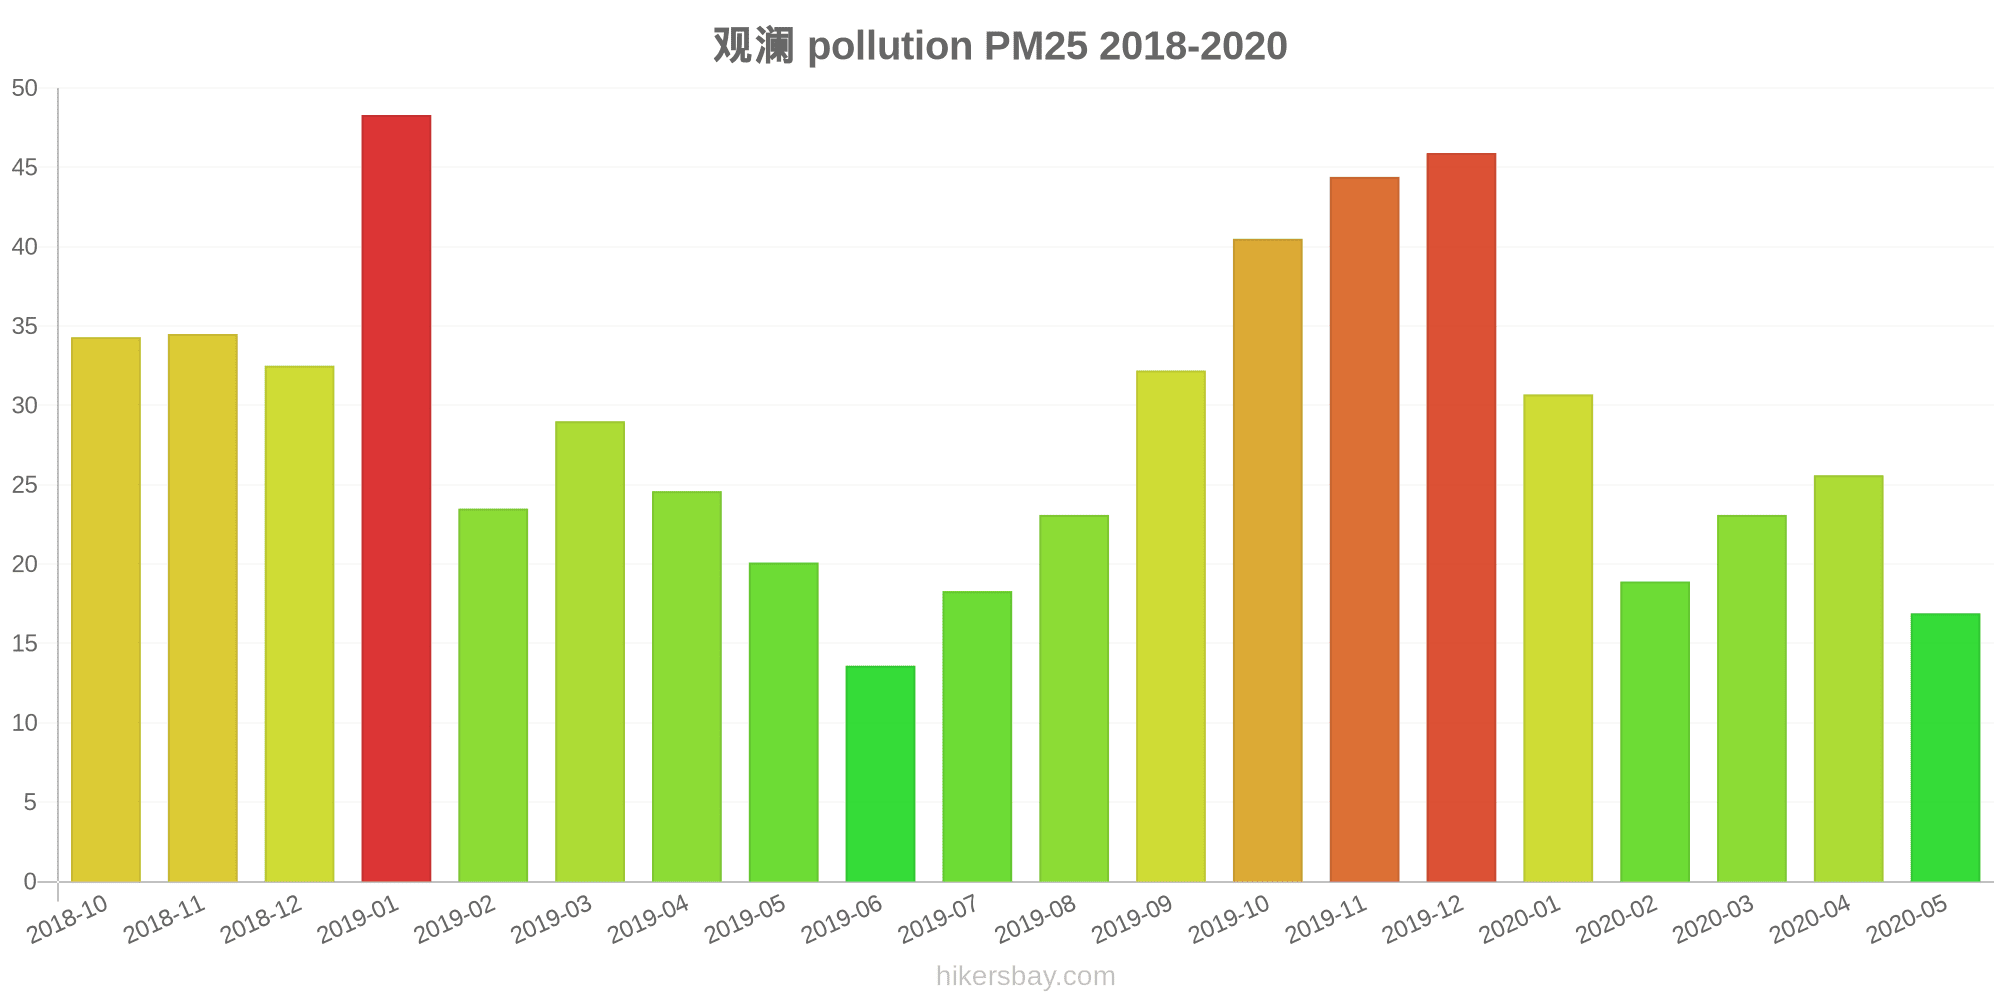
观澜
Friday, May 27, 2022, 12:00 PM
PM10 6.7 (Good)
particulate matter (PM10) suspended dust
PM2,5 1.7 (Good)
particulate matter (PM2.5) dust
CO 100 (Good)
carbon monoxide (CO)
NO2 7.6 (Good)
nitrogen dioxide (NO2)
O3 0.02 (Good)
ozone (O3)
SO2 8.6 (Good)
sulfur dioxide (SO2)
观澜
index
2022-05-27
pm10
32
pm25
24
co
468
no2
21
o3
32
so2
4.6
观澜
2018-10 2020-05

index
2020-05
2020-04
2020-03
2020-02
2020-01
2019-12
2019-11
2019-10
2019-09
2019-08
2019-07
2019-06
2019-05
2019-04
2019-03
2019-02
2019-01
2018-12
2018-11
2018-10
o3
98
118
82
94
98
128
186
185
181
154
93
87
109
103
61
64
91
78
111
131
pm25
17
26
23
19
31
46
44
41
32
23
18
14
20
25
29
24
48
33
35
34
co
488
607
714
640
742
629
681
789
663
590
583
540
617
670
710
703
945
739
765
647
no2
20
33
29
19
17
36
34
22
21
22
27
20
14
21
23
12
28
38
41
37
pm10
33
52
42
30
54
95
93
69
57
39
34
25
37
44
50
37
84
63
75
69
so2
4.2
4.5
4.3
4.5
4.9
7.2
9.6
9.1
9.2
6.5
5.5
6.2
4.3
4.3
3.9
3.2
5.5
7.3
8
10
* Pollution data source:
https://openaq.org
(ChinaAQIData)
The data is licensed under CC-By 4.0
PM10 7 (Good)
PM2,5 2 (Good)
CO 100 (Good)
NO2 8 (Good)
O3 0 (Good)
SO2 9 (Good)
Data on air pollution from recent days in Pingshancun
| index | 2022-05-27 |
|---|---|
| pm10 | 32 Moderate |
| pm25 | 24 Moderate |
| co | 468 Good |
| no2 | 21 Good |
| o3 | 32 Good |
| so2 | 5 Good |

| index | 2020-05 | 2020-04 | 2020-03 | 2020-02 | 2020-01 | 2019-12 | 2019-11 | 2019-10 | 2019-09 | 2019-08 | 2019-07 | 2019-06 | 2019-05 | 2019-04 | 2019-03 | 2019-02 | 2019-01 | 2018-12 | 2018-11 | 2018-10 |
|---|---|---|---|---|---|---|---|---|---|---|---|---|---|---|---|---|---|---|---|---|
| pm25 | 17 (Moderate) | 26 (Moderate) | 23 (Moderate) | 19 (Moderate) | 31 (Moderate) | 46 (Unhealthy for Sensitive Groups) | 44 (Unhealthy for Sensitive Groups) | 41 (Unhealthy for Sensitive Groups) | 32 (Moderate) | 23 (Moderate) | 18 (Moderate) | 14 (Moderate) | 20 (Moderate) | 25 (Moderate) | 29 (Moderate) | 24 (Moderate) | 48 (Unhealthy for Sensitive Groups) | 33 (Moderate) | 35 (Moderate) | 34 (Moderate) |
| co | 488 (Good) | 607 (Good) | 714 (Good) | 640 (Good) | 742 (Good) | 629 (Good) | 681 (Good) | 789 (Good) | 663 (Good) | 590 (Good) | 583 (Good) | 540 (Good) | 617 (Good) | 670 (Good) | 710 (Good) | 703 (Good) | 945 (Good) | 739 (Good) | 765 (Good) | 647 (Good) |
| no2 | 20 (Good) | 33 (Good) | 29 (Good) | 19 (Good) | 17 (Good) | 36 (Good) | 34 (Good) | 22 (Good) | 21 (Good) | 22 (Good) | 27 (Good) | 20 (Good) | 14 (Good) | 21 (Good) | 23 (Good) | 12 (Good) | 28 (Good) | 38 (Good) | 41 (Moderate) | 37 (Good) |
| o3 | 98 (Moderate) | 118 (Moderate) | 82 (Moderate) | 94 (Moderate) | 98 (Moderate) | 128 (Unhealthy for Sensitive Groups) | 186 (Very Unhealthy) | 185 (Very Unhealthy) | 181 (Very Unhealthy) | 154 (Unhealthy) | 93 (Moderate) | 87 (Moderate) | 109 (Moderate) | 103 (Moderate) | 61 (Good) | 64 (Good) | 91 (Moderate) | 78 (Moderate) | 111 (Moderate) | 131 (Unhealthy for Sensitive Groups) |
| pm10 | 33 (Moderate) | 52 (Unhealthy for Sensitive Groups) | 42 (Moderate) | 30 (Moderate) | 54 (Unhealthy for Sensitive Groups) | 95 (Unhealthy) | 93 (Unhealthy) | 69 (Unhealthy for Sensitive Groups) | 57 (Unhealthy for Sensitive Groups) | 39 (Moderate) | 34 (Moderate) | 25 (Moderate) | 37 (Moderate) | 44 (Moderate) | 50 (Unhealthy for Sensitive Groups) | 37 (Moderate) | 84 (Unhealthy) | 63 (Unhealthy for Sensitive Groups) | 75 (Unhealthy for Sensitive Groups) | 69 (Unhealthy for Sensitive Groups) |
| so2 | 4.2 (Good) | 4.5 (Good) | 4.3 (Good) | 4.5 (Good) | 4.9 (Good) | 7.2 (Good) | 9.6 (Good) | 9.1 (Good) | 9.2 (Good) | 6.5 (Good) | 5.5 (Good) | 6.2 (Good) | 4.3 (Good) | 4.3 (Good) | 3.9 (Good) | 3.2 (Good) | 5.5 (Good) | 7.3 (Good) | 8 (Good) | 10 (Good) |
PM10 6.7 (Good)
particulate matter (PM10) suspended dustPM2,5 1.7 (Good)
particulate matter (PM2.5) dustCO 100 (Good)
carbon monoxide (CO)NO2 7.6 (Good)
nitrogen dioxide (NO2)O3 0.02 (Good)
ozone (O3)SO2 8.6 (Good)
sulfur dioxide (SO2)观澜
| index | 2022-05-27 |
|---|---|
| pm10 | 32 |
| pm25 | 24 |
| co | 468 |
| no2 | 21 |
| o3 | 32 |
| so2 | 4.6 |
观澜
| index | 2020-05 | 2020-04 | 2020-03 | 2020-02 | 2020-01 | 2019-12 | 2019-11 | 2019-10 | 2019-09 | 2019-08 | 2019-07 | 2019-06 | 2019-05 | 2019-04 | 2019-03 | 2019-02 | 2019-01 | 2018-12 | 2018-11 | 2018-10 |
|---|---|---|---|---|---|---|---|---|---|---|---|---|---|---|---|---|---|---|---|---|
| o3 | 98 | 118 | 82 | 94 | 98 | 128 | 186 | 185 | 181 | 154 | 93 | 87 | 109 | 103 | 61 | 64 | 91 | 78 | 111 | 131 |
| pm25 | 17 | 26 | 23 | 19 | 31 | 46 | 44 | 41 | 32 | 23 | 18 | 14 | 20 | 25 | 29 | 24 | 48 | 33 | 35 | 34 |
| co | 488 | 607 | 714 | 640 | 742 | 629 | 681 | 789 | 663 | 590 | 583 | 540 | 617 | 670 | 710 | 703 | 945 | 739 | 765 | 647 |
| no2 | 20 | 33 | 29 | 19 | 17 | 36 | 34 | 22 | 21 | 22 | 27 | 20 | 14 | 21 | 23 | 12 | 28 | 38 | 41 | 37 |
| pm10 | 33 | 52 | 42 | 30 | 54 | 95 | 93 | 69 | 57 | 39 | 34 | 25 | 37 | 44 | 50 | 37 | 84 | 63 | 75 | 69 |
| so2 | 4.2 | 4.5 | 4.3 | 4.5 | 4.9 | 7.2 | 9.6 | 9.1 | 9.2 | 6.5 | 5.5 | 6.2 | 4.3 | 4.3 | 3.9 | 3.2 | 5.5 | 7.3 | 8 | 10 |