Air Pollution in Yujiacun: Real-time Air Quality Index and smog alert.
Pollution and air quality forecast for Yujiacun. Today is Tuesday, June 16, 2026. The following air pollution values have been recorded for Yujiacun:- particulate matter (PM10) suspended dust - 7 (Good)
- particulate matter (PM2.5) dust - 2 (Good)
- carbon monoxide (CO) - 100 (Good)
- nitrogen dioxide (NO2) - 8 (Good)
- ozone (O3) - 0 (Good)
- sulfur dioxide (SO2) - 9 (Good)

What is the air quality in Yujiacun today? Is the air polluted in Yujiacun?. Is there smog?
What is the level of PM10 today in Yujiacun? (particulate matter (PM10) suspended dust)
The current level of particulate matter PM10 in Yujiacun is:
7 (Good)
The highest PM10 values usually occur in month: 135 (January 2020).
The lowest value of particulate matter PM10 pollution in Yujiacun is usually recorded in: August (18).
What is the current level of PM2.5 in Yujiacun? (particulate matter (PM2.5) dust)
Today's PM2.5 level is:
2 (Good)
For comparison, the highest level of PM2.5 in Yujiacun in the last 7 days was: 24 (Friday, May 27, 2022) and the lowest: 24 (Friday, May 27, 2022).
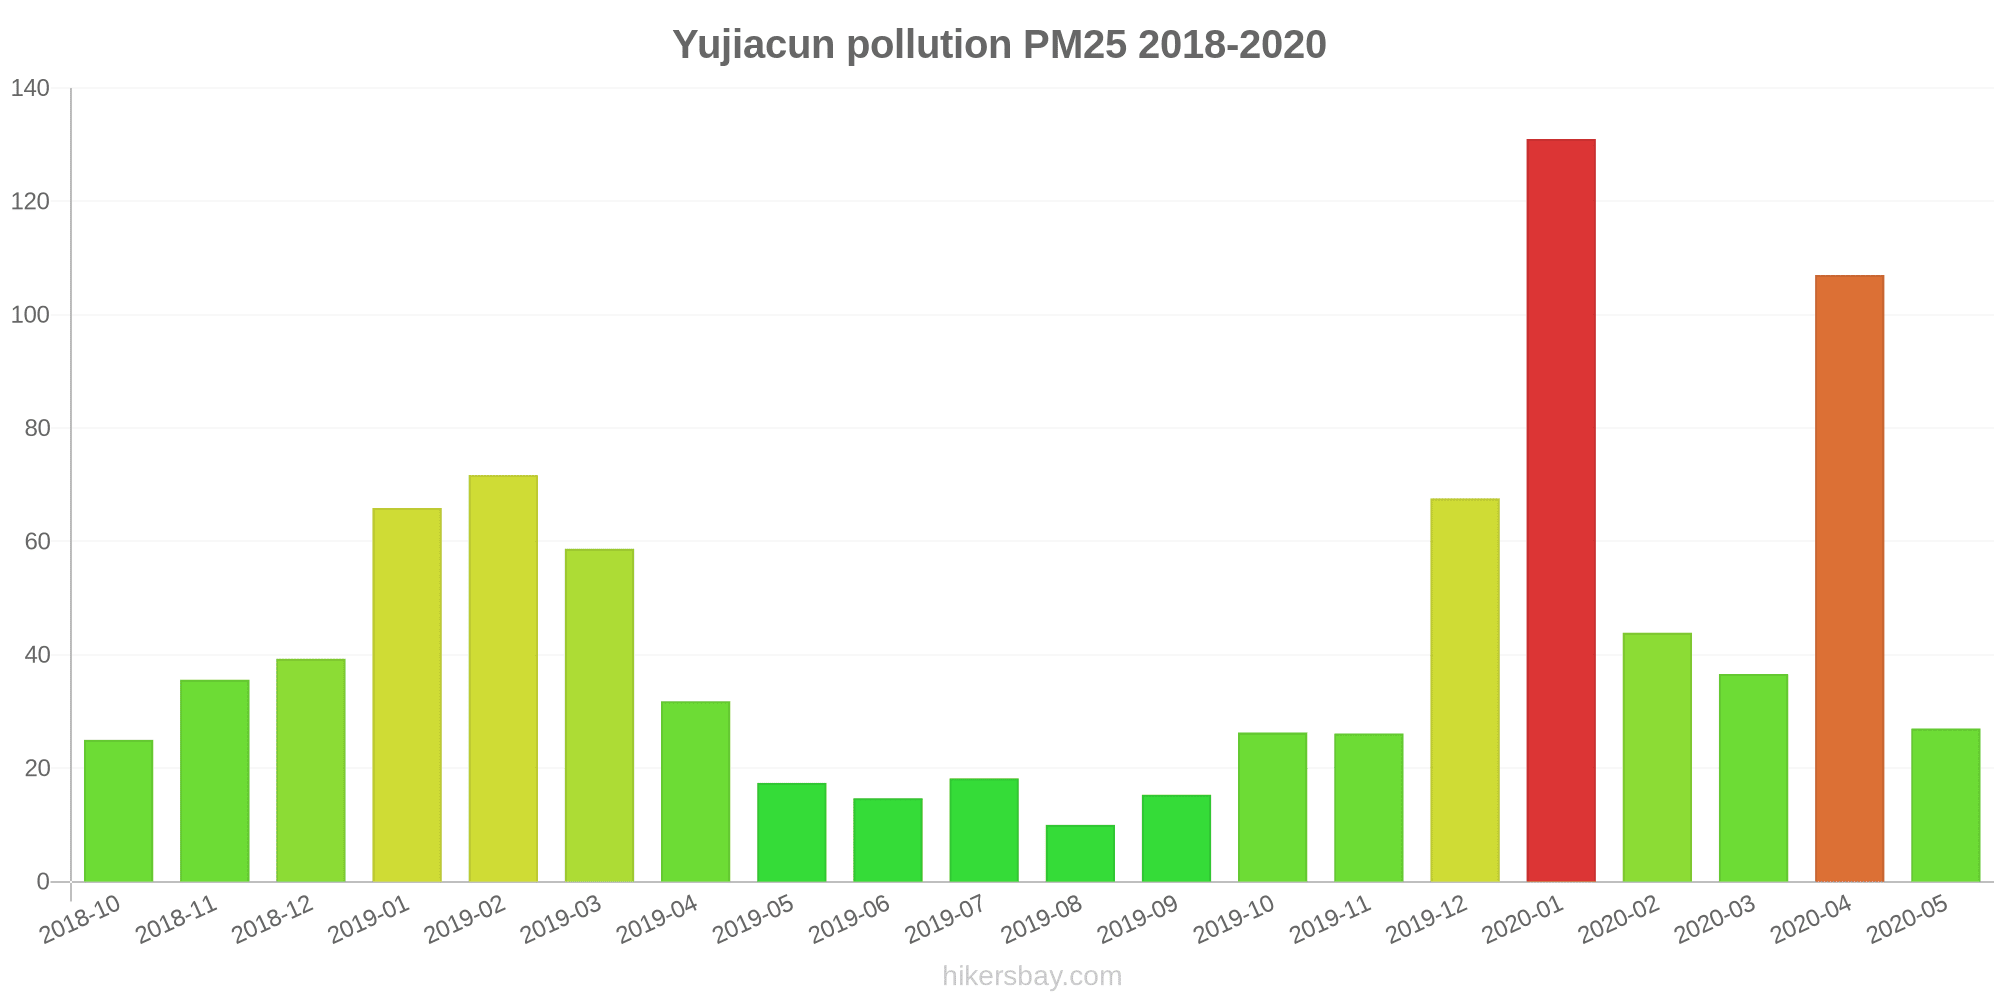
The highest PM2.5 values were recorded: 131 (January 2020).
The lowest level of particulate matter PM2.5 pollution occurs in month: August (10).
How high is the CO level? (carbon monoxide (CO))
100 (Good)
How high is the level of NO2? (nitrogen dioxide (NO2))
8 (Good)
How is the O3 level today in Yujiacun? (ozone (O3))
0 (Good)
What is the level of SO2 pollution? (sulfur dioxide (SO2))
9 (Good)
Current data Friday, May 27, 2022, 12:00 PM
PM10 7 (Good)
PM2,5 2 (Good)
CO 100 (Good)
NO2 8 (Good)
O3 0 (Good)
SO2 9 (Good)
Data on air pollution from recent days in Yujiacun
index
2022-05-27
pm10
32
Moderate
pm25
24
Moderate
co
468
Good
no2
21
Good
o3
32
Good
so2
5
Good
data source »
Air pollution in Yujiacun from October 2018 to May 2020

index
2020-05
2020-04
2020-03
2020-02
2020-01
2019-12
2019-11
2019-10
2019-09
2019-08
2019-07
2019-06
2019-05
2019-04
2019-03
2019-02
2019-01
2018-12
2018-11
2018-10
pm25
27 (Moderate)
107 (Very Unhealthy)
37 (Unhealthy for Sensitive Groups)
44 (Unhealthy for Sensitive Groups)
131 (Very bad Hazardous)
68 (Unhealthy)
26 (Moderate)
26 (Moderate)
15 (Moderate)
10 (Good)
18 (Moderate)
15 (Moderate)
17 (Moderate)
32 (Moderate)
59 (Unhealthy)
72 (Unhealthy)
66 (Unhealthy)
39 (Unhealthy for Sensitive Groups)
36 (Unhealthy for Sensitive Groups)
25 (Moderate)
co
427 (Good)
849 (Good)
629 (Good)
828 (Good)
1 (Good)
1 (Good)
644 (Good)
656 (Good)
608 (Good)
593 (Good)
608 (Good)
514 (Good)
502 (Good)
596 (Good)
783 (Good)
959 (Good)
1 (Good)
659 (Good)
669 (Good)
682 (Good)
no2
14 (Good)
26 (Good)
16 (Good)
12 (Good)
27 (Good)
24 (Good)
18 (Good)
18 (Good)
13 (Good)
9.3 (Good)
18 (Good)
28 (Good)
11 (Good)
16 (Good)
17 (Good)
18 (Good)
26 (Good)
15 (Good)
18 (Good)
18 (Good)
o3
133 (Unhealthy for Sensitive Groups)
131 (Unhealthy for Sensitive Groups)
101 (Moderate)
91 (Moderate)
99 (Moderate)
71 (Moderate)
60 (Good)
96 (Moderate)
104 (Moderate)
83 (Moderate)
128 (Unhealthy for Sensitive Groups)
126 (Unhealthy for Sensitive Groups)
130 (Unhealthy for Sensitive Groups)
115 (Moderate)
104 (Moderate)
95 (Moderate)
74 (Moderate)
68 (Good)
70 (Good)
79 (Moderate)
pm10
55 (Unhealthy for Sensitive Groups)
116 (Very Unhealthy)
56 (Unhealthy for Sensitive Groups)
51 (Unhealthy for Sensitive Groups)
135 (Very Unhealthy)
75 (Unhealthy for Sensitive Groups)
44 (Moderate)
50 (Unhealthy for Sensitive Groups)
31 (Moderate)
18 (Good)
30 (Moderate)
26 (Moderate)
44 (Moderate)
77 (Unhealthy for Sensitive Groups)
87 (Unhealthy)
90 (Unhealthy)
96 (Unhealthy)
60 (Unhealthy for Sensitive Groups)
54 (Unhealthy for Sensitive Groups)
49 (Moderate)
so2
7.2 (Good)
9.7 (Good)
8.1 (Good)
9.5 (Good)
11 (Good)
10 (Good)
5.8 (Good)
4.6 (Good)
3.5 (Good)
2 (Good)
2 (Good)
2.6 (Good)
3.1 (Good)
3.7 (Good)
6.4 (Good)
7.9 (Good)
12 (Good)
8.3 (Good)
7.1 (Good)
5.3 (Good)
data source »
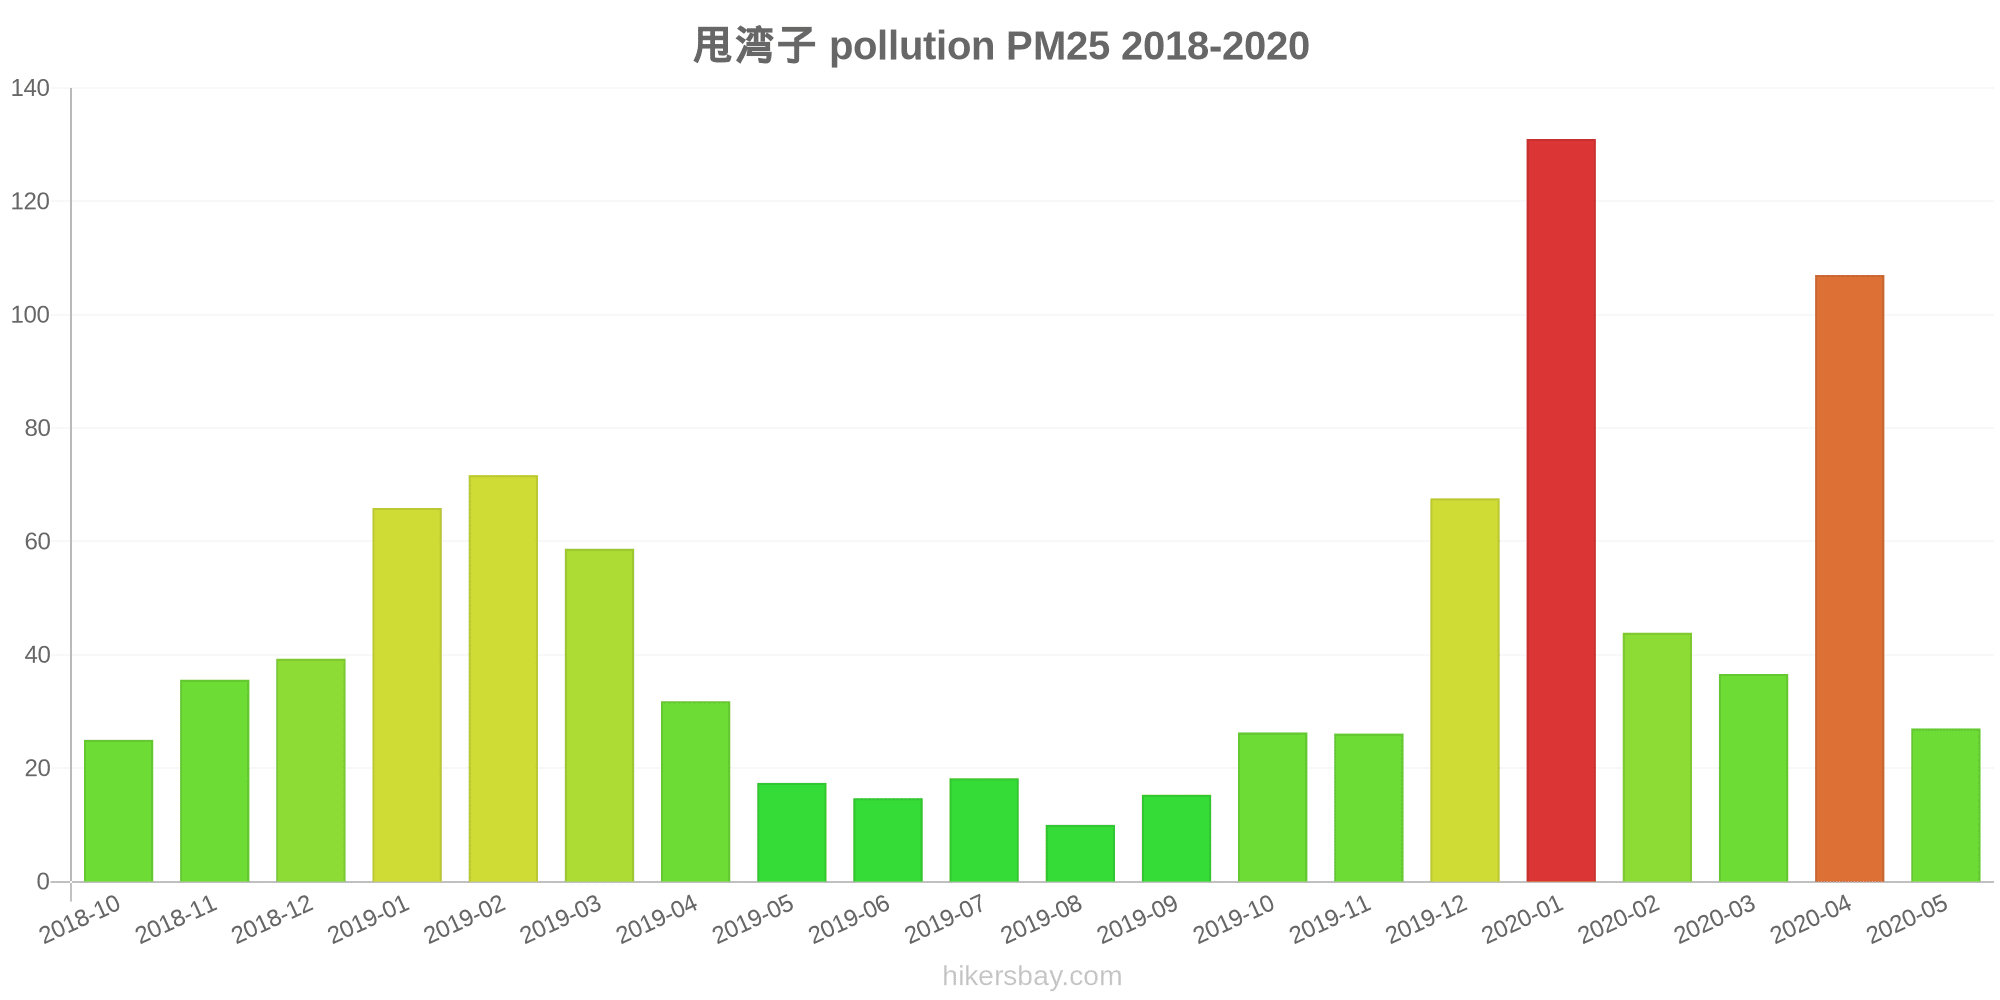
甩湾子
Friday, May 27, 2022, 12:00 PM
PM10 6.7 (Good)
particulate matter (PM10) suspended dust
PM2,5 1.7 (Good)
particulate matter (PM2.5) dust
CO 100 (Good)
carbon monoxide (CO)
NO2 7.6 (Good)
nitrogen dioxide (NO2)
O3 0.02 (Good)
ozone (O3)
SO2 8.6 (Good)
sulfur dioxide (SO2)
甩湾子
index
2022-05-27
pm10
32
pm25
24
co
468
no2
21
o3
32
so2
4.6
甩湾子
2018-10 2020-05

index
2020-05
2020-04
2020-03
2020-02
2020-01
2019-12
2019-11
2019-10
2019-09
2019-08
2019-07
2019-06
2019-05
2019-04
2019-03
2019-02
2019-01
2018-12
2018-11
2018-10
pm25
27
107
37
44
131
68
26
26
15
10
18
15
17
32
59
72
66
39
36
25
co
427
849
629
828
1
1
644
656
608
593
608
514
502
596
783
959
1
659
669
682
no2
14
26
16
12
27
24
18
18
13
9.3
18
28
11
16
17
18
26
15
18
18
o3
133
131
101
91
99
71
60
96
104
83
128
126
130
115
104
95
74
68
70
79
pm10
55
116
56
51
135
75
44
50
31
18
30
26
44
77
87
90
96
60
54
49
so2
7.2
9.7
8.1
9.5
11
10
5.8
4.6
3.5
2
2
2.6
3.1
3.7
6.4
7.9
12
8.3
7.1
5.3
* Pollution data source:
https://openaq.org
(ChinaAQIData)
The data is licensed under CC-By 4.0
PM10 7 (Good)
PM2,5 2 (Good)
CO 100 (Good)
NO2 8 (Good)
O3 0 (Good)
SO2 9 (Good)
Data on air pollution from recent days in Yujiacun
| index | 2022-05-27 |
|---|---|
| pm10 | 32 Moderate |
| pm25 | 24 Moderate |
| co | 468 Good |
| no2 | 21 Good |
| o3 | 32 Good |
| so2 | 5 Good |
| index | 2020-05 | 2020-04 | 2020-03 | 2020-02 | 2020-01 | 2019-12 | 2019-11 | 2019-10 | 2019-09 | 2019-08 | 2019-07 | 2019-06 | 2019-05 | 2019-04 | 2019-03 | 2019-02 | 2019-01 | 2018-12 | 2018-11 | 2018-10 |
|---|---|---|---|---|---|---|---|---|---|---|---|---|---|---|---|---|---|---|---|---|
| pm25 | 27 (Moderate) | 107 (Very Unhealthy) | 37 (Unhealthy for Sensitive Groups) | 44 (Unhealthy for Sensitive Groups) | 131 (Very bad Hazardous) | 68 (Unhealthy) | 26 (Moderate) | 26 (Moderate) | 15 (Moderate) | 10 (Good) | 18 (Moderate) | 15 (Moderate) | 17 (Moderate) | 32 (Moderate) | 59 (Unhealthy) | 72 (Unhealthy) | 66 (Unhealthy) | 39 (Unhealthy for Sensitive Groups) | 36 (Unhealthy for Sensitive Groups) | 25 (Moderate) |
| co | 427 (Good) | 849 (Good) | 629 (Good) | 828 (Good) | 1 (Good) | 1 (Good) | 644 (Good) | 656 (Good) | 608 (Good) | 593 (Good) | 608 (Good) | 514 (Good) | 502 (Good) | 596 (Good) | 783 (Good) | 959 (Good) | 1 (Good) | 659 (Good) | 669 (Good) | 682 (Good) |
| no2 | 14 (Good) | 26 (Good) | 16 (Good) | 12 (Good) | 27 (Good) | 24 (Good) | 18 (Good) | 18 (Good) | 13 (Good) | 9.3 (Good) | 18 (Good) | 28 (Good) | 11 (Good) | 16 (Good) | 17 (Good) | 18 (Good) | 26 (Good) | 15 (Good) | 18 (Good) | 18 (Good) |
| o3 | 133 (Unhealthy for Sensitive Groups) | 131 (Unhealthy for Sensitive Groups) | 101 (Moderate) | 91 (Moderate) | 99 (Moderate) | 71 (Moderate) | 60 (Good) | 96 (Moderate) | 104 (Moderate) | 83 (Moderate) | 128 (Unhealthy for Sensitive Groups) | 126 (Unhealthy for Sensitive Groups) | 130 (Unhealthy for Sensitive Groups) | 115 (Moderate) | 104 (Moderate) | 95 (Moderate) | 74 (Moderate) | 68 (Good) | 70 (Good) | 79 (Moderate) |
| pm10 | 55 (Unhealthy for Sensitive Groups) | 116 (Very Unhealthy) | 56 (Unhealthy for Sensitive Groups) | 51 (Unhealthy for Sensitive Groups) | 135 (Very Unhealthy) | 75 (Unhealthy for Sensitive Groups) | 44 (Moderate) | 50 (Unhealthy for Sensitive Groups) | 31 (Moderate) | 18 (Good) | 30 (Moderate) | 26 (Moderate) | 44 (Moderate) | 77 (Unhealthy for Sensitive Groups) | 87 (Unhealthy) | 90 (Unhealthy) | 96 (Unhealthy) | 60 (Unhealthy for Sensitive Groups) | 54 (Unhealthy for Sensitive Groups) | 49 (Moderate) |
| so2 | 7.2 (Good) | 9.7 (Good) | 8.1 (Good) | 9.5 (Good) | 11 (Good) | 10 (Good) | 5.8 (Good) | 4.6 (Good) | 3.5 (Good) | 2 (Good) | 2 (Good) | 2.6 (Good) | 3.1 (Good) | 3.7 (Good) | 6.4 (Good) | 7.9 (Good) | 12 (Good) | 8.3 (Good) | 7.1 (Good) | 5.3 (Good) |
PM10 6.7 (Good)
particulate matter (PM10) suspended dustPM2,5 1.7 (Good)
particulate matter (PM2.5) dustCO 100 (Good)
carbon monoxide (CO)NO2 7.6 (Good)
nitrogen dioxide (NO2)O3 0.02 (Good)
ozone (O3)SO2 8.6 (Good)
sulfur dioxide (SO2)甩湾子
| index | 2022-05-27 |
|---|---|
| pm10 | 32 |
| pm25 | 24 |
| co | 468 |
| no2 | 21 |
| o3 | 32 |
| so2 | 4.6 |
甩湾子
| index | 2020-05 | 2020-04 | 2020-03 | 2020-02 | 2020-01 | 2019-12 | 2019-11 | 2019-10 | 2019-09 | 2019-08 | 2019-07 | 2019-06 | 2019-05 | 2019-04 | 2019-03 | 2019-02 | 2019-01 | 2018-12 | 2018-11 | 2018-10 |
|---|---|---|---|---|---|---|---|---|---|---|---|---|---|---|---|---|---|---|---|---|
| pm25 | 27 | 107 | 37 | 44 | 131 | 68 | 26 | 26 | 15 | 10 | 18 | 15 | 17 | 32 | 59 | 72 | 66 | 39 | 36 | 25 |
| co | 427 | 849 | 629 | 828 | 1 | 1 | 644 | 656 | 608 | 593 | 608 | 514 | 502 | 596 | 783 | 959 | 1 | 659 | 669 | 682 |
| no2 | 14 | 26 | 16 | 12 | 27 | 24 | 18 | 18 | 13 | 9.3 | 18 | 28 | 11 | 16 | 17 | 18 | 26 | 15 | 18 | 18 |
| o3 | 133 | 131 | 101 | 91 | 99 | 71 | 60 | 96 | 104 | 83 | 128 | 126 | 130 | 115 | 104 | 95 | 74 | 68 | 70 | 79 |
| pm10 | 55 | 116 | 56 | 51 | 135 | 75 | 44 | 50 | 31 | 18 | 30 | 26 | 44 | 77 | 87 | 90 | 96 | 60 | 54 | 49 |
| so2 | 7.2 | 9.7 | 8.1 | 9.5 | 11 | 10 | 5.8 | 4.6 | 3.5 | 2 | 2 | 2.6 | 3.1 | 3.7 | 6.4 | 7.9 | 12 | 8.3 | 7.1 | 5.3 |