Air Pollution in Wuguling: Real-time Air Quality Index and smog alert.
Pollution and air quality forecast for Wuguling. Today is Tuesday, June 16, 2026. The following air pollution values have been recorded for Wuguling:- particulate matter (PM10) suspended dust - 7 (Good)
- particulate matter (PM2.5) dust - 2 (Good)
- carbon monoxide (CO) - 100 (Good)
- nitrogen dioxide (NO2) - 8 (Good)
- ozone (O3) - 0 (Good)
- sulfur dioxide (SO2) - 9 (Good)

What is the air quality in Wuguling today? Is the air polluted in Wuguling?. Is there smog?
What is the level of PM10 today in Wuguling? (particulate matter (PM10) suspended dust)
The current level of particulate matter PM10 in Wuguling is:
7 (Good)
The highest PM10 values usually occur in month: 138 (January 2020).
The lowest value of particulate matter PM10 pollution in Wuguling is usually recorded in: August (29).
What is the current level of PM2.5 in Wuguling? (particulate matter (PM2.5) dust)
Today's PM2.5 level is:
2 (Good)
For comparison, the highest level of PM2.5 in Wuguling in the last 7 days was: 24 (Friday, May 27, 2022) and the lowest: 24 (Friday, May 27, 2022).
The highest PM2.5 values were recorded: 129 (January 2020).
The lowest level of particulate matter PM2.5 pollution occurs in month: August (12).
How high is the CO level? (carbon monoxide (CO))
100 (Good)
How high is the level of NO2? (nitrogen dioxide (NO2))
8 (Good)
How is the O3 level today in Wuguling? (ozone (O3))
0 (Good)
What is the level of SO2 pollution? (sulfur dioxide (SO2))
9 (Good)
Current data Friday, May 27, 2022, 12:00 PM
PM10 7 (Good)
PM2,5 2 (Good)
CO 100 (Good)
NO2 8 (Good)
O3 0 (Good)
SO2 9 (Good)
Data on air pollution from recent days in Wuguling
index
2022-05-27
pm10
32
Moderate
pm25
24
Moderate
co
468
Good
no2
21
Good
o3
32
Good
so2
5
Good
data source »
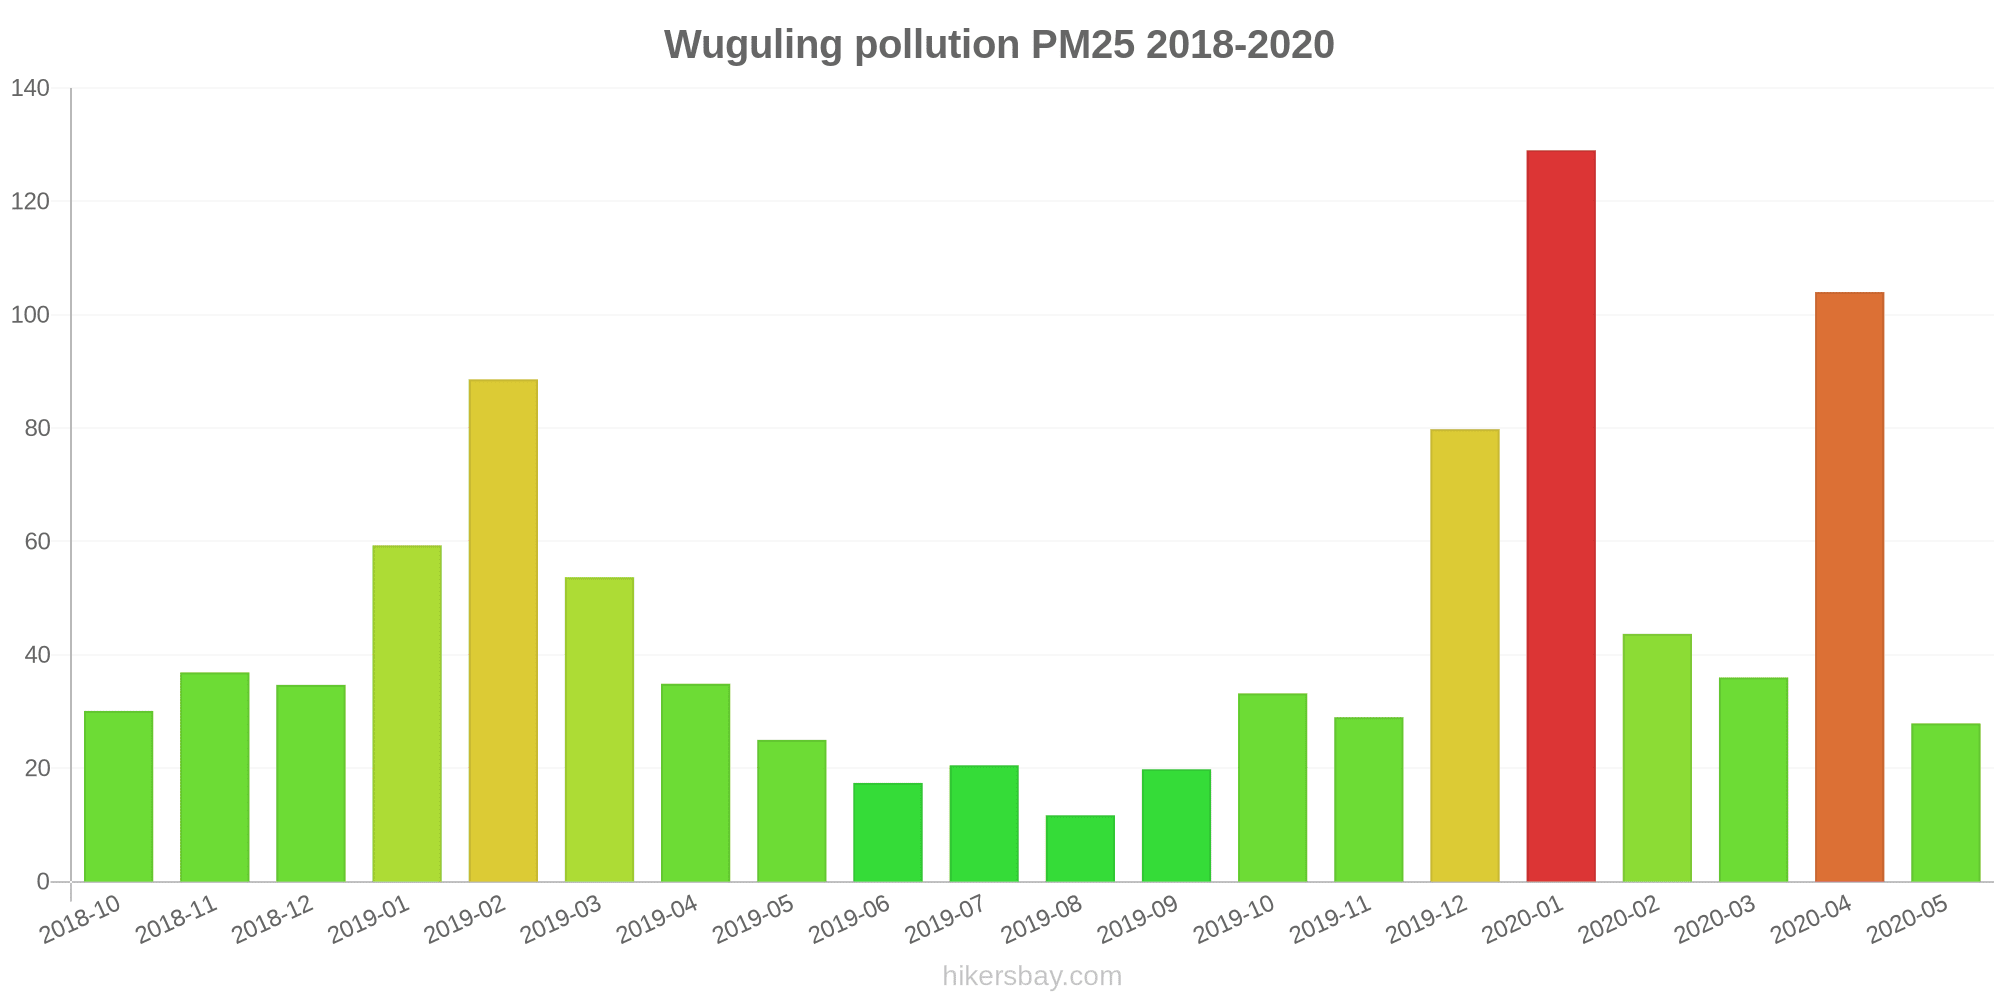
Air pollution in Wuguling from October 2018 to May 2020

index
2020-05
2020-04
2020-03
2020-02
2020-01
2019-12
2019-11
2019-10
2019-09
2019-08
2019-07
2019-06
2019-05
2019-04
2019-03
2019-02
2019-01
2018-12
2018-11
2018-10
pm25
28 (Moderate)
104 (Very Unhealthy)
36 (Unhealthy for Sensitive Groups)
44 (Unhealthy for Sensitive Groups)
129 (Very bad Hazardous)
80 (Very Unhealthy)
29 (Moderate)
33 (Moderate)
20 (Moderate)
12 (Good)
21 (Moderate)
17 (Moderate)
25 (Moderate)
35 (Moderate)
54 (Unhealthy for Sensitive Groups)
89 (Very Unhealthy)
59 (Unhealthy)
35 (Moderate)
37 (Unhealthy for Sensitive Groups)
30 (Moderate)
co
440 (Good)
787 (Good)
574 (Good)
668 (Good)
1 (Good)
942 (Good)
558 (Good)
657 (Good)
574 (Good)
552 (Good)
567 (Good)
482 (Good)
477 (Good)
537 (Good)
659 (Good)
929 (Good)
1 (Good)
904 (Good)
893 (Good)
795 (Good)
no2
26 (Good)
43 (Moderate)
26 (Good)
20 (Good)
44 (Moderate)
43 (Moderate)
31 (Good)
38 (Good)
31 (Good)
23 (Good)
26 (Good)
29 (Good)
22 (Good)
30 (Good)
33 (Good)
33 (Good)
37 (Good)
26 (Good)
31 (Good)
28 (Good)
o3
137 (Unhealthy for Sensitive Groups)
125 (Unhealthy for Sensitive Groups)
97 (Moderate)
86 (Moderate)
92 (Moderate)
55 (Good)
56 (Good)
86 (Moderate)
102 (Moderate)
83 (Moderate)
141 (Unhealthy for Sensitive Groups)
134 (Unhealthy for Sensitive Groups)
123 (Unhealthy for Sensitive Groups)
117 (Moderate)
102 (Moderate)
82 (Moderate)
58 (Good)
62 (Good)
69 (Good)
78 (Moderate)
pm10
65 (Unhealthy for Sensitive Groups)
127 (Very Unhealthy)
65 (Unhealthy for Sensitive Groups)
53 (Unhealthy for Sensitive Groups)
138 (Very Unhealthy)
95 (Unhealthy)
57 (Unhealthy for Sensitive Groups)
76 (Unhealthy for Sensitive Groups)
55 (Unhealthy for Sensitive Groups)
29 (Moderate)
45 (Moderate)
38 (Moderate)
68 (Unhealthy for Sensitive Groups)
111 (Very Unhealthy)
103 (Unhealthy)
105 (Unhealthy)
96 (Unhealthy)
60 (Unhealthy for Sensitive Groups)
68 (Unhealthy for Sensitive Groups)
60 (Unhealthy for Sensitive Groups)
so2
6.6 (Good)
10 (Good)
8.3 (Good)
13 (Good)
21 (Good)
16 (Good)
9.8 (Good)
7.5 (Good)
5.3 (Good)
2.4 (Good)
3.5 (Good)
4.8 (Good)
6.2 (Good)
7.6 (Good)
13 (Good)
16 (Good)
16 (Good)
13 (Good)
11 (Good)
7.8 (Good)
data source »
岱山公园
Friday, May 27, 2022, 12:00 PM
PM10 6.7 (Good)
particulate matter (PM10) suspended dust
PM2,5 1.7 (Good)
particulate matter (PM2.5) dust
CO 100 (Good)
carbon monoxide (CO)
NO2 7.6 (Good)
nitrogen dioxide (NO2)
O3 0.02 (Good)
ozone (O3)
SO2 8.6 (Good)
sulfur dioxide (SO2)
岱山公园
index
2022-05-27
pm10
32
pm25
24
co
468
no2
21
o3
32
so2
4.6
岱山公园
2018-10 2020-05

index
2020-05
2020-04
2020-03
2020-02
2020-01
2019-12
2019-11
2019-10
2019-09
2019-08
2019-07
2019-06
2019-05
2019-04
2019-03
2019-02
2019-01
2018-12
2018-11
2018-10
pm25
28
104
36
44
129
80
29
33
20
12
21
17
25
35
54
89
59
35
37
30
co
440
787
574
668
1
942
558
657
574
552
567
482
477
537
659
929
1
904
893
795
no2
26
43
26
20
44
43
31
38
31
23
26
29
22
30
33
33
37
26
31
28
o3
137
125
97
86
92
55
56
86
102
83
141
134
123
117
102
82
58
62
69
78
pm10
65
127
65
53
138
95
57
76
55
29
45
38
68
111
103
105
96
60
68
60
so2
6.6
10
8.3
13
21
16
9.8
7.5
5.3
2.4
3.5
4.8
6.2
7.6
13
16
16
13
11
7.8
* Pollution data source:
https://openaq.org
(ChinaAQIData)
The data is licensed under CC-By 4.0
PM10 7 (Good)
PM2,5 2 (Good)
CO 100 (Good)
NO2 8 (Good)
O3 0 (Good)
SO2 9 (Good)
Data on air pollution from recent days in Wuguling
| index | 2022-05-27 |
|---|---|
| pm10 | 32 Moderate |
| pm25 | 24 Moderate |
| co | 468 Good |
| no2 | 21 Good |
| o3 | 32 Good |
| so2 | 5 Good |
| index | 2020-05 | 2020-04 | 2020-03 | 2020-02 | 2020-01 | 2019-12 | 2019-11 | 2019-10 | 2019-09 | 2019-08 | 2019-07 | 2019-06 | 2019-05 | 2019-04 | 2019-03 | 2019-02 | 2019-01 | 2018-12 | 2018-11 | 2018-10 |
|---|---|---|---|---|---|---|---|---|---|---|---|---|---|---|---|---|---|---|---|---|
| pm25 | 28 (Moderate) | 104 (Very Unhealthy) | 36 (Unhealthy for Sensitive Groups) | 44 (Unhealthy for Sensitive Groups) | 129 (Very bad Hazardous) | 80 (Very Unhealthy) | 29 (Moderate) | 33 (Moderate) | 20 (Moderate) | 12 (Good) | 21 (Moderate) | 17 (Moderate) | 25 (Moderate) | 35 (Moderate) | 54 (Unhealthy for Sensitive Groups) | 89 (Very Unhealthy) | 59 (Unhealthy) | 35 (Moderate) | 37 (Unhealthy for Sensitive Groups) | 30 (Moderate) |
| co | 440 (Good) | 787 (Good) | 574 (Good) | 668 (Good) | 1 (Good) | 942 (Good) | 558 (Good) | 657 (Good) | 574 (Good) | 552 (Good) | 567 (Good) | 482 (Good) | 477 (Good) | 537 (Good) | 659 (Good) | 929 (Good) | 1 (Good) | 904 (Good) | 893 (Good) | 795 (Good) |
| no2 | 26 (Good) | 43 (Moderate) | 26 (Good) | 20 (Good) | 44 (Moderate) | 43 (Moderate) | 31 (Good) | 38 (Good) | 31 (Good) | 23 (Good) | 26 (Good) | 29 (Good) | 22 (Good) | 30 (Good) | 33 (Good) | 33 (Good) | 37 (Good) | 26 (Good) | 31 (Good) | 28 (Good) |
| o3 | 137 (Unhealthy for Sensitive Groups) | 125 (Unhealthy for Sensitive Groups) | 97 (Moderate) | 86 (Moderate) | 92 (Moderate) | 55 (Good) | 56 (Good) | 86 (Moderate) | 102 (Moderate) | 83 (Moderate) | 141 (Unhealthy for Sensitive Groups) | 134 (Unhealthy for Sensitive Groups) | 123 (Unhealthy for Sensitive Groups) | 117 (Moderate) | 102 (Moderate) | 82 (Moderate) | 58 (Good) | 62 (Good) | 69 (Good) | 78 (Moderate) |
| pm10 | 65 (Unhealthy for Sensitive Groups) | 127 (Very Unhealthy) | 65 (Unhealthy for Sensitive Groups) | 53 (Unhealthy for Sensitive Groups) | 138 (Very Unhealthy) | 95 (Unhealthy) | 57 (Unhealthy for Sensitive Groups) | 76 (Unhealthy for Sensitive Groups) | 55 (Unhealthy for Sensitive Groups) | 29 (Moderate) | 45 (Moderate) | 38 (Moderate) | 68 (Unhealthy for Sensitive Groups) | 111 (Very Unhealthy) | 103 (Unhealthy) | 105 (Unhealthy) | 96 (Unhealthy) | 60 (Unhealthy for Sensitive Groups) | 68 (Unhealthy for Sensitive Groups) | 60 (Unhealthy for Sensitive Groups) |
| so2 | 6.6 (Good) | 10 (Good) | 8.3 (Good) | 13 (Good) | 21 (Good) | 16 (Good) | 9.8 (Good) | 7.5 (Good) | 5.3 (Good) | 2.4 (Good) | 3.5 (Good) | 4.8 (Good) | 6.2 (Good) | 7.6 (Good) | 13 (Good) | 16 (Good) | 16 (Good) | 13 (Good) | 11 (Good) | 7.8 (Good) |
PM10 6.7 (Good)
particulate matter (PM10) suspended dustPM2,5 1.7 (Good)
particulate matter (PM2.5) dustCO 100 (Good)
carbon monoxide (CO)NO2 7.6 (Good)
nitrogen dioxide (NO2)O3 0.02 (Good)
ozone (O3)SO2 8.6 (Good)
sulfur dioxide (SO2)岱山公园
| index | 2022-05-27 |
|---|---|
| pm10 | 32 |
| pm25 | 24 |
| co | 468 |
| no2 | 21 |
| o3 | 32 |
| so2 | 4.6 |
岱山公园

| index | 2020-05 | 2020-04 | 2020-03 | 2020-02 | 2020-01 | 2019-12 | 2019-11 | 2019-10 | 2019-09 | 2019-08 | 2019-07 | 2019-06 | 2019-05 | 2019-04 | 2019-03 | 2019-02 | 2019-01 | 2018-12 | 2018-11 | 2018-10 |
|---|---|---|---|---|---|---|---|---|---|---|---|---|---|---|---|---|---|---|---|---|
| pm25 | 28 | 104 | 36 | 44 | 129 | 80 | 29 | 33 | 20 | 12 | 21 | 17 | 25 | 35 | 54 | 89 | 59 | 35 | 37 | 30 |
| co | 440 | 787 | 574 | 668 | 1 | 942 | 558 | 657 | 574 | 552 | 567 | 482 | 477 | 537 | 659 | 929 | 1 | 904 | 893 | 795 |
| no2 | 26 | 43 | 26 | 20 | 44 | 43 | 31 | 38 | 31 | 23 | 26 | 29 | 22 | 30 | 33 | 33 | 37 | 26 | 31 | 28 |
| o3 | 137 | 125 | 97 | 86 | 92 | 55 | 56 | 86 | 102 | 83 | 141 | 134 | 123 | 117 | 102 | 82 | 58 | 62 | 69 | 78 |
| pm10 | 65 | 127 | 65 | 53 | 138 | 95 | 57 | 76 | 55 | 29 | 45 | 38 | 68 | 111 | 103 | 105 | 96 | 60 | 68 | 60 |
| so2 | 6.6 | 10 | 8.3 | 13 | 21 | 16 | 9.8 | 7.5 | 5.3 | 2.4 | 3.5 | 4.8 | 6.2 | 7.6 | 13 | 16 | 16 | 13 | 11 | 7.8 |