Air Pollution in Sanjiacun: Real-time Air Quality Index and smog alert.
Pollution and air quality forecast for Sanjiacun. Today is Tuesday, June 16, 2026. The following air pollution values have been recorded for Sanjiacun:- particulate matter (PM10) suspended dust - 7 (Good)
- particulate matter (PM2.5) dust - 2 (Good)
- carbon monoxide (CO) - 100 (Good)
- nitrogen dioxide (NO2) - 8 (Good)
- ozone (O3) - 0 (Good)
- sulfur dioxide (SO2) - 9 (Good)

What is the air quality in Sanjiacun today? Is the air polluted in Sanjiacun?. Is there smog?
What is the level of PM10 today in Sanjiacun? (particulate matter (PM10) suspended dust)
The current level of particulate matter PM10 in Sanjiacun is:
7 (Good)
The highest PM10 values usually occur in month: 143 (April 2020).
The lowest value of particulate matter PM10 pollution in Sanjiacun is usually recorded in: August (24).
What is the current level of PM2.5 in Sanjiacun? (particulate matter (PM2.5) dust)
Today's PM2.5 level is:
2 (Good)
For comparison, the highest level of PM2.5 in Sanjiacun in the last 7 days was: 24 (Friday, May 27, 2022) and the lowest: 24 (Friday, May 27, 2022).
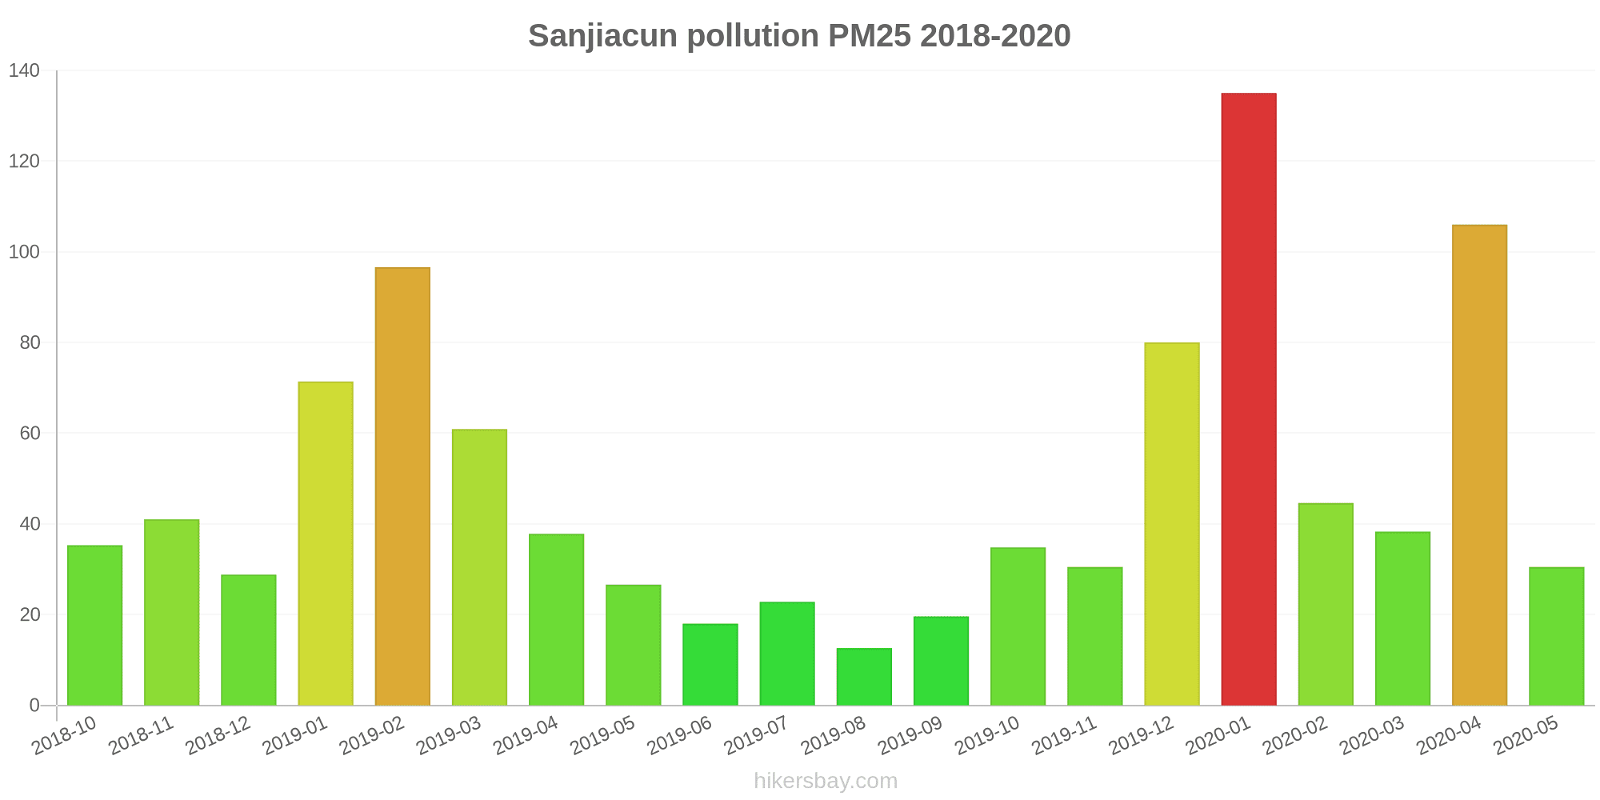
The highest PM2.5 values were recorded: 135 (January 2020).
The lowest level of particulate matter PM2.5 pollution occurs in month: August (13).
How high is the CO level? (carbon monoxide (CO))
100 (Good)
How high is the level of NO2? (nitrogen dioxide (NO2))
8 (Good)
How is the O3 level today in Sanjiacun? (ozone (O3))
0 (Good)
What is the level of SO2 pollution? (sulfur dioxide (SO2))
9 (Good)
Current data Friday, May 27, 2022, 12:00 PM
PM10 7 (Good)
PM2,5 2 (Good)
CO 100 (Good)
NO2 8 (Good)
O3 0 (Good)
SO2 9 (Good)
Data on air pollution from recent days in Sanjiacun
index
2022-05-27
pm10
32
Moderate
pm25
24
Moderate
co
468
Good
no2
21
Good
o3
32
Good
so2
5
Good
data source »
Air pollution in Sanjiacun from October 2018 to May 2020
index
2020-05
2020-04
2020-03
2020-02
2020-01
2019-12
2019-11
2019-10
2019-09
2019-08
2019-07
2019-06
2019-05
2019-04
2019-03
2019-02
2019-01
2018-12
2018-11
2018-10
pm25
31 (Moderate)
106 (Very Unhealthy)
38 (Unhealthy for Sensitive Groups)
45 (Unhealthy for Sensitive Groups)
135 (Very bad Hazardous)
80 (Very Unhealthy)
31 (Moderate)
35 (Moderate)
20 (Moderate)
13 (Good)
23 (Moderate)
18 (Moderate)
27 (Moderate)
38 (Unhealthy for Sensitive Groups)
61 (Unhealthy)
97 (Very Unhealthy)
71 (Unhealthy)
29 (Moderate)
41 (Unhealthy for Sensitive Groups)
35 (Unhealthy for Sensitive Groups)
co
513 (Good)
979 (Good)
605 (Good)
715 (Good)
1 (Good)
949 (Good)
637 (Good)
730 (Good)
580 (Good)
582 (Good)
593 (Good)
502 (Good)
471 (Good)
539 (Good)
826 (Good)
1 (Good)
966 (Good)
843 (Good)
855 (Good)
657 (Good)
no2
24 (Good)
43 (Moderate)
25 (Good)
22 (Good)
49 (Moderate)
41 (Moderate)
29 (Good)
33 (Good)
25 (Good)
17 (Good)
22 (Good)
27 (Good)
23 (Good)
31 (Good)
37 (Good)
32 (Good)
36 (Good)
29 (Good)
30 (Good)
27 (Good)
o3
128 (Unhealthy for Sensitive Groups)
127 (Unhealthy for Sensitive Groups)
97 (Moderate)
88 (Moderate)
87 (Moderate)
59 (Good)
59 (Good)
84 (Moderate)
101 (Moderate)
87 (Moderate)
134 (Unhealthy for Sensitive Groups)
135 (Unhealthy for Sensitive Groups)
132 (Unhealthy for Sensitive Groups)
118 (Moderate)
110 (Moderate)
102 (Moderate)
69 (Good)
57 (Good)
62 (Good)
73 (Moderate)
pm10
72 (Unhealthy for Sensitive Groups)
143 (Very Unhealthy)
64 (Unhealthy for Sensitive Groups)
51 (Unhealthy for Sensitive Groups)
140 (Very Unhealthy)
85 (Unhealthy)
58 (Unhealthy for Sensitive Groups)
72 (Unhealthy for Sensitive Groups)
42 (Moderate)
24 (Moderate)
44 (Moderate)
39 (Moderate)
69 (Unhealthy for Sensitive Groups)
106 (Unhealthy)
113 (Very Unhealthy)
99 (Unhealthy)
97 (Unhealthy)
60 (Unhealthy for Sensitive Groups)
67 (Unhealthy for Sensitive Groups)
61 (Unhealthy for Sensitive Groups)
so2
4.9 (Good)
8.2 (Good)
6.7 (Good)
11 (Good)
19 (Good)
13 (Good)
8.6 (Good)
5.3 (Good)
3.8 (Good)
2.2 (Good)
2.8 (Good)
3.9 (Good)
4.7 (Good)
5.3 (Good)
9.1 (Good)
12 (Good)
13 (Good)
14 (Good)
13 (Good)
8.5 (Good)
data source »
高新区管委会
Friday, May 27, 2022, 12:00 PM
PM10 6.7 (Good)
particulate matter (PM10) suspended dust
PM2,5 1.7 (Good)
particulate matter (PM2.5) dust
CO 100 (Good)
carbon monoxide (CO)
NO2 7.6 (Good)
nitrogen dioxide (NO2)
O3 0.02 (Good)
ozone (O3)
SO2 8.6 (Good)
sulfur dioxide (SO2)
高新区管委会
index
2022-05-27
pm10
32
pm25
24
co
468
no2
21
o3
32
so2
4.6
高新区管委会
2018-10 2020-05
index
2020-05
2020-04
2020-03
2020-02
2020-01
2019-12
2019-11
2019-10
2019-09
2019-08
2019-07
2019-06
2019-05
2019-04
2019-03
2019-02
2019-01
2018-12
2018-11
2018-10
pm25
31
106
38
45
135
80
31
35
20
13
23
18
27
38
61
97
71
29
41
35
co
513
979
605
715
1
949
637
730
580
582
593
502
471
539
826
1
966
843
855
657
no2
24
43
25
22
49
41
29
33
25
17
22
27
23
31
37
32
36
29
30
27
o3
128
127
97
88
87
59
59
84
101
87
134
135
132
118
110
102
69
57
62
73
pm10
72
143
64
51
140
85
58
72
42
24
44
39
69
106
113
99
97
60
67
61
so2
4.9
8.2
6.7
11
19
13
8.6
5.3
3.8
2.2
2.8
3.9
4.7
5.3
9.1
12
13
14
13
8.5
* Pollution data source:
https://openaq.org
(ChinaAQIData)
The data is licensed under CC-By 4.0
PM10 7 (Good)
PM2,5 2 (Good)
CO 100 (Good)
NO2 8 (Good)
O3 0 (Good)
SO2 9 (Good)
Data on air pollution from recent days in Sanjiacun
| index | 2022-05-27 |
|---|---|
| pm10 | 32 Moderate |
| pm25 | 24 Moderate |
| co | 468 Good |
| no2 | 21 Good |
| o3 | 32 Good |
| so2 | 5 Good |

| index | 2020-05 | 2020-04 | 2020-03 | 2020-02 | 2020-01 | 2019-12 | 2019-11 | 2019-10 | 2019-09 | 2019-08 | 2019-07 | 2019-06 | 2019-05 | 2019-04 | 2019-03 | 2019-02 | 2019-01 | 2018-12 | 2018-11 | 2018-10 |
|---|---|---|---|---|---|---|---|---|---|---|---|---|---|---|---|---|---|---|---|---|
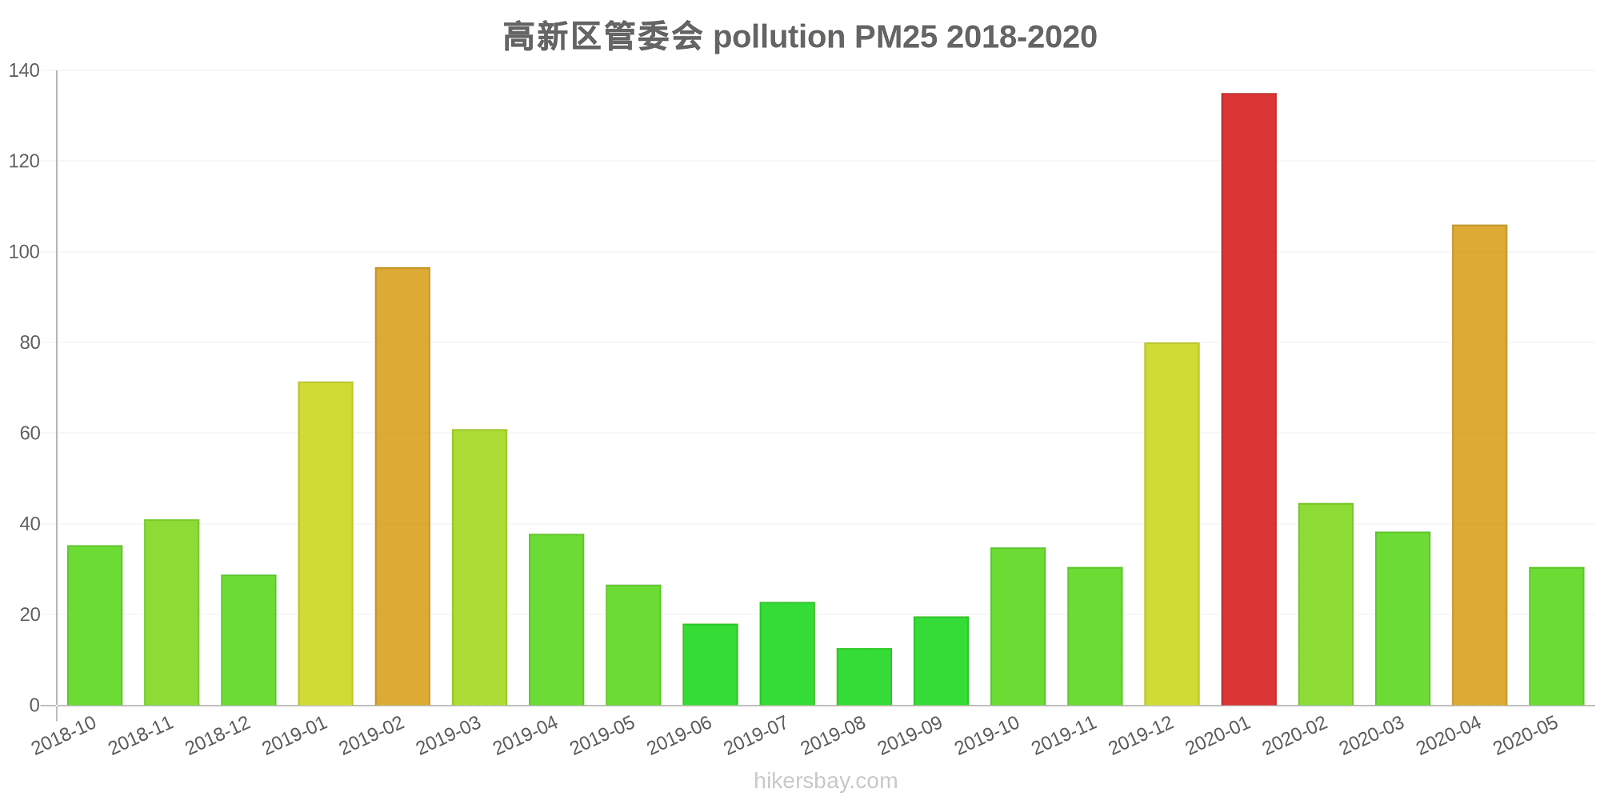
| pm25 | 31 (Moderate) | 106 (Very Unhealthy) | 38 (Unhealthy for Sensitive Groups) | 45 (Unhealthy for Sensitive Groups) | 135 (Very bad Hazardous) | 80 (Very Unhealthy) | 31 (Moderate) | 35 (Moderate) | 20 (Moderate) | 13 (Good) | 23 (Moderate) | 18 (Moderate) | 27 (Moderate) | 38 (Unhealthy for Sensitive Groups) | 61 (Unhealthy) | 97 (Very Unhealthy) | 71 (Unhealthy) | 29 (Moderate) | 41 (Unhealthy for Sensitive Groups) | 35 (Unhealthy for Sensitive Groups) |
| co | 513 (Good) | 979 (Good) | 605 (Good) | 715 (Good) | 1 (Good) | 949 (Good) | 637 (Good) | 730 (Good) | 580 (Good) | 582 (Good) | 593 (Good) | 502 (Good) | 471 (Good) | 539 (Good) | 826 (Good) | 1 (Good) | 966 (Good) | 843 (Good) | 855 (Good) | 657 (Good) |
| no2 | 24 (Good) | 43 (Moderate) | 25 (Good) | 22 (Good) | 49 (Moderate) | 41 (Moderate) | 29 (Good) | 33 (Good) | 25 (Good) | 17 (Good) | 22 (Good) | 27 (Good) | 23 (Good) | 31 (Good) | 37 (Good) | 32 (Good) | 36 (Good) | 29 (Good) | 30 (Good) | 27 (Good) |
| o3 | 128 (Unhealthy for Sensitive Groups) | 127 (Unhealthy for Sensitive Groups) | 97 (Moderate) | 88 (Moderate) | 87 (Moderate) | 59 (Good) | 59 (Good) | 84 (Moderate) | 101 (Moderate) | 87 (Moderate) | 134 (Unhealthy for Sensitive Groups) | 135 (Unhealthy for Sensitive Groups) | 132 (Unhealthy for Sensitive Groups) | 118 (Moderate) | 110 (Moderate) | 102 (Moderate) | 69 (Good) | 57 (Good) | 62 (Good) | 73 (Moderate) |
| pm10 | 72 (Unhealthy for Sensitive Groups) | 143 (Very Unhealthy) | 64 (Unhealthy for Sensitive Groups) | 51 (Unhealthy for Sensitive Groups) | 140 (Very Unhealthy) | 85 (Unhealthy) | 58 (Unhealthy for Sensitive Groups) | 72 (Unhealthy for Sensitive Groups) | 42 (Moderate) | 24 (Moderate) | 44 (Moderate) | 39 (Moderate) | 69 (Unhealthy for Sensitive Groups) | 106 (Unhealthy) | 113 (Very Unhealthy) | 99 (Unhealthy) | 97 (Unhealthy) | 60 (Unhealthy for Sensitive Groups) | 67 (Unhealthy for Sensitive Groups) | 61 (Unhealthy for Sensitive Groups) |
| so2 | 4.9 (Good) | 8.2 (Good) | 6.7 (Good) | 11 (Good) | 19 (Good) | 13 (Good) | 8.6 (Good) | 5.3 (Good) | 3.8 (Good) | 2.2 (Good) | 2.8 (Good) | 3.9 (Good) | 4.7 (Good) | 5.3 (Good) | 9.1 (Good) | 12 (Good) | 13 (Good) | 14 (Good) | 13 (Good) | 8.5 (Good) |
PM10 6.7 (Good)
particulate matter (PM10) suspended dustPM2,5 1.7 (Good)
particulate matter (PM2.5) dustCO 100 (Good)
carbon monoxide (CO)NO2 7.6 (Good)
nitrogen dioxide (NO2)O3 0.02 (Good)
ozone (O3)SO2 8.6 (Good)
sulfur dioxide (SO2)高新区管委会
| index | 2022-05-27 |
|---|---|
| pm10 | 32 |
| pm25 | 24 |
| co | 468 |
| no2 | 21 |
| o3 | 32 |
| so2 | 4.6 |
高新区管委会

| index | 2020-05 | 2020-04 | 2020-03 | 2020-02 | 2020-01 | 2019-12 | 2019-11 | 2019-10 | 2019-09 | 2019-08 | 2019-07 | 2019-06 | 2019-05 | 2019-04 | 2019-03 | 2019-02 | 2019-01 | 2018-12 | 2018-11 | 2018-10 |
|---|---|---|---|---|---|---|---|---|---|---|---|---|---|---|---|---|---|---|---|---|
| pm25 | 31 | 106 | 38 | 45 | 135 | 80 | 31 | 35 | 20 | 13 | 23 | 18 | 27 | 38 | 61 | 97 | 71 | 29 | 41 | 35 |
| co | 513 | 979 | 605 | 715 | 1 | 949 | 637 | 730 | 580 | 582 | 593 | 502 | 471 | 539 | 826 | 1 | 966 | 843 | 855 | 657 |
| no2 | 24 | 43 | 25 | 22 | 49 | 41 | 29 | 33 | 25 | 17 | 22 | 27 | 23 | 31 | 37 | 32 | 36 | 29 | 30 | 27 |
| o3 | 128 | 127 | 97 | 88 | 87 | 59 | 59 | 84 | 101 | 87 | 134 | 135 | 132 | 118 | 110 | 102 | 69 | 57 | 62 | 73 |
| pm10 | 72 | 143 | 64 | 51 | 140 | 85 | 58 | 72 | 42 | 24 | 44 | 39 | 69 | 106 | 113 | 99 | 97 | 60 | 67 | 61 |
| so2 | 4.9 | 8.2 | 6.7 | 11 | 19 | 13 | 8.6 | 5.3 | 3.8 | 2.2 | 2.8 | 3.9 | 4.7 | 5.3 | 9.1 | 12 | 13 | 14 | 13 | 8.5 |