Air Pollution in Jiaojiamen: Real-time Air Quality Index and smog alert.
Pollution and air quality forecast for Jiaojiamen. Today is Tuesday, June 2, 2026. The following air pollution values have been recorded for Jiaojiamen:- particulate matter (PM10) suspended dust - 179 (Very bad Hazardous)
- particulate matter (PM2.5) dust - 35 (Unhealthy for Sensitive Groups)
- ozone (O3) - 0 (Good)
- nitrogen dioxide (NO2) - 0 (Good)
- sulfur dioxide (SO2) - 0 (Good)

What is the air quality in Jiaojiamen today? Is the air polluted in Jiaojiamen?. Is there smog?
What is the level of PM10 today in Jiaojiamen? (particulate matter (PM10) suspended dust)
The current level of particulate matter PM10 in Jiaojiamen is:
179 (Very bad Hazardous)
The highest PM10 values usually occur in month: 160 (January 2019).
The lowest value of particulate matter PM10 pollution in Jiaojiamen is usually recorded in: August (57).
What is the current level of PM2.5 in Jiaojiamen? (particulate matter (PM2.5) dust)
Today's PM2.5 level is:
35 (Unhealthy for Sensitive Groups)
For comparison, the highest level of PM2.5 in Jiaojiamen in the last 7 days was: 56 (Friday, May 27, 2022) and the lowest: 56 (Friday, May 27, 2022).
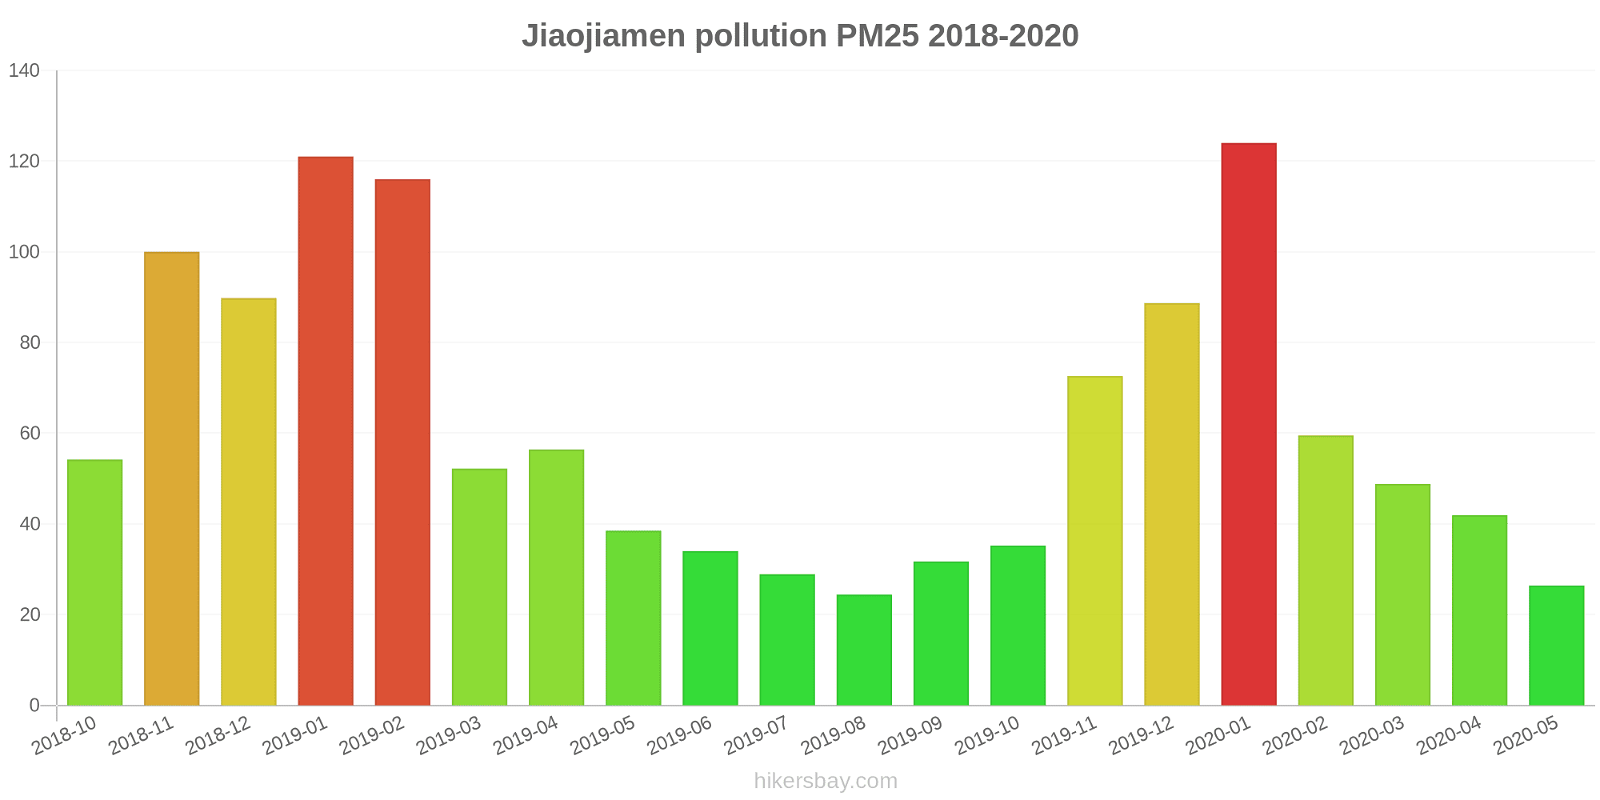
The highest PM2.5 values were recorded: 124 (January 2020).
The lowest level of particulate matter PM2.5 pollution occurs in month: August (24).
How is the O3 level today in Jiaojiamen? (ozone (O3))
0 (Good)
How high is the level of NO2? (nitrogen dioxide (NO2))
0 (Good)
What is the level of SO2 pollution? (sulfur dioxide (SO2))
0 (Good)
Current data Friday, May 27, 2022, 12:00 PM
PM10 179 (Very bad Hazardous)
PM2,5 35 (Unhealthy for Sensitive Groups)
O3 0 (Good)
NO2 0 (Good)
SO2 0 (Good)
Data on air pollution from recent days in Jiaojiamen
index
2022-05-27
pm10
56
Unhealthy for Sensitive Groups
pm25
56
Unhealthy
o3
0
Good
no2
0
Good
so2
0
Good
data source »
Air pollution in Jiaojiamen from October 2018 to May 2020
index
2020-05
2020-04
2020-03
2020-02
2020-01
2019-12
2019-11
2019-10
2019-09
2019-08
2019-07
2019-06
2019-05
2019-04
2019-03
2019-02
2019-01
2018-12
2018-11
2018-10
pm25
26 (Moderate)
42 (Unhealthy for Sensitive Groups)
49 (Unhealthy for Sensitive Groups)
60 (Unhealthy)
124 (Very bad Hazardous)
89 (Very Unhealthy)
73 (Unhealthy)
35 (Unhealthy for Sensitive Groups)
32 (Moderate)
24 (Moderate)
29 (Moderate)
34 (Moderate)
39 (Unhealthy for Sensitive Groups)
56 (Unhealthy)
52 (Unhealthy for Sensitive Groups)
116 (Very bad Hazardous)
121 (Very bad Hazardous)
90 (Very Unhealthy)
100 (Very Unhealthy)
54 (Unhealthy for Sensitive Groups)
co
475 (Good)
606 (Good)
636 (Good)
855 (Good)
1 (Good)
1 (Good)
1 (Good)
740 (Good)
830 (Good)
774 (Good)
730 (Good)
610 (Good)
652 (Good)
876 (Good)
712 (Good)
1 (Good)
1 (Good)
1 (Good)
1 (Good)
831 (Good)
no2
27 (Good)
38 (Good)
37 (Good)
21 (Good)
54 (Moderate)
54 (Moderate)
59 (Moderate)
54 (Moderate)
40 (Good)
32 (Good)
34 (Good)
37 (Good)
43 (Moderate)
46 (Moderate)
49 (Moderate)
38 (Good)
69 (Moderate)
58 (Moderate)
62 (Moderate)
64 (Moderate)
o3
151 (Unhealthy)
131 (Unhealthy for Sensitive Groups)
104 (Moderate)
97 (Moderate)
67 (Good)
55 (Good)
79 (Moderate)
102 (Moderate)
163 (Unhealthy)
156 (Unhealthy)
189 (Very Unhealthy)
184 (Very Unhealthy)
157 (Unhealthy)
125 (Unhealthy for Sensitive Groups)
112 (Moderate)
91 (Moderate)
46 (Good)
39 (Good)
63 (Good)
88 (Moderate)
pm10
79 (Unhealthy for Sensitive Groups)
87 (Unhealthy)
95 (Unhealthy)
69 (Unhealthy for Sensitive Groups)
126 (Very Unhealthy)
109 (Unhealthy)
122 (Very Unhealthy)
87 (Unhealthy)
68 (Unhealthy for Sensitive Groups)
57 (Unhealthy for Sensitive Groups)
68 (Unhealthy for Sensitive Groups)
77 (Unhealthy for Sensitive Groups)
113 (Very Unhealthy)
111 (Very Unhealthy)
104 (Unhealthy)
141 (Very Unhealthy)
160 (Very bad Hazardous)
141 (Very Unhealthy)
156 (Very bad Hazardous)
112 (Very Unhealthy)
so2
6.3 (Good)
9.9 (Good)
8.5 (Good)
6.7 (Good)
8.9 (Good)
11 (Good)
12 (Good)
7.8 (Good)
5.8 (Good)
5.4 (Good)
3.8 (Good)
8.5 (Good)
9.1 (Good)
9.1 (Good)
8.3 (Good)
7.2 (Good)
17 (Good)
19 (Good)
16 (Good)
18 (Good)
data source »
Quality of life in Jiaojiamen
Green and Parks in the City
Jiaojiamen
28%
Mongolia: 27%
Bhutan: 82%
Hong Kong: 52%
Myanmar: 33%
particulate matter PM2.5
Jiaojiamen
78 (Very Unhealthy)
Pleasure of spending time in the city
Jiaojiamen
7.9%
Mongolia: 22%
Bhutan: 61%
Hong Kong: 43%
Myanmar: 24%
particulate matter PM10
Jiaojiamen
140 (Very Unhealthy)
Air Pollution
Jiaojiamen
94%
Mongolia: 87%
Bhutan: 45%
Hong Kong: 67%
Myanmar: 83%
Garbage Disposal
Jiaojiamen
45%
Mongolia: 27%
Bhutan: 47%
Hong Kong: 52%
Myanmar: 12%
Availability and quality of drinking water
Jiaojiamen
28%
Mongolia: 46%
Bhutan: 64%
Hong Kong: 66%
Myanmar: 34%
Cleanliness and tidiness
Jiaojiamen
21%
Mongolia: 29%
Bhutan: 57%
Hong Kong: 54%
Myanmar: 18%
Noise and Light pollution
Jiaojiamen
55%
Mongolia: 48%
Bhutan: 55%
Hong Kong: 66%
Myanmar: 52%
Water Pollution
Jiaojiamen
69%
Mongolia: 68%
Bhutan: 56%
Hong Kong: 53%
Myanmar: 74%
Source: Numbeo
河医大
Friday, May 27, 2022, 12:00 PM
PM10 179 (Very bad Hazardous)
particulate matter (PM10) suspended dust
PM2,5 35 (Unhealthy for Sensitive Groups)
particulate matter (PM2.5) dust
O3 0.04 (Good)
ozone (O3)
NO2 0 (Good)
nitrogen dioxide (NO2)
SO2 0 (Good)
sulfur dioxide (SO2)
河医大
index
2022-05-27
pm10
56
pm25
56
o3
0.03
no2
0
so2
0
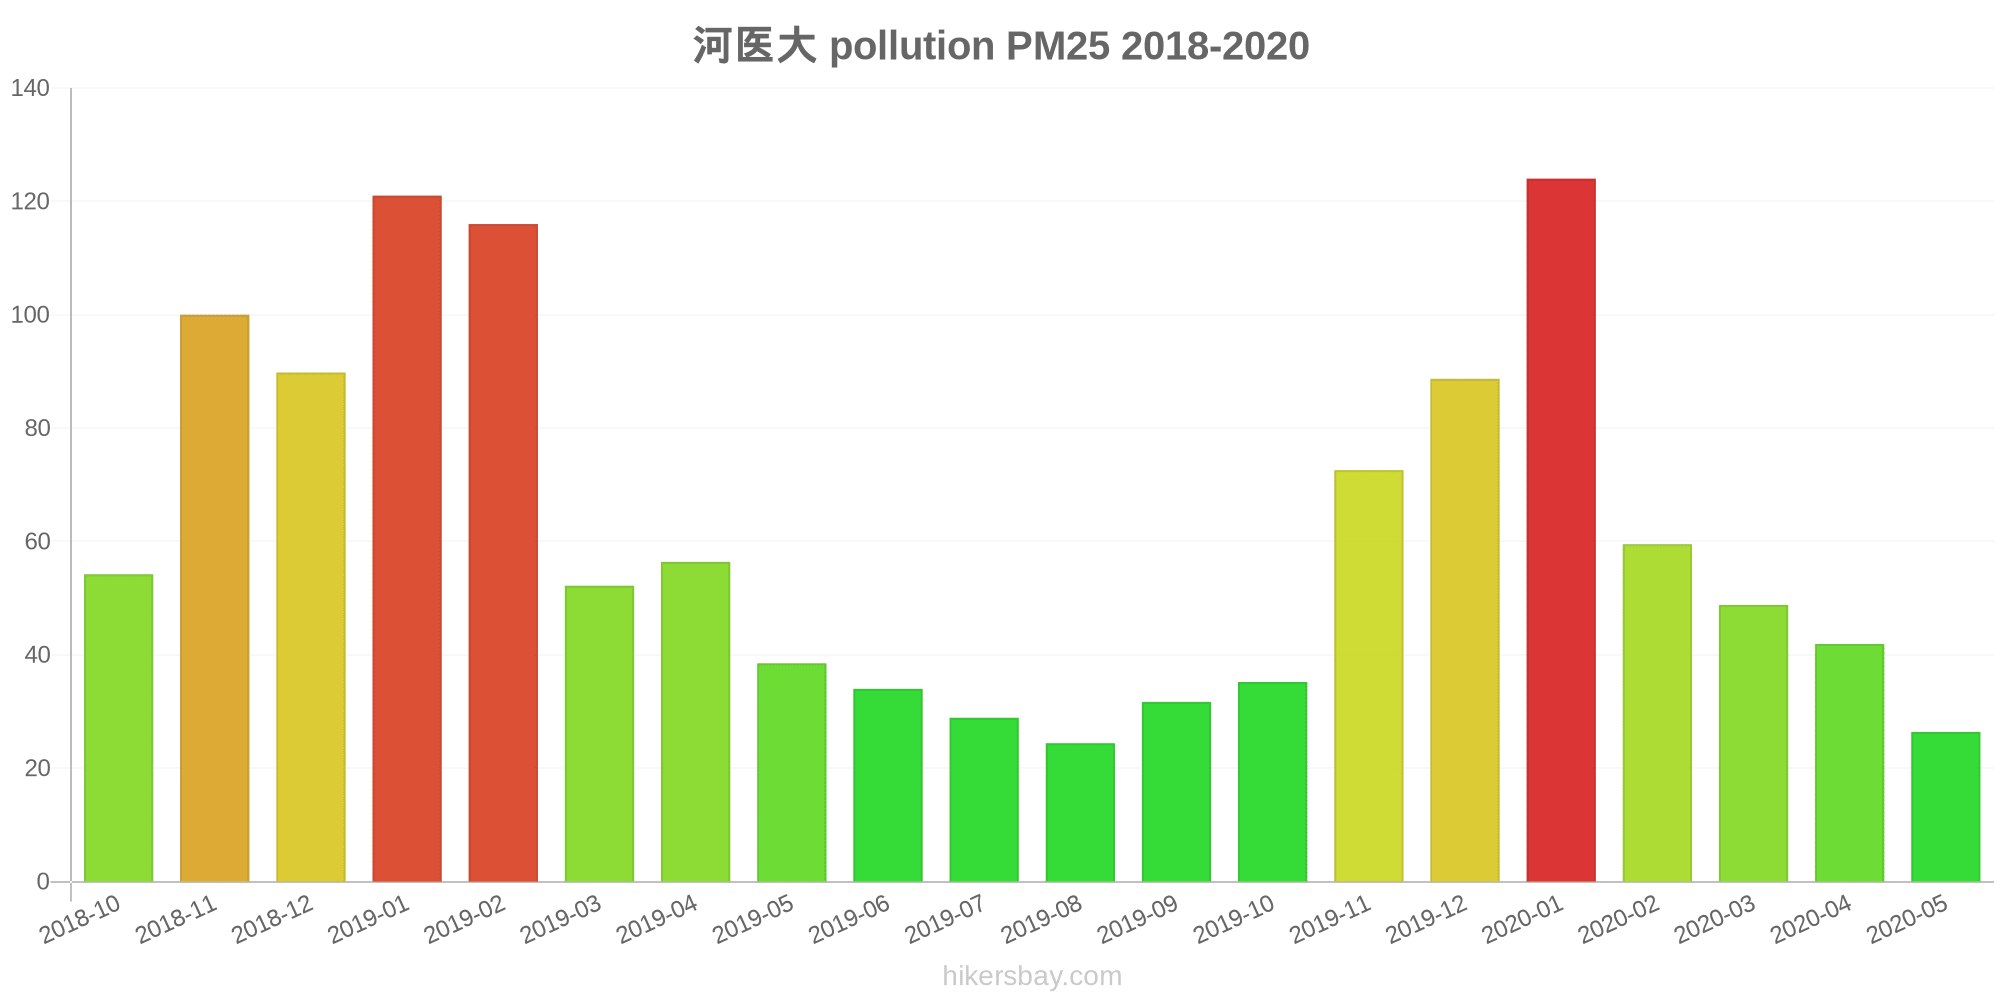
河医大
2018-10 2020-05

index
2020-05
2020-04
2020-03
2020-02
2020-01
2019-12
2019-11
2019-10
2019-09
2019-08
2019-07
2019-06
2019-05
2019-04
2019-03
2019-02
2019-01
2018-12
2018-11
2018-10
pm25
26
42
49
60
124
89
73
35
32
24
29
34
39
56
52
116
121
90
100
54
co
475
606
636
855
1
1
1
740
830
774
730
610
652
876
712
1
1
1
1
831
no2
27
38
37
21
54
54
59
54
40
32
34
37
43
46
49
38
69
58
62
64
o3
151
131
104
97
67
55
79
102
163
156
189
184
157
125
112
91
46
39
63
88
pm10
79
87
95
69
126
109
122
87
68
57
68
77
113
111
104
141
160
141
156
112
so2
6.3
9.9
8.5
6.7
8.9
11
12
7.8
5.8
5.4
3.8
8.5
9.1
9.1
8.3
7.2
17
19
16
18
* Pollution data source:
https://openaq.org
(ChinaAQIData)
The data is licensed under CC-By 4.0
PM10 179 (Very bad Hazardous)
PM2,5 35 (Unhealthy for Sensitive Groups)
O3 0 (Good)
NO2 0 (Good)
SO2 0 (Good)
Data on air pollution from recent days in Jiaojiamen
| index | 2022-05-27 |
|---|---|
| pm10 | 56 Unhealthy for Sensitive Groups |
| pm25 | 56 Unhealthy |
| o3 | 0 Good |
| no2 | 0 Good |
| so2 | 0 Good |

| index | 2020-05 | 2020-04 | 2020-03 | 2020-02 | 2020-01 | 2019-12 | 2019-11 | 2019-10 | 2019-09 | 2019-08 | 2019-07 | 2019-06 | 2019-05 | 2019-04 | 2019-03 | 2019-02 | 2019-01 | 2018-12 | 2018-11 | 2018-10 |
|---|---|---|---|---|---|---|---|---|---|---|---|---|---|---|---|---|---|---|---|---|
| pm25 | 26 (Moderate) | 42 (Unhealthy for Sensitive Groups) | 49 (Unhealthy for Sensitive Groups) | 60 (Unhealthy) | 124 (Very bad Hazardous) | 89 (Very Unhealthy) | 73 (Unhealthy) | 35 (Unhealthy for Sensitive Groups) | 32 (Moderate) | 24 (Moderate) | 29 (Moderate) | 34 (Moderate) | 39 (Unhealthy for Sensitive Groups) | 56 (Unhealthy) | 52 (Unhealthy for Sensitive Groups) | 116 (Very bad Hazardous) | 121 (Very bad Hazardous) | 90 (Very Unhealthy) | 100 (Very Unhealthy) | 54 (Unhealthy for Sensitive Groups) |
| co | 475 (Good) | 606 (Good) | 636 (Good) | 855 (Good) | 1 (Good) | 1 (Good) | 1 (Good) | 740 (Good) | 830 (Good) | 774 (Good) | 730 (Good) | 610 (Good) | 652 (Good) | 876 (Good) | 712 (Good) | 1 (Good) | 1 (Good) | 1 (Good) | 1 (Good) | 831 (Good) |
| no2 | 27 (Good) | 38 (Good) | 37 (Good) | 21 (Good) | 54 (Moderate) | 54 (Moderate) | 59 (Moderate) | 54 (Moderate) | 40 (Good) | 32 (Good) | 34 (Good) | 37 (Good) | 43 (Moderate) | 46 (Moderate) | 49 (Moderate) | 38 (Good) | 69 (Moderate) | 58 (Moderate) | 62 (Moderate) | 64 (Moderate) |
| o3 | 151 (Unhealthy) | 131 (Unhealthy for Sensitive Groups) | 104 (Moderate) | 97 (Moderate) | 67 (Good) | 55 (Good) | 79 (Moderate) | 102 (Moderate) | 163 (Unhealthy) | 156 (Unhealthy) | 189 (Very Unhealthy) | 184 (Very Unhealthy) | 157 (Unhealthy) | 125 (Unhealthy for Sensitive Groups) | 112 (Moderate) | 91 (Moderate) | 46 (Good) | 39 (Good) | 63 (Good) | 88 (Moderate) |
| pm10 | 79 (Unhealthy for Sensitive Groups) | 87 (Unhealthy) | 95 (Unhealthy) | 69 (Unhealthy for Sensitive Groups) | 126 (Very Unhealthy) | 109 (Unhealthy) | 122 (Very Unhealthy) | 87 (Unhealthy) | 68 (Unhealthy for Sensitive Groups) | 57 (Unhealthy for Sensitive Groups) | 68 (Unhealthy for Sensitive Groups) | 77 (Unhealthy for Sensitive Groups) | 113 (Very Unhealthy) | 111 (Very Unhealthy) | 104 (Unhealthy) | 141 (Very Unhealthy) | 160 (Very bad Hazardous) | 141 (Very Unhealthy) | 156 (Very bad Hazardous) | 112 (Very Unhealthy) |
| so2 | 6.3 (Good) | 9.9 (Good) | 8.5 (Good) | 6.7 (Good) | 8.9 (Good) | 11 (Good) | 12 (Good) | 7.8 (Good) | 5.8 (Good) | 5.4 (Good) | 3.8 (Good) | 8.5 (Good) | 9.1 (Good) | 9.1 (Good) | 8.3 (Good) | 7.2 (Good) | 17 (Good) | 19 (Good) | 16 (Good) | 18 (Good) |
Green and Parks in the City
Jiaojiamen 28%
Mongolia: 27% Bhutan: 82% Hong Kong: 52% Myanmar: 33%particulate matter PM2.5
Jiaojiamen 78 (Very Unhealthy)
Pleasure of spending time in the city
Jiaojiamen 7.9%
Mongolia: 22% Bhutan: 61% Hong Kong: 43% Myanmar: 24%particulate matter PM10
Jiaojiamen 140 (Very Unhealthy)
Air Pollution
Jiaojiamen 94%
Mongolia: 87% Bhutan: 45% Hong Kong: 67% Myanmar: 83%Garbage Disposal
Jiaojiamen 45%
Mongolia: 27% Bhutan: 47% Hong Kong: 52% Myanmar: 12%Availability and quality of drinking water
Jiaojiamen 28%
Mongolia: 46% Bhutan: 64% Hong Kong: 66% Myanmar: 34%Cleanliness and tidiness
Jiaojiamen 21%
Mongolia: 29% Bhutan: 57% Hong Kong: 54% Myanmar: 18%Noise and Light pollution
Jiaojiamen 55%
Mongolia: 48% Bhutan: 55% Hong Kong: 66% Myanmar: 52%Water Pollution
Jiaojiamen 69%
Mongolia: 68% Bhutan: 56% Hong Kong: 53% Myanmar: 74%PM10 179 (Very bad Hazardous)
particulate matter (PM10) suspended dustPM2,5 35 (Unhealthy for Sensitive Groups)
particulate matter (PM2.5) dustO3 0.04 (Good)
ozone (O3)NO2 0 (Good)
nitrogen dioxide (NO2)SO2 0 (Good)
sulfur dioxide (SO2)河医大
| index | 2022-05-27 |
|---|---|
| pm10 | 56 |
| pm25 | 56 |
| o3 | 0.03 |
| no2 | 0 |
| so2 | 0 |
河医大
| index | 2020-05 | 2020-04 | 2020-03 | 2020-02 | 2020-01 | 2019-12 | 2019-11 | 2019-10 | 2019-09 | 2019-08 | 2019-07 | 2019-06 | 2019-05 | 2019-04 | 2019-03 | 2019-02 | 2019-01 | 2018-12 | 2018-11 | 2018-10 |
|---|---|---|---|---|---|---|---|---|---|---|---|---|---|---|---|---|---|---|---|---|
| pm25 | 26 | 42 | 49 | 60 | 124 | 89 | 73 | 35 | 32 | 24 | 29 | 34 | 39 | 56 | 52 | 116 | 121 | 90 | 100 | 54 |
| co | 475 | 606 | 636 | 855 | 1 | 1 | 1 | 740 | 830 | 774 | 730 | 610 | 652 | 876 | 712 | 1 | 1 | 1 | 1 | 831 |
| no2 | 27 | 38 | 37 | 21 | 54 | 54 | 59 | 54 | 40 | 32 | 34 | 37 | 43 | 46 | 49 | 38 | 69 | 58 | 62 | 64 |
| o3 | 151 | 131 | 104 | 97 | 67 | 55 | 79 | 102 | 163 | 156 | 189 | 184 | 157 | 125 | 112 | 91 | 46 | 39 | 63 | 88 |
| pm10 | 79 | 87 | 95 | 69 | 126 | 109 | 122 | 87 | 68 | 57 | 68 | 77 | 113 | 111 | 104 | 141 | 160 | 141 | 156 | 112 |
| so2 | 6.3 | 9.9 | 8.5 | 6.7 | 8.9 | 11 | 12 | 7.8 | 5.8 | 5.4 | 3.8 | 8.5 | 9.1 | 9.1 | 8.3 | 7.2 | 17 | 19 | 16 | 18 |