Air Pollution in Zhangjing: Real-time Air Quality Index and smog alert.
Pollution and air quality forecast for Zhangjing. Today is Tuesday, June 2, 2026. The following air pollution values have been recorded for Zhangjing:- particulate matter (PM10) suspended dust - 179 (Very bad Hazardous)
- particulate matter (PM2.5) dust - 35 (Unhealthy for Sensitive Groups)
- ozone (O3) - 0 (Good)
- nitrogen dioxide (NO2) - 0 (Good)
- sulfur dioxide (SO2) - 0 (Good)

What is the air quality in Zhangjing today? Is the air polluted in Zhangjing?. Is there smog?
What is the level of PM10 today in Zhangjing? (particulate matter (PM10) suspended dust)
The current level of particulate matter PM10 in Zhangjing is:
179 (Very bad Hazardous)
The highest PM10 values usually occur in month: 196 (January 2019).
The lowest value of particulate matter PM10 pollution in Zhangjing is usually recorded in: August (48).
What is the current level of PM2.5 in Zhangjing? (particulate matter (PM2.5) dust)
Today's PM2.5 level is:
35 (Unhealthy for Sensitive Groups)
For comparison, the highest level of PM2.5 in Zhangjing in the last 7 days was: 56 (Friday, May 27, 2022) and the lowest: 56 (Friday, May 27, 2022).
The highest PM2.5 values were recorded: 146 (January 2019).
The lowest level of particulate matter PM2.5 pollution occurs in month: July (24).
How is the O3 level today in Zhangjing? (ozone (O3))
0 (Good)
How high is the level of NO2? (nitrogen dioxide (NO2))
0 (Good)
What is the level of SO2 pollution? (sulfur dioxide (SO2))
0 (Good)
Current data Friday, May 27, 2022, 12:00 PM
PM10 179 (Very bad Hazardous)
PM2,5 35 (Unhealthy for Sensitive Groups)
O3 0 (Good)
NO2 0 (Good)
SO2 0 (Good)
Data on air pollution from recent days in Zhangjing
index
2022-05-27
pm10
56
Unhealthy for Sensitive Groups
pm25
56
Unhealthy
o3
0
Good
no2
0
Good
so2
0
Good
data source »
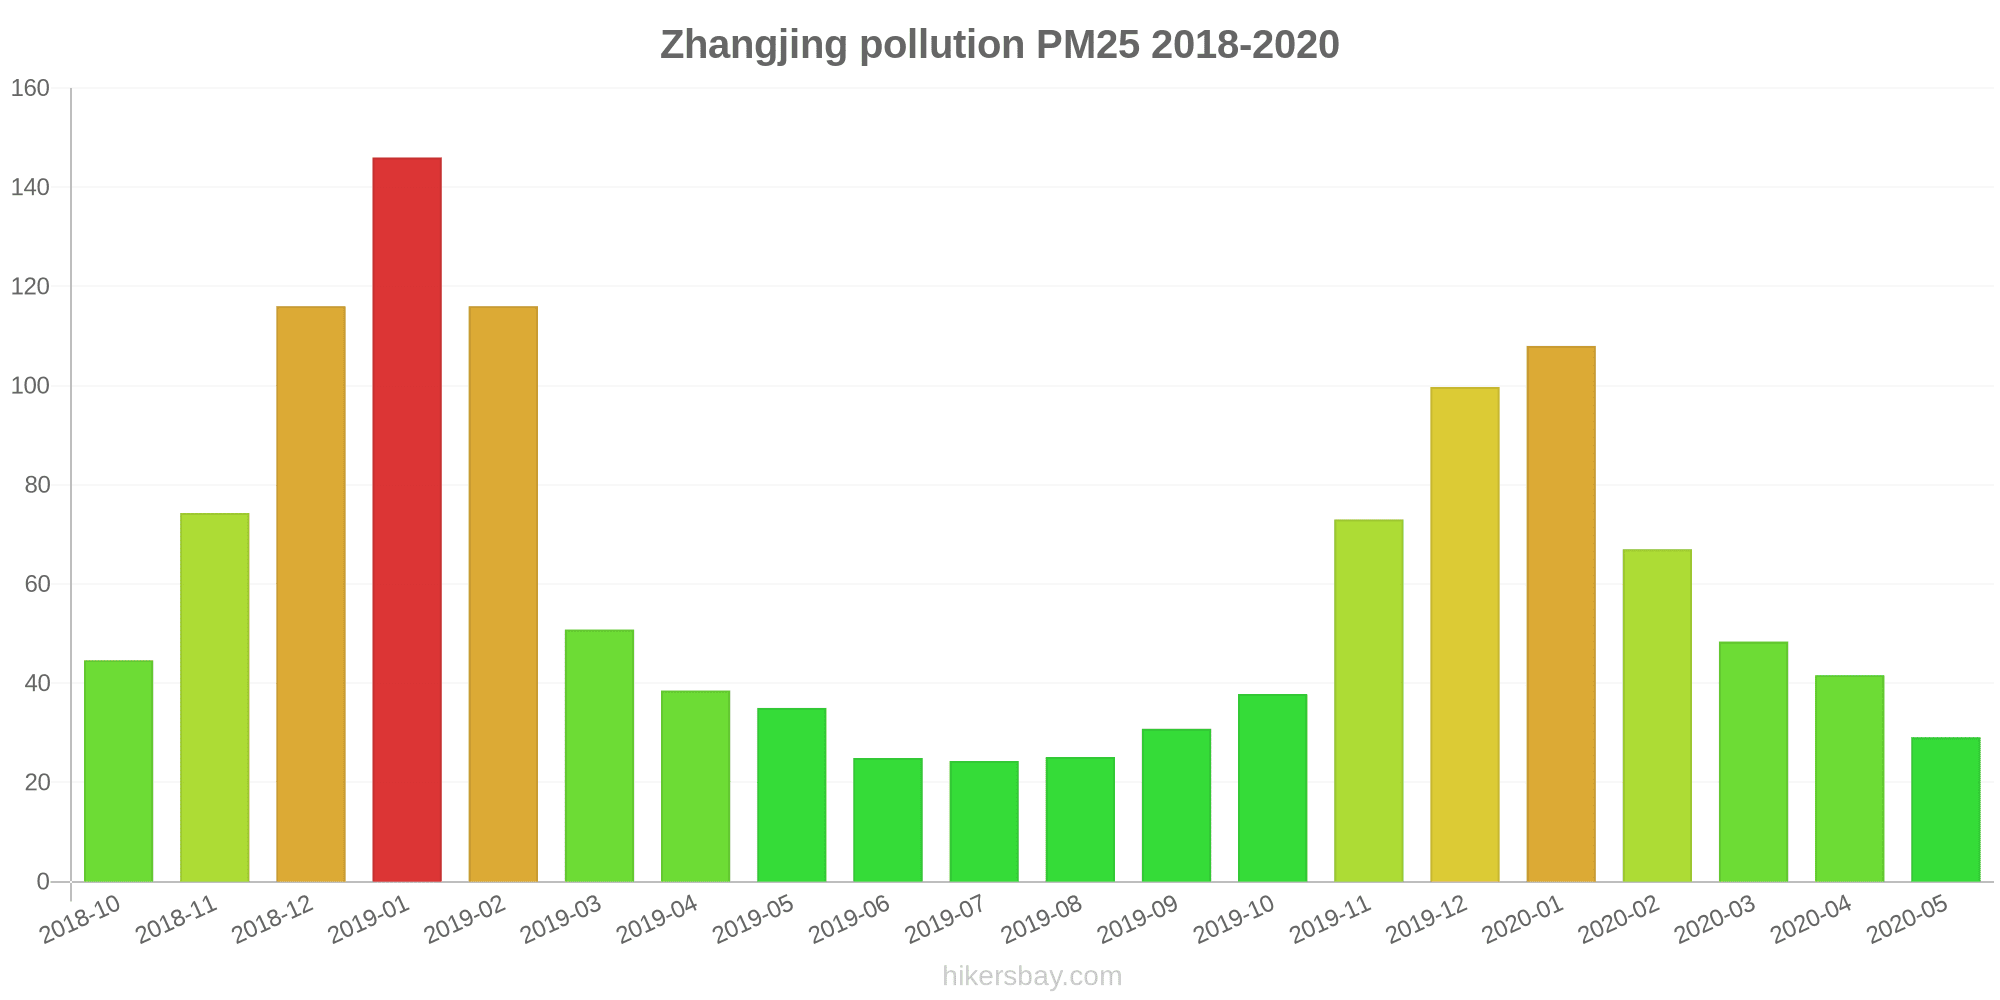
Air pollution in Zhangjing from October 2018 to May 2020

index
2020-05
2020-04
2020-03
2020-02
2020-01
2019-12
2019-11
2019-10
2019-09
2019-08
2019-07
2019-06
2019-05
2019-04
2019-03
2019-02
2019-01
2018-12
2018-11
2018-10
pm25
29 (Moderate)
42 (Unhealthy for Sensitive Groups)
48 (Unhealthy for Sensitive Groups)
67 (Unhealthy)
108 (Very Unhealthy)
100 (Very Unhealthy)
73 (Unhealthy)
38 (Unhealthy for Sensitive Groups)
31 (Moderate)
25 (Moderate)
24 (Moderate)
25 (Moderate)
35 (Unhealthy for Sensitive Groups)
39 (Unhealthy for Sensitive Groups)
51 (Unhealthy for Sensitive Groups)
116 (Very bad Hazardous)
146 (Very bad Hazardous)
116 (Very bad Hazardous)
74 (Unhealthy)
45 (Unhealthy for Sensitive Groups)
co
646 (Good)
694 (Good)
742 (Good)
913 (Good)
1 (Good)
1 (Good)
936 (Good)
1 (Good)
642 (Good)
870 (Good)
723 (Good)
705 (Good)
798 (Good)
906 (Good)
880 (Good)
1 (Good)
1 (Good)
1 (Good)
1 (Good)
870 (Good)
no2
18 (Good)
30 (Good)
23 (Good)
12 (Good)
31 (Good)
41 (Moderate)
39 (Good)
32 (Good)
23 (Good)
16 (Good)
20 (Good)
20 (Good)
22 (Good)
24 (Good)
33 (Good)
26 (Good)
41 (Moderate)
42 (Moderate)
39 (Good)
43 (Moderate)
o3
139 (Unhealthy for Sensitive Groups)
134 (Unhealthy for Sensitive Groups)
112 (Moderate)
89 (Moderate)
78 (Moderate)
64 (Good)
100 (Moderate)
111 (Moderate)
164 (Unhealthy)
170 (Unhealthy)
173 (Unhealthy)
180 (Very Unhealthy)
157 (Unhealthy)
119 (Moderate)
109 (Moderate)
74 (Moderate)
56 (Good)
48 (Good)
81 (Moderate)
115 (Moderate)
pm10
64 (Unhealthy for Sensitive Groups)
83 (Unhealthy)
94 (Unhealthy)
86 (Unhealthy)
133 (Very Unhealthy)
142 (Very Unhealthy)
123 (Very Unhealthy)
78 (Unhealthy for Sensitive Groups)
60 (Unhealthy for Sensitive Groups)
48 (Moderate)
51 (Unhealthy for Sensitive Groups)
65 (Unhealthy for Sensitive Groups)
103 (Unhealthy)
83 (Unhealthy)
93 (Unhealthy)
142 (Very Unhealthy)
196 (Very bad Hazardous)
178 (Very bad Hazardous)
138 (Very Unhealthy)
102 (Unhealthy)
so2
11 (Good)
11 (Good)
7.8 (Good)
8.6 (Good)
9.8 (Good)
12 (Good)
11 (Good)
9.2 (Good)
7.8 (Good)
5.3 (Good)
5.2 (Good)
4.2 (Good)
5.1 (Good)
9.4 (Good)
7.7 (Good)
6 (Good)
7.5 (Good)
9.9 (Good)
6.8 (Good)
7.8 (Good)
data source »
理工学院
Friday, May 27, 2022, 12:00 PM
PM10 179 (Very bad Hazardous)
particulate matter (PM10) suspended dust
PM2,5 35 (Unhealthy for Sensitive Groups)
particulate matter (PM2.5) dust
O3 0.04 (Good)
ozone (O3)
NO2 0 (Good)
nitrogen dioxide (NO2)
SO2 0 (Good)
sulfur dioxide (SO2)
理工学院
index
2022-05-27
pm10
56
pm25
56
o3
0.03
no2
0
so2
0
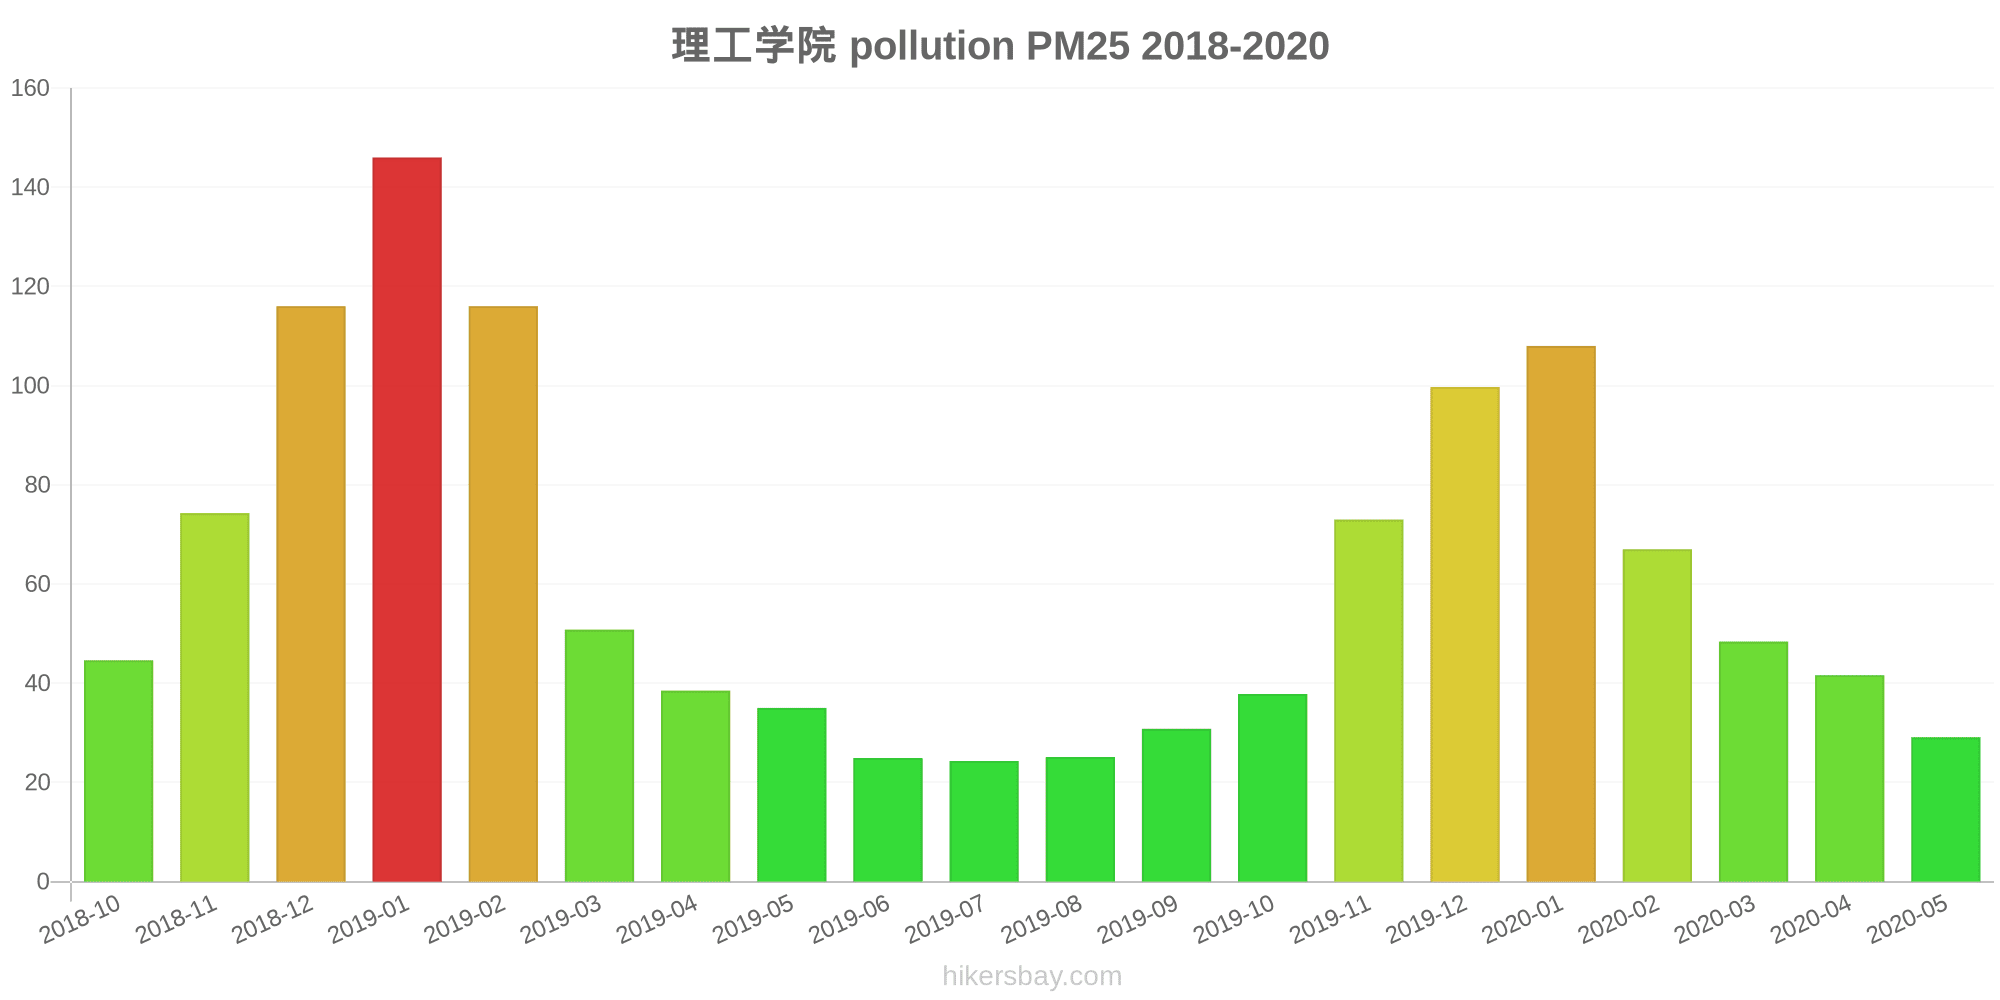
理工学院
2018-10 2020-05

index
2020-05
2020-04
2020-03
2020-02
2020-01
2019-12
2019-11
2019-10
2019-09
2019-08
2019-07
2019-06
2019-05
2019-04
2019-03
2019-02
2019-01
2018-12
2018-11
2018-10
pm25
29
42
48
67
108
100
73
38
31
25
24
25
35
39
51
116
146
116
74
45
co
646
694
742
913
1
1
936
1
642
870
723
705
798
906
880
1
1
1
1
870
no2
18
30
23
12
31
41
39
32
23
16
20
20
22
24
33
26
41
42
39
43
o3
139
134
112
89
78
64
100
111
164
170
173
180
157
119
109
74
56
48
81
115
pm10
64
83
94
86
133
142
123
78
60
48
51
65
103
83
93
142
196
178
138
102
so2
11
11
7.8
8.6
9.8
12
11
9.2
7.8
5.3
5.2
4.2
5.1
9.4
7.7
6
7.5
9.9
6.8
7.8
* Pollution data source:
https://openaq.org
(ChinaAQIData)
The data is licensed under CC-By 4.0
PM10 179 (Very bad Hazardous)
PM2,5 35 (Unhealthy for Sensitive Groups)
O3 0 (Good)
NO2 0 (Good)
SO2 0 (Good)
Data on air pollution from recent days in Zhangjing
| index | 2022-05-27 |
|---|---|
| pm10 | 56 Unhealthy for Sensitive Groups |
| pm25 | 56 Unhealthy |
| o3 | 0 Good |
| no2 | 0 Good |
| so2 | 0 Good |
| index | 2020-05 | 2020-04 | 2020-03 | 2020-02 | 2020-01 | 2019-12 | 2019-11 | 2019-10 | 2019-09 | 2019-08 | 2019-07 | 2019-06 | 2019-05 | 2019-04 | 2019-03 | 2019-02 | 2019-01 | 2018-12 | 2018-11 | 2018-10 |
|---|---|---|---|---|---|---|---|---|---|---|---|---|---|---|---|---|---|---|---|---|
| pm25 | 29 (Moderate) | 42 (Unhealthy for Sensitive Groups) | 48 (Unhealthy for Sensitive Groups) | 67 (Unhealthy) | 108 (Very Unhealthy) | 100 (Very Unhealthy) | 73 (Unhealthy) | 38 (Unhealthy for Sensitive Groups) | 31 (Moderate) | 25 (Moderate) | 24 (Moderate) | 25 (Moderate) | 35 (Unhealthy for Sensitive Groups) | 39 (Unhealthy for Sensitive Groups) | 51 (Unhealthy for Sensitive Groups) | 116 (Very bad Hazardous) | 146 (Very bad Hazardous) | 116 (Very bad Hazardous) | 74 (Unhealthy) | 45 (Unhealthy for Sensitive Groups) |
| co | 646 (Good) | 694 (Good) | 742 (Good) | 913 (Good) | 1 (Good) | 1 (Good) | 936 (Good) | 1 (Good) | 642 (Good) | 870 (Good) | 723 (Good) | 705 (Good) | 798 (Good) | 906 (Good) | 880 (Good) | 1 (Good) | 1 (Good) | 1 (Good) | 1 (Good) | 870 (Good) |
| no2 | 18 (Good) | 30 (Good) | 23 (Good) | 12 (Good) | 31 (Good) | 41 (Moderate) | 39 (Good) | 32 (Good) | 23 (Good) | 16 (Good) | 20 (Good) | 20 (Good) | 22 (Good) | 24 (Good) | 33 (Good) | 26 (Good) | 41 (Moderate) | 42 (Moderate) | 39 (Good) | 43 (Moderate) |
| o3 | 139 (Unhealthy for Sensitive Groups) | 134 (Unhealthy for Sensitive Groups) | 112 (Moderate) | 89 (Moderate) | 78 (Moderate) | 64 (Good) | 100 (Moderate) | 111 (Moderate) | 164 (Unhealthy) | 170 (Unhealthy) | 173 (Unhealthy) | 180 (Very Unhealthy) | 157 (Unhealthy) | 119 (Moderate) | 109 (Moderate) | 74 (Moderate) | 56 (Good) | 48 (Good) | 81 (Moderate) | 115 (Moderate) |
| pm10 | 64 (Unhealthy for Sensitive Groups) | 83 (Unhealthy) | 94 (Unhealthy) | 86 (Unhealthy) | 133 (Very Unhealthy) | 142 (Very Unhealthy) | 123 (Very Unhealthy) | 78 (Unhealthy for Sensitive Groups) | 60 (Unhealthy for Sensitive Groups) | 48 (Moderate) | 51 (Unhealthy for Sensitive Groups) | 65 (Unhealthy for Sensitive Groups) | 103 (Unhealthy) | 83 (Unhealthy) | 93 (Unhealthy) | 142 (Very Unhealthy) | 196 (Very bad Hazardous) | 178 (Very bad Hazardous) | 138 (Very Unhealthy) | 102 (Unhealthy) |
| so2 | 11 (Good) | 11 (Good) | 7.8 (Good) | 8.6 (Good) | 9.8 (Good) | 12 (Good) | 11 (Good) | 9.2 (Good) | 7.8 (Good) | 5.3 (Good) | 5.2 (Good) | 4.2 (Good) | 5.1 (Good) | 9.4 (Good) | 7.7 (Good) | 6 (Good) | 7.5 (Good) | 9.9 (Good) | 6.8 (Good) | 7.8 (Good) |
PM10 179 (Very bad Hazardous)
particulate matter (PM10) suspended dustPM2,5 35 (Unhealthy for Sensitive Groups)
particulate matter (PM2.5) dustO3 0.04 (Good)
ozone (O3)NO2 0 (Good)
nitrogen dioxide (NO2)SO2 0 (Good)
sulfur dioxide (SO2)理工学院
| index | 2022-05-27 |
|---|---|
| pm10 | 56 |
| pm25 | 56 |
| o3 | 0.03 |
| no2 | 0 |
| so2 | 0 |
理工学院
| index | 2020-05 | 2020-04 | 2020-03 | 2020-02 | 2020-01 | 2019-12 | 2019-11 | 2019-10 | 2019-09 | 2019-08 | 2019-07 | 2019-06 | 2019-05 | 2019-04 | 2019-03 | 2019-02 | 2019-01 | 2018-12 | 2018-11 | 2018-10 |
|---|---|---|---|---|---|---|---|---|---|---|---|---|---|---|---|---|---|---|---|---|
| pm25 | 29 | 42 | 48 | 67 | 108 | 100 | 73 | 38 | 31 | 25 | 24 | 25 | 35 | 39 | 51 | 116 | 146 | 116 | 74 | 45 |
| co | 646 | 694 | 742 | 913 | 1 | 1 | 936 | 1 | 642 | 870 | 723 | 705 | 798 | 906 | 880 | 1 | 1 | 1 | 1 | 870 |
| no2 | 18 | 30 | 23 | 12 | 31 | 41 | 39 | 32 | 23 | 16 | 20 | 20 | 22 | 24 | 33 | 26 | 41 | 42 | 39 | 43 |
| o3 | 139 | 134 | 112 | 89 | 78 | 64 | 100 | 111 | 164 | 170 | 173 | 180 | 157 | 119 | 109 | 74 | 56 | 48 | 81 | 115 |
| pm10 | 64 | 83 | 94 | 86 | 133 | 142 | 123 | 78 | 60 | 48 | 51 | 65 | 103 | 83 | 93 | 142 | 196 | 178 | 138 | 102 |
| so2 | 11 | 11 | 7.8 | 8.6 | 9.8 | 12 | 11 | 9.2 | 7.8 | 5.3 | 5.2 | 4.2 | 5.1 | 9.4 | 7.7 | 6 | 7.5 | 9.9 | 6.8 | 7.8 |