Air Pollution in Yuguangcun: Real-time Air Quality Index and smog alert.
Pollution and air quality forecast for Yuguangcun. Today is Tuesday, June 16, 2026. The following air pollution values have been recorded for Yuguangcun:- particulate matter (PM10) suspended dust - 7 (Good)
- particulate matter (PM2.5) dust - 2 (Good)
- carbon monoxide (CO) - 100 (Good)
- nitrogen dioxide (NO2) - 8 (Good)
- ozone (O3) - 0 (Good)
- sulfur dioxide (SO2) - 9 (Good)

What is the air quality in Yuguangcun today? Is the air polluted in Yuguangcun?. Is there smog?
What is the level of PM10 today in Yuguangcun? (particulate matter (PM10) suspended dust)
The current level of particulate matter PM10 in Yuguangcun is:
7 (Good)
The highest PM10 values usually occur in month: 79 (November 2019).
The lowest value of particulate matter PM10 pollution in Yuguangcun is usually recorded in: June (32).
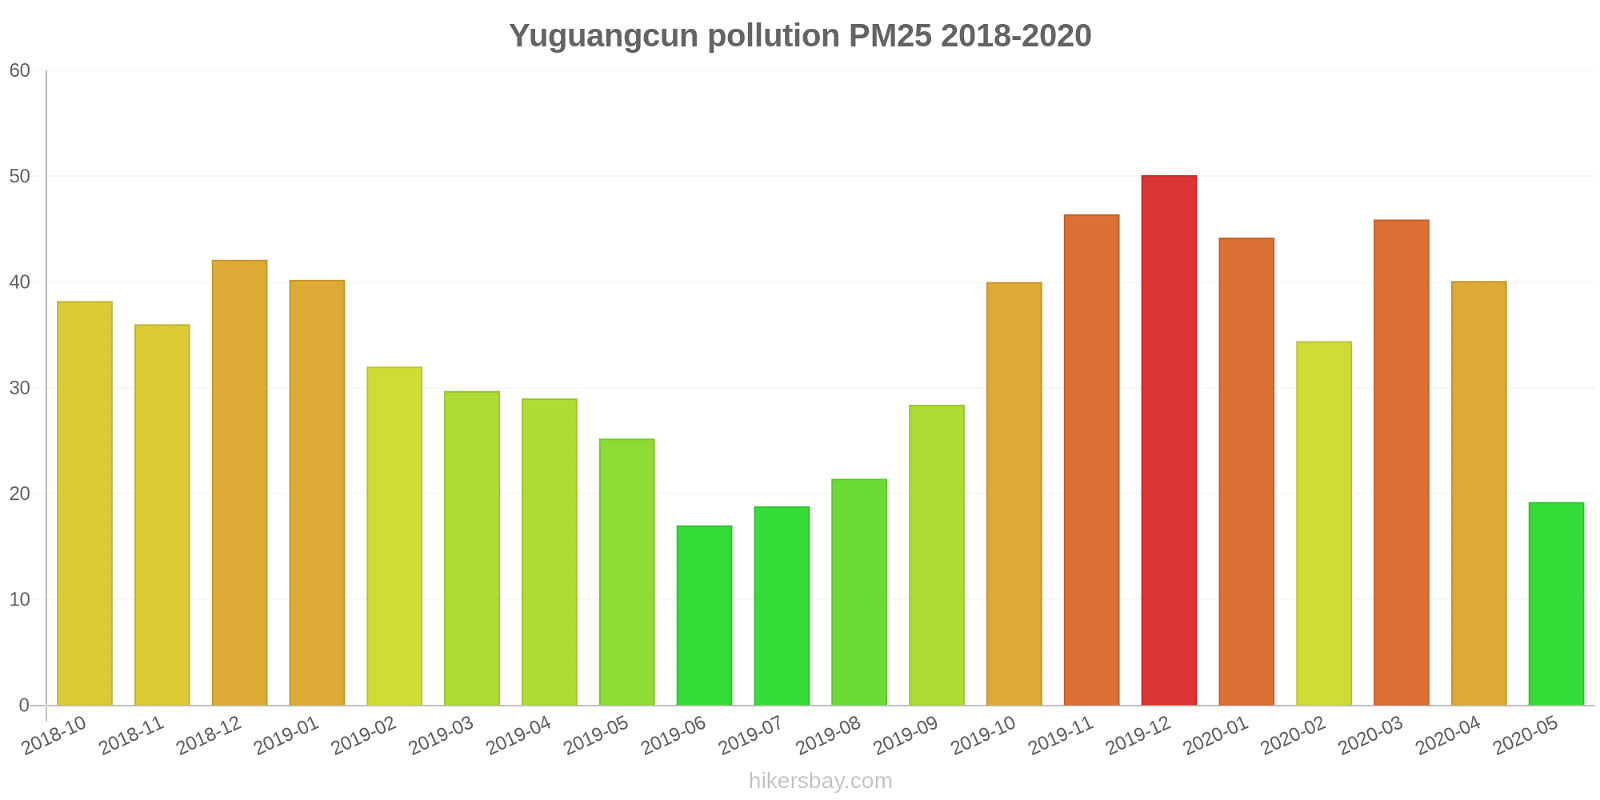
What is the current level of PM2.5 in Yuguangcun? (particulate matter (PM2.5) dust)
Today's PM2.5 level is:
2 (Good)
For comparison, the highest level of PM2.5 in Yuguangcun in the last 7 days was: 24 (Friday, May 27, 2022) and the lowest: 24 (Friday, May 27, 2022).
The highest PM2.5 values were recorded: 50 (December 2019).
The lowest level of particulate matter PM2.5 pollution occurs in month: June (17).
How high is the CO level? (carbon monoxide (CO))
100 (Good)
How high is the level of NO2? (nitrogen dioxide (NO2))
8 (Good)
How is the O3 level today in Yuguangcun? (ozone (O3))
0 (Good)
What is the level of SO2 pollution? (sulfur dioxide (SO2))
9 (Good)
Current data Friday, May 27, 2022, 12:00 PM
PM10 7 (Good)
PM2,5 2 (Good)
CO 100 (Good)
NO2 8 (Good)
O3 0 (Good)
SO2 9 (Good)
Data on air pollution from recent days in Yuguangcun
index
2022-05-27
pm10
32
Moderate
pm25
24
Moderate
co
468
Good
no2
21
Good
o3
32
Good
so2
5
Good
data source »
Air pollution in Yuguangcun from October 2018 to May 2020
index
2020-05
2020-04
2020-03
2020-02
2020-01
2019-12
2019-11
2019-10
2019-09
2019-08
2019-07
2019-06
2019-05
2019-04
2019-03
2019-02
2019-01
2018-12
2018-11
2018-10
pm25
19 (Moderate)
40 (Unhealthy for Sensitive Groups)
46 (Unhealthy for Sensitive Groups)
34 (Moderate)
44 (Unhealthy for Sensitive Groups)
50 (Unhealthy for Sensitive Groups)
46 (Unhealthy for Sensitive Groups)
40 (Unhealthy for Sensitive Groups)
28 (Moderate)
21 (Moderate)
19 (Moderate)
17 (Moderate)
25 (Moderate)
29 (Moderate)
30 (Moderate)
32 (Moderate)
40 (Unhealthy for Sensitive Groups)
42 (Unhealthy for Sensitive Groups)
36 (Unhealthy for Sensitive Groups)
38 (Unhealthy for Sensitive Groups)
co
632 (Good)
683 (Good)
784 (Good)
666 (Good)
882 (Good)
826 (Good)
765 (Good)
841 (Good)
763 (Good)
652 (Good)
634 (Good)
663 (Good)
730 (Good)
860 (Good)
881 (Good)
919 (Good)
1 (Good)
934 (Good)
823 (Good)
863 (Good)
no2
13 (Good)
24 (Good)
23 (Good)
12 (Good)
20 (Good)
33 (Good)
27 (Good)
20 (Good)
20 (Good)
18 (Good)
19 (Good)
20 (Good)
18 (Good)
24 (Good)
29 (Good)
18 (Good)
36 (Good)
32 (Good)
28 (Good)
27 (Good)
o3
116 (Moderate)
132 (Unhealthy for Sensitive Groups)
107 (Moderate)
110 (Moderate)
116 (Moderate)
118 (Moderate)
148 (Unhealthy for Sensitive Groups)
147 (Unhealthy for Sensitive Groups)
151 (Unhealthy)
116 (Moderate)
100 (Moderate)
95 (Moderate)
120 (Unhealthy for Sensitive Groups)
119 (Moderate)
118 (Moderate)
101 (Moderate)
111 (Moderate)
85 (Moderate)
113 (Moderate)
142 (Unhealthy for Sensitive Groups)
pm10
41 (Moderate)
55 (Unhealthy for Sensitive Groups)
54 (Unhealthy for Sensitive Groups)
41 (Moderate)
51 (Unhealthy for Sensitive Groups)
70 (Unhealthy for Sensitive Groups)
79 (Unhealthy for Sensitive Groups)
64 (Unhealthy for Sensitive Groups)
50 (Unhealthy for Sensitive Groups)
37 (Moderate)
36 (Moderate)
32 (Moderate)
45 (Moderate)
51 (Unhealthy for Sensitive Groups)
53 (Unhealthy for Sensitive Groups)
49 (Moderate)
66 (Unhealthy for Sensitive Groups)
63 (Unhealthy for Sensitive Groups)
56 (Unhealthy for Sensitive Groups)
61 (Unhealthy for Sensitive Groups)
so2
6.8 (Good)
9.2 (Good)
8.7 (Good)
9.8 (Good)
11 (Good)
16 (Good)
16 (Good)
15 (Good)
13 (Good)
10 (Good)
9 (Good)
8.7 (Good)
10 (Good)
11 (Good)
12 (Good)
8.4 (Good)
12 (Good)
13 (Good)
13 (Good)
15 (Good)
data source »
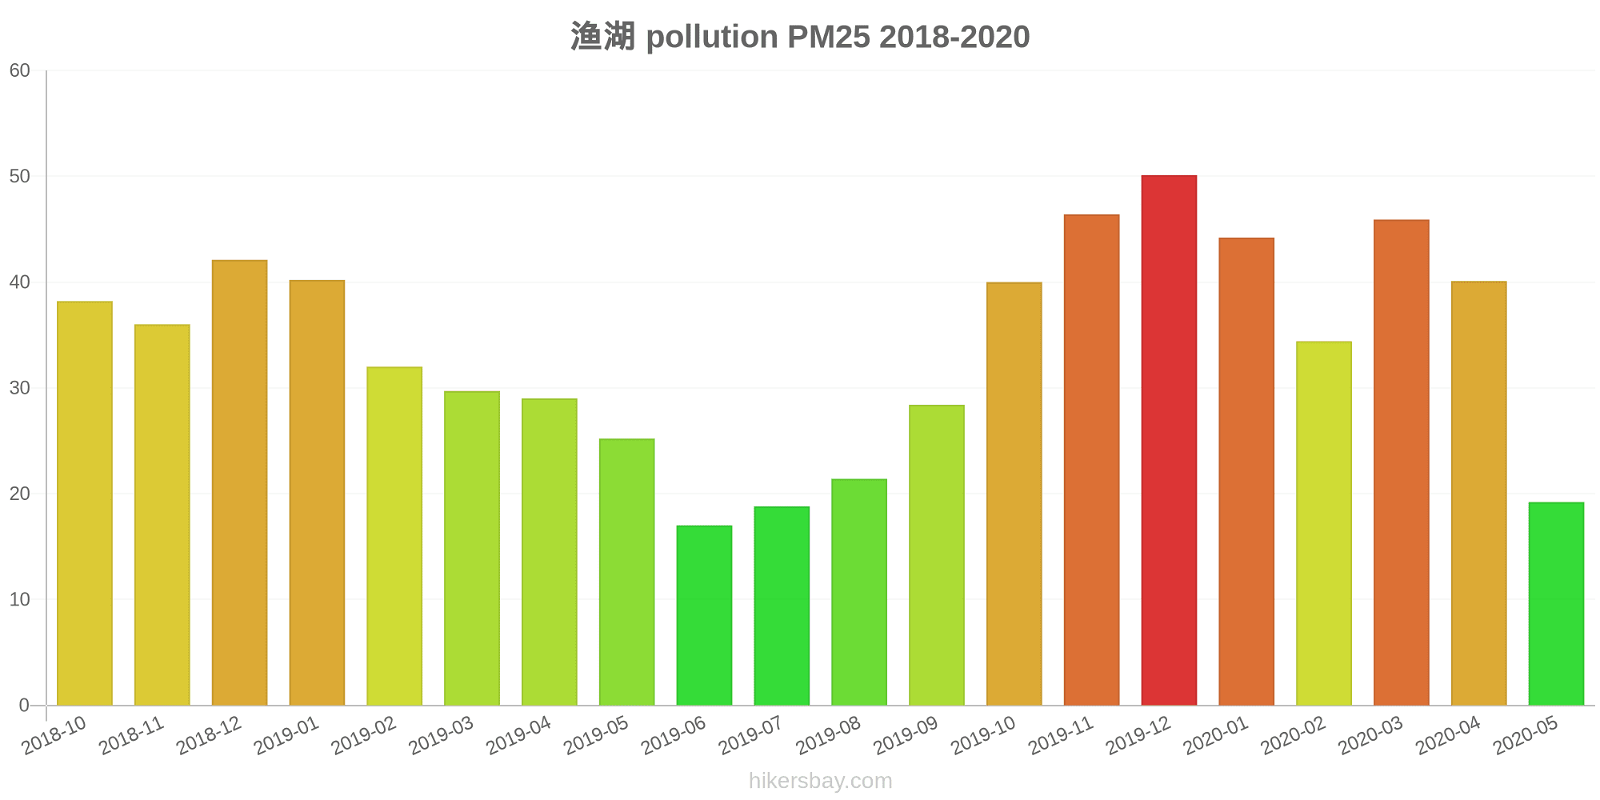
渔湖
Friday, May 27, 2022, 12:00 PM
PM10 6.7 (Good)
particulate matter (PM10) suspended dust
PM2,5 1.7 (Good)
particulate matter (PM2.5) dust
CO 100 (Good)
carbon monoxide (CO)
NO2 7.6 (Good)
nitrogen dioxide (NO2)
O3 0.02 (Good)
ozone (O3)
SO2 8.6 (Good)
sulfur dioxide (SO2)
渔湖
index
2022-05-27
pm10
32
pm25
24
co
468
no2
21
o3
32
so2
4.6
渔湖
2018-10 2020-05
index
2020-05
2020-04
2020-03
2020-02
2020-01
2019-12
2019-11
2019-10
2019-09
2019-08
2019-07
2019-06
2019-05
2019-04
2019-03
2019-02
2019-01
2018-12
2018-11
2018-10
pm25
19
40
46
34
44
50
46
40
28
21
19
17
25
29
30
32
40
42
36
38
co
632
683
784
666
882
826
765
841
763
652
634
663
730
860
881
919
1
934
823
863
no2
13
24
23
12
20
33
27
20
20
18
19
20
18
24
29
18
36
32
28
27
o3
116
132
107
110
116
118
148
147
151
116
100
95
120
119
118
101
111
85
113
142
pm10
41
55
54
41
51
70
79
64
50
37
36
32
45
51
53
49
66
63
56
61
so2
6.8
9.2
8.7
9.8
11
16
16
15
13
10
9
8.7
10
11
12
8.4
12
13
13
15
* Pollution data source:
https://openaq.org
(ChinaAQIData)
The data is licensed under CC-By 4.0
PM10 7 (Good)
PM2,5 2 (Good)
CO 100 (Good)
NO2 8 (Good)
O3 0 (Good)
SO2 9 (Good)
Data on air pollution from recent days in Yuguangcun
| index | 2022-05-27 |
|---|---|
| pm10 | 32 Moderate |
| pm25 | 24 Moderate |
| co | 468 Good |
| no2 | 21 Good |
| o3 | 32 Good |
| so2 | 5 Good |

| index | 2020-05 | 2020-04 | 2020-03 | 2020-02 | 2020-01 | 2019-12 | 2019-11 | 2019-10 | 2019-09 | 2019-08 | 2019-07 | 2019-06 | 2019-05 | 2019-04 | 2019-03 | 2019-02 | 2019-01 | 2018-12 | 2018-11 | 2018-10 |
|---|---|---|---|---|---|---|---|---|---|---|---|---|---|---|---|---|---|---|---|---|
| pm25 | 19 (Moderate) | 40 (Unhealthy for Sensitive Groups) | 46 (Unhealthy for Sensitive Groups) | 34 (Moderate) | 44 (Unhealthy for Sensitive Groups) | 50 (Unhealthy for Sensitive Groups) | 46 (Unhealthy for Sensitive Groups) | 40 (Unhealthy for Sensitive Groups) | 28 (Moderate) | 21 (Moderate) | 19 (Moderate) | 17 (Moderate) | 25 (Moderate) | 29 (Moderate) | 30 (Moderate) | 32 (Moderate) | 40 (Unhealthy for Sensitive Groups) | 42 (Unhealthy for Sensitive Groups) | 36 (Unhealthy for Sensitive Groups) | 38 (Unhealthy for Sensitive Groups) |
| co | 632 (Good) | 683 (Good) | 784 (Good) | 666 (Good) | 882 (Good) | 826 (Good) | 765 (Good) | 841 (Good) | 763 (Good) | 652 (Good) | 634 (Good) | 663 (Good) | 730 (Good) | 860 (Good) | 881 (Good) | 919 (Good) | 1 (Good) | 934 (Good) | 823 (Good) | 863 (Good) |
| no2 | 13 (Good) | 24 (Good) | 23 (Good) | 12 (Good) | 20 (Good) | 33 (Good) | 27 (Good) | 20 (Good) | 20 (Good) | 18 (Good) | 19 (Good) | 20 (Good) | 18 (Good) | 24 (Good) | 29 (Good) | 18 (Good) | 36 (Good) | 32 (Good) | 28 (Good) | 27 (Good) |
| o3 | 116 (Moderate) | 132 (Unhealthy for Sensitive Groups) | 107 (Moderate) | 110 (Moderate) | 116 (Moderate) | 118 (Moderate) | 148 (Unhealthy for Sensitive Groups) | 147 (Unhealthy for Sensitive Groups) | 151 (Unhealthy) | 116 (Moderate) | 100 (Moderate) | 95 (Moderate) | 120 (Unhealthy for Sensitive Groups) | 119 (Moderate) | 118 (Moderate) | 101 (Moderate) | 111 (Moderate) | 85 (Moderate) | 113 (Moderate) | 142 (Unhealthy for Sensitive Groups) |
| pm10 | 41 (Moderate) | 55 (Unhealthy for Sensitive Groups) | 54 (Unhealthy for Sensitive Groups) | 41 (Moderate) | 51 (Unhealthy for Sensitive Groups) | 70 (Unhealthy for Sensitive Groups) | 79 (Unhealthy for Sensitive Groups) | 64 (Unhealthy for Sensitive Groups) | 50 (Unhealthy for Sensitive Groups) | 37 (Moderate) | 36 (Moderate) | 32 (Moderate) | 45 (Moderate) | 51 (Unhealthy for Sensitive Groups) | 53 (Unhealthy for Sensitive Groups) | 49 (Moderate) | 66 (Unhealthy for Sensitive Groups) | 63 (Unhealthy for Sensitive Groups) | 56 (Unhealthy for Sensitive Groups) | 61 (Unhealthy for Sensitive Groups) |
| so2 | 6.8 (Good) | 9.2 (Good) | 8.7 (Good) | 9.8 (Good) | 11 (Good) | 16 (Good) | 16 (Good) | 15 (Good) | 13 (Good) | 10 (Good) | 9 (Good) | 8.7 (Good) | 10 (Good) | 11 (Good) | 12 (Good) | 8.4 (Good) | 12 (Good) | 13 (Good) | 13 (Good) | 15 (Good) |
PM10 6.7 (Good)
particulate matter (PM10) suspended dustPM2,5 1.7 (Good)
particulate matter (PM2.5) dustCO 100 (Good)
carbon monoxide (CO)NO2 7.6 (Good)
nitrogen dioxide (NO2)O3 0.02 (Good)
ozone (O3)SO2 8.6 (Good)
sulfur dioxide (SO2)渔湖
| index | 2022-05-27 |
|---|---|
| pm10 | 32 |
| pm25 | 24 |
| co | 468 |
| no2 | 21 |
| o3 | 32 |
| so2 | 4.6 |
渔湖

| index | 2020-05 | 2020-04 | 2020-03 | 2020-02 | 2020-01 | 2019-12 | 2019-11 | 2019-10 | 2019-09 | 2019-08 | 2019-07 | 2019-06 | 2019-05 | 2019-04 | 2019-03 | 2019-02 | 2019-01 | 2018-12 | 2018-11 | 2018-10 |
|---|---|---|---|---|---|---|---|---|---|---|---|---|---|---|---|---|---|---|---|---|
| pm25 | 19 | 40 | 46 | 34 | 44 | 50 | 46 | 40 | 28 | 21 | 19 | 17 | 25 | 29 | 30 | 32 | 40 | 42 | 36 | 38 |
| co | 632 | 683 | 784 | 666 | 882 | 826 | 765 | 841 | 763 | 652 | 634 | 663 | 730 | 860 | 881 | 919 | 1 | 934 | 823 | 863 |
| no2 | 13 | 24 | 23 | 12 | 20 | 33 | 27 | 20 | 20 | 18 | 19 | 20 | 18 | 24 | 29 | 18 | 36 | 32 | 28 | 27 |
| o3 | 116 | 132 | 107 | 110 | 116 | 118 | 148 | 147 | 151 | 116 | 100 | 95 | 120 | 119 | 118 | 101 | 111 | 85 | 113 | 142 |
| pm10 | 41 | 55 | 54 | 41 | 51 | 70 | 79 | 64 | 50 | 37 | 36 | 32 | 45 | 51 | 53 | 49 | 66 | 63 | 56 | 61 |
| so2 | 6.8 | 9.2 | 8.7 | 9.8 | 11 | 16 | 16 | 15 | 13 | 10 | 9 | 8.7 | 10 | 11 | 12 | 8.4 | 12 | 13 | 13 | 15 |