Air Pollution in Chengxincun: Real-time Air Quality Index and smog alert.
Pollution and air quality forecast for Chengxincun. Today is Tuesday, June 16, 2026. The following air pollution values have been recorded for Chengxincun:- particulate matter (PM10) suspended dust - 7 (Good)
- particulate matter (PM2.5) dust - 2 (Good)
- carbon monoxide (CO) - 100 (Good)
- nitrogen dioxide (NO2) - 8 (Good)
- ozone (O3) - 0 (Good)
- sulfur dioxide (SO2) - 9 (Good)

What is the air quality in Chengxincun today? Is the air polluted in Chengxincun?. Is there smog?
What is the level of PM10 today in Chengxincun? (particulate matter (PM10) suspended dust)
The current level of particulate matter PM10 in Chengxincun is:
7 (Good)
The highest PM10 values usually occur in month: 78 (November 2019).
The lowest value of particulate matter PM10 pollution in Chengxincun is usually recorded in: June (31).
What is the current level of PM2.5 in Chengxincun? (particulate matter (PM2.5) dust)
Today's PM2.5 level is:
2 (Good)
For comparison, the highest level of PM2.5 in Chengxincun in the last 7 days was: 24 (Friday, May 27, 2022) and the lowest: 24 (Friday, May 27, 2022).
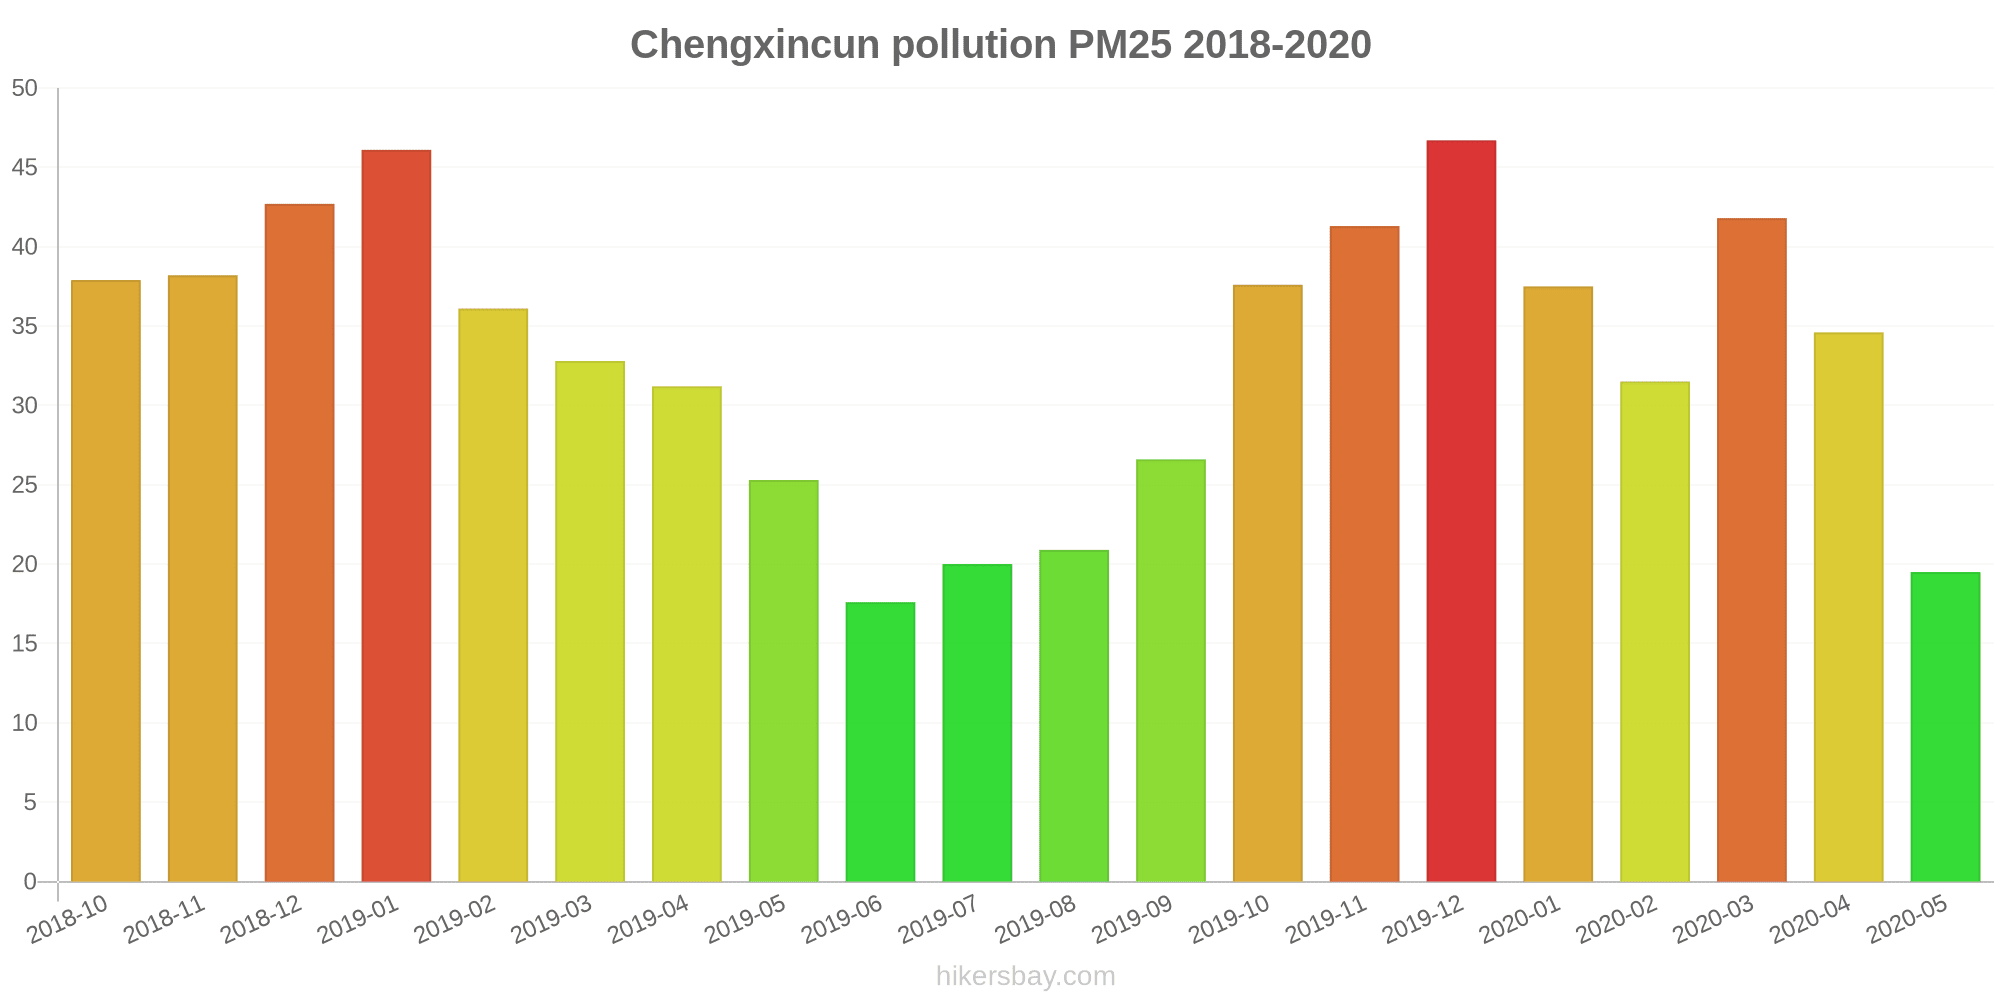
The highest PM2.5 values were recorded: 47 (December 2019).
The lowest level of particulate matter PM2.5 pollution occurs in month: June (18).
How high is the CO level? (carbon monoxide (CO))
100 (Good)
How high is the level of NO2? (nitrogen dioxide (NO2))
8 (Good)
How is the O3 level today in Chengxincun? (ozone (O3))
0 (Good)
What is the level of SO2 pollution? (sulfur dioxide (SO2))
9 (Good)
Current data Friday, May 27, 2022, 12:00 PM
PM10 7 (Good)
PM2,5 2 (Good)
CO 100 (Good)
NO2 8 (Good)
O3 0 (Good)
SO2 9 (Good)
Data on air pollution from recent days in Chengxincun
index
2022-05-27
pm10
32
Moderate
pm25
24
Moderate
co
468
Good
no2
21
Good
o3
32
Good
so2
5
Good
data source »
Air pollution in Chengxincun from October 2018 to May 2020

index
2020-05
2020-04
2020-03
2020-02
2020-01
2019-12
2019-11
2019-10
2019-09
2019-08
2019-07
2019-06
2019-05
2019-04
2019-03
2019-02
2019-01
2018-12
2018-11
2018-10
pm25
20 (Moderate)
35 (Moderate)
42 (Unhealthy for Sensitive Groups)
32 (Moderate)
38 (Unhealthy for Sensitive Groups)
47 (Unhealthy for Sensitive Groups)
41 (Unhealthy for Sensitive Groups)
38 (Unhealthy for Sensitive Groups)
27 (Moderate)
21 (Moderate)
20 (Moderate)
18 (Moderate)
25 (Moderate)
31 (Moderate)
33 (Moderate)
36 (Unhealthy for Sensitive Groups)
46 (Unhealthy for Sensitive Groups)
43 (Unhealthy for Sensitive Groups)
38 (Unhealthy for Sensitive Groups)
38 (Unhealthy for Sensitive Groups)
co
661 (Good)
774 (Good)
807 (Good)
756 (Good)
952 (Good)
925 (Good)
784 (Good)
806 (Good)
774 (Good)
755 (Good)
730 (Good)
768 (Good)
857 (Good)
952 (Good)
962 (Good)
1 (Good)
1 (Good)
1 (Good)
860 (Good)
931 (Good)
no2
11 (Good)
22 (Good)
23 (Good)
11 (Good)
17 (Good)
33 (Good)
26 (Good)
23 (Good)
19 (Good)
15 (Good)
16 (Good)
17 (Good)
20 (Good)
21 (Good)
24 (Good)
14 (Good)
33 (Good)
33 (Good)
27 (Good)
30 (Good)
o3
114 (Moderate)
140 (Unhealthy for Sensitive Groups)
106 (Moderate)
105 (Moderate)
116 (Moderate)
119 (Moderate)
158 (Unhealthy)
152 (Unhealthy)
145 (Unhealthy for Sensitive Groups)
114 (Moderate)
94 (Moderate)
94 (Moderate)
120 (Unhealthy for Sensitive Groups)
110 (Moderate)
111 (Moderate)
101 (Moderate)
104 (Moderate)
84 (Moderate)
107 (Moderate)
136 (Unhealthy for Sensitive Groups)
pm10
36 (Moderate)
58 (Unhealthy for Sensitive Groups)
58 (Unhealthy for Sensitive Groups)
42 (Moderate)
50 (Unhealthy for Sensitive Groups)
72 (Unhealthy for Sensitive Groups)
78 (Unhealthy for Sensitive Groups)
63 (Unhealthy for Sensitive Groups)
52 (Unhealthy for Sensitive Groups)
39 (Moderate)
37 (Moderate)
31 (Moderate)
47 (Moderate)
50 (Unhealthy for Sensitive Groups)
52 (Unhealthy for Sensitive Groups)
53 (Unhealthy for Sensitive Groups)
68 (Unhealthy for Sensitive Groups)
62 (Unhealthy for Sensitive Groups)
55 (Unhealthy for Sensitive Groups)
59 (Unhealthy for Sensitive Groups)
so2
7.8 (Good)
11 (Good)
8.4 (Good)
8.4 (Good)
10 (Good)
15 (Good)
15 (Good)
12 (Good)
8.9 (Good)
8.7 (Good)
8.1 (Good)
7.2 (Good)
8.8 (Good)
11 (Good)
12 (Good)
9.1 (Good)
10 (Good)
13 (Good)
14 (Good)
15 (Good)
data source »
西马
Friday, May 27, 2022, 12:00 PM
PM10 6.7 (Good)
particulate matter (PM10) suspended dust
PM2,5 1.7 (Good)
particulate matter (PM2.5) dust
CO 100 (Good)
carbon monoxide (CO)
NO2 7.6 (Good)
nitrogen dioxide (NO2)
O3 0.02 (Good)
ozone (O3)
SO2 8.6 (Good)
sulfur dioxide (SO2)
西马
index
2022-05-27
pm10
32
pm25
24
co
468
no2
21
o3
32
so2
4.6
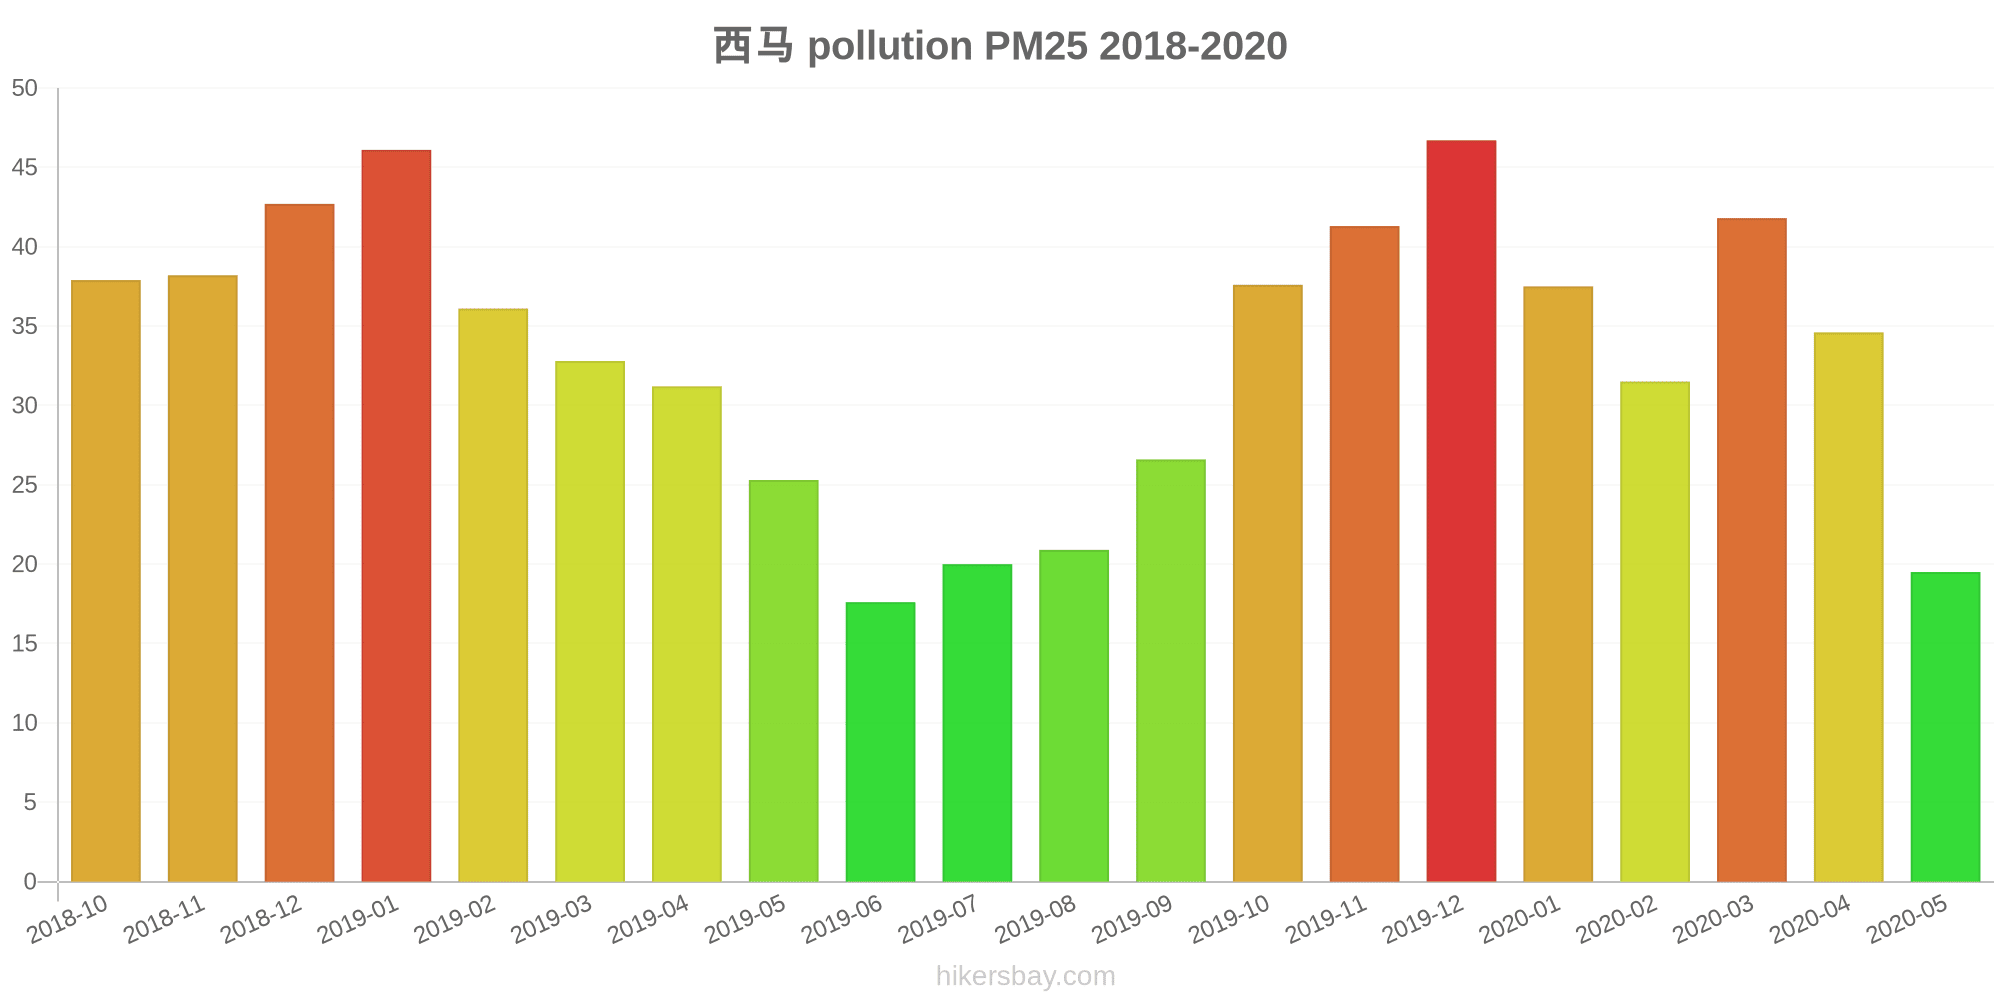
西马
2018-10 2020-05

index
2020-05
2020-04
2020-03
2020-02
2020-01
2019-12
2019-11
2019-10
2019-09
2019-08
2019-07
2019-06
2019-05
2019-04
2019-03
2019-02
2019-01
2018-12
2018-11
2018-10
pm25
20
35
42
32
38
47
41
38
27
21
20
18
25
31
33
36
46
43
38
38
co
661
774
807
756
952
925
784
806
774
755
730
768
857
952
962
1
1
1
860
931
no2
11
22
23
11
17
33
26
23
19
15
16
17
20
21
24
14
33
33
27
30
o3
114
140
106
105
116
119
158
152
145
114
94
94
120
110
111
101
104
84
107
136
pm10
36
58
58
42
50
72
78
63
52
39
37
31
47
50
52
53
68
62
55
59
so2
7.8
11
8.4
8.4
10
15
15
12
8.9
8.7
8.1
7.2
8.8
11
12
9.1
10
13
14
15
* Pollution data source:
https://openaq.org
(ChinaAQIData)
The data is licensed under CC-By 4.0
PM10 7 (Good)
PM2,5 2 (Good)
CO 100 (Good)
NO2 8 (Good)
O3 0 (Good)
SO2 9 (Good)
Data on air pollution from recent days in Chengxincun
| index | 2022-05-27 |
|---|---|
| pm10 | 32 Moderate |
| pm25 | 24 Moderate |
| co | 468 Good |
| no2 | 21 Good |
| o3 | 32 Good |
| so2 | 5 Good |
| index | 2020-05 | 2020-04 | 2020-03 | 2020-02 | 2020-01 | 2019-12 | 2019-11 | 2019-10 | 2019-09 | 2019-08 | 2019-07 | 2019-06 | 2019-05 | 2019-04 | 2019-03 | 2019-02 | 2019-01 | 2018-12 | 2018-11 | 2018-10 |
|---|---|---|---|---|---|---|---|---|---|---|---|---|---|---|---|---|---|---|---|---|
| pm25 | 20 (Moderate) | 35 (Moderate) | 42 (Unhealthy for Sensitive Groups) | 32 (Moderate) | 38 (Unhealthy for Sensitive Groups) | 47 (Unhealthy for Sensitive Groups) | 41 (Unhealthy for Sensitive Groups) | 38 (Unhealthy for Sensitive Groups) | 27 (Moderate) | 21 (Moderate) | 20 (Moderate) | 18 (Moderate) | 25 (Moderate) | 31 (Moderate) | 33 (Moderate) | 36 (Unhealthy for Sensitive Groups) | 46 (Unhealthy for Sensitive Groups) | 43 (Unhealthy for Sensitive Groups) | 38 (Unhealthy for Sensitive Groups) | 38 (Unhealthy for Sensitive Groups) |
| co | 661 (Good) | 774 (Good) | 807 (Good) | 756 (Good) | 952 (Good) | 925 (Good) | 784 (Good) | 806 (Good) | 774 (Good) | 755 (Good) | 730 (Good) | 768 (Good) | 857 (Good) | 952 (Good) | 962 (Good) | 1 (Good) | 1 (Good) | 1 (Good) | 860 (Good) | 931 (Good) |
| no2 | 11 (Good) | 22 (Good) | 23 (Good) | 11 (Good) | 17 (Good) | 33 (Good) | 26 (Good) | 23 (Good) | 19 (Good) | 15 (Good) | 16 (Good) | 17 (Good) | 20 (Good) | 21 (Good) | 24 (Good) | 14 (Good) | 33 (Good) | 33 (Good) | 27 (Good) | 30 (Good) |
| o3 | 114 (Moderate) | 140 (Unhealthy for Sensitive Groups) | 106 (Moderate) | 105 (Moderate) | 116 (Moderate) | 119 (Moderate) | 158 (Unhealthy) | 152 (Unhealthy) | 145 (Unhealthy for Sensitive Groups) | 114 (Moderate) | 94 (Moderate) | 94 (Moderate) | 120 (Unhealthy for Sensitive Groups) | 110 (Moderate) | 111 (Moderate) | 101 (Moderate) | 104 (Moderate) | 84 (Moderate) | 107 (Moderate) | 136 (Unhealthy for Sensitive Groups) |
| pm10 | 36 (Moderate) | 58 (Unhealthy for Sensitive Groups) | 58 (Unhealthy for Sensitive Groups) | 42 (Moderate) | 50 (Unhealthy for Sensitive Groups) | 72 (Unhealthy for Sensitive Groups) | 78 (Unhealthy for Sensitive Groups) | 63 (Unhealthy for Sensitive Groups) | 52 (Unhealthy for Sensitive Groups) | 39 (Moderate) | 37 (Moderate) | 31 (Moderate) | 47 (Moderate) | 50 (Unhealthy for Sensitive Groups) | 52 (Unhealthy for Sensitive Groups) | 53 (Unhealthy for Sensitive Groups) | 68 (Unhealthy for Sensitive Groups) | 62 (Unhealthy for Sensitive Groups) | 55 (Unhealthy for Sensitive Groups) | 59 (Unhealthy for Sensitive Groups) |
| so2 | 7.8 (Good) | 11 (Good) | 8.4 (Good) | 8.4 (Good) | 10 (Good) | 15 (Good) | 15 (Good) | 12 (Good) | 8.9 (Good) | 8.7 (Good) | 8.1 (Good) | 7.2 (Good) | 8.8 (Good) | 11 (Good) | 12 (Good) | 9.1 (Good) | 10 (Good) | 13 (Good) | 14 (Good) | 15 (Good) |
PM10 6.7 (Good)
particulate matter (PM10) suspended dustPM2,5 1.7 (Good)
particulate matter (PM2.5) dustCO 100 (Good)
carbon monoxide (CO)NO2 7.6 (Good)
nitrogen dioxide (NO2)O3 0.02 (Good)
ozone (O3)SO2 8.6 (Good)
sulfur dioxide (SO2)西马
| index | 2022-05-27 |
|---|---|
| pm10 | 32 |
| pm25 | 24 |
| co | 468 |
| no2 | 21 |
| o3 | 32 |
| so2 | 4.6 |
西马
| index | 2020-05 | 2020-04 | 2020-03 | 2020-02 | 2020-01 | 2019-12 | 2019-11 | 2019-10 | 2019-09 | 2019-08 | 2019-07 | 2019-06 | 2019-05 | 2019-04 | 2019-03 | 2019-02 | 2019-01 | 2018-12 | 2018-11 | 2018-10 |
|---|---|---|---|---|---|---|---|---|---|---|---|---|---|---|---|---|---|---|---|---|
| pm25 | 20 | 35 | 42 | 32 | 38 | 47 | 41 | 38 | 27 | 21 | 20 | 18 | 25 | 31 | 33 | 36 | 46 | 43 | 38 | 38 |
| co | 661 | 774 | 807 | 756 | 952 | 925 | 784 | 806 | 774 | 755 | 730 | 768 | 857 | 952 | 962 | 1 | 1 | 1 | 860 | 931 |
| no2 | 11 | 22 | 23 | 11 | 17 | 33 | 26 | 23 | 19 | 15 | 16 | 17 | 20 | 21 | 24 | 14 | 33 | 33 | 27 | 30 |
| o3 | 114 | 140 | 106 | 105 | 116 | 119 | 158 | 152 | 145 | 114 | 94 | 94 | 120 | 110 | 111 | 101 | 104 | 84 | 107 | 136 |
| pm10 | 36 | 58 | 58 | 42 | 50 | 72 | 78 | 63 | 52 | 39 | 37 | 31 | 47 | 50 | 52 | 53 | 68 | 62 | 55 | 59 |
| so2 | 7.8 | 11 | 8.4 | 8.4 | 10 | 15 | 15 | 12 | 8.9 | 8.7 | 8.1 | 7.2 | 8.8 | 11 | 12 | 9.1 | 10 | 13 | 14 | 15 |