Air Pollution in Lianhecun: Real-time Air Quality Index and smog alert.
Pollution and air quality forecast for Lianhecun. Today is Tuesday, June 16, 2026. The following air pollution values have been recorded for Lianhecun:- particulate matter (PM10) suspended dust - 7 (Good)
- particulate matter (PM2.5) dust - 2 (Good)
- carbon monoxide (CO) - 100 (Good)
- nitrogen dioxide (NO2) - 8 (Good)
- ozone (O3) - 0 (Good)
- sulfur dioxide (SO2) - 9 (Good)

What is the air quality in Lianhecun today? Is the air polluted in Lianhecun?. Is there smog?
What is the level of PM10 today in Lianhecun? (particulate matter (PM10) suspended dust)
The current level of particulate matter PM10 in Lianhecun is:
7 (Good)
The highest PM10 values usually occur in month: 110 (January 2019).
The lowest value of particulate matter PM10 pollution in Lianhecun is usually recorded in: August (44).
What is the current level of PM2.5 in Lianhecun? (particulate matter (PM2.5) dust)
Today's PM2.5 level is:
2 (Good)
For comparison, the highest level of PM2.5 in Lianhecun in the last 7 days was: 24 (Friday, May 27, 2022) and the lowest: 24 (Friday, May 27, 2022).
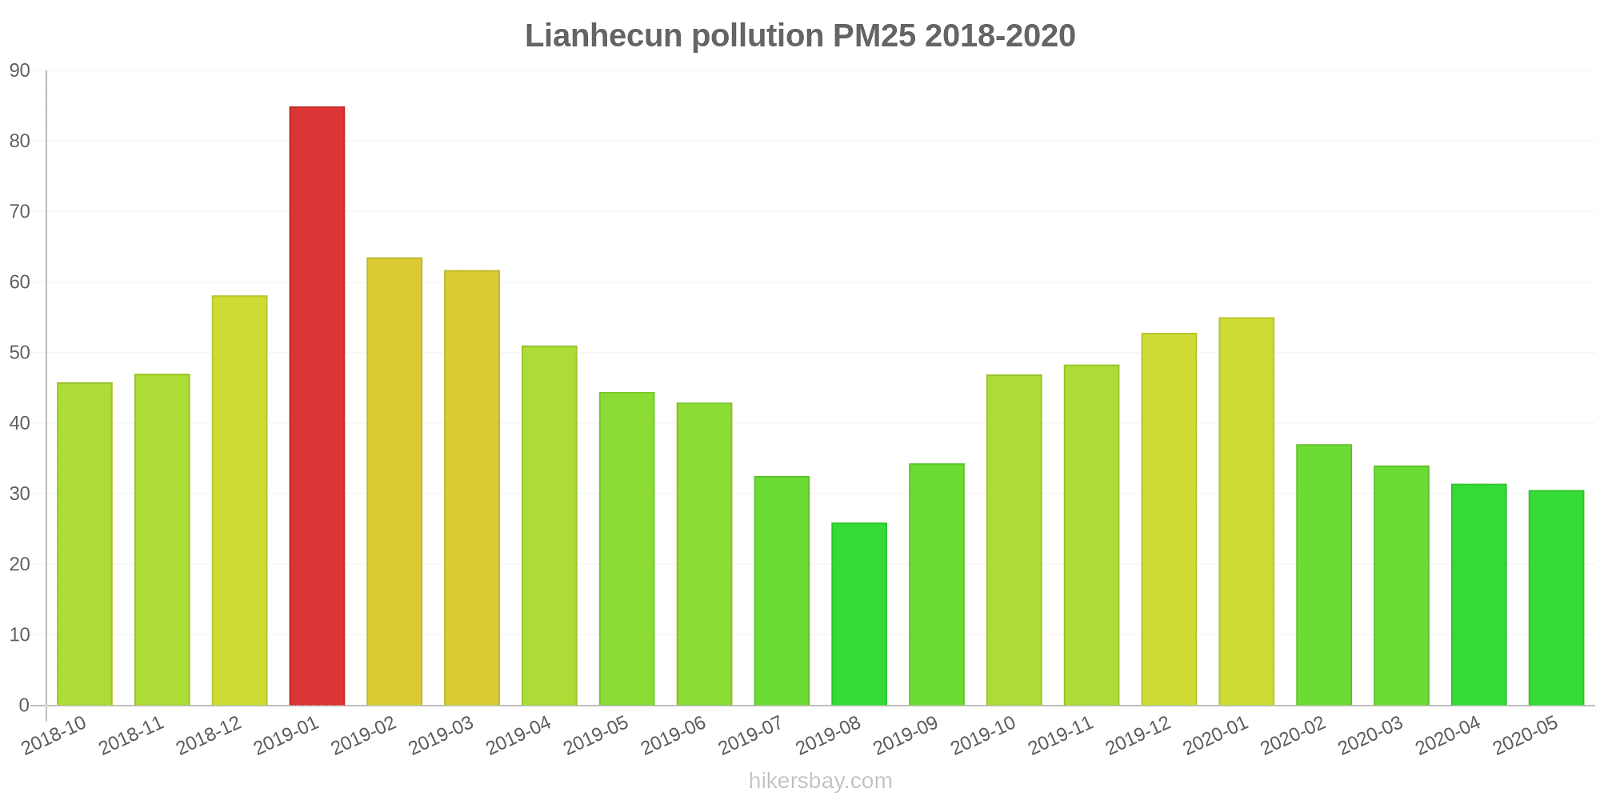
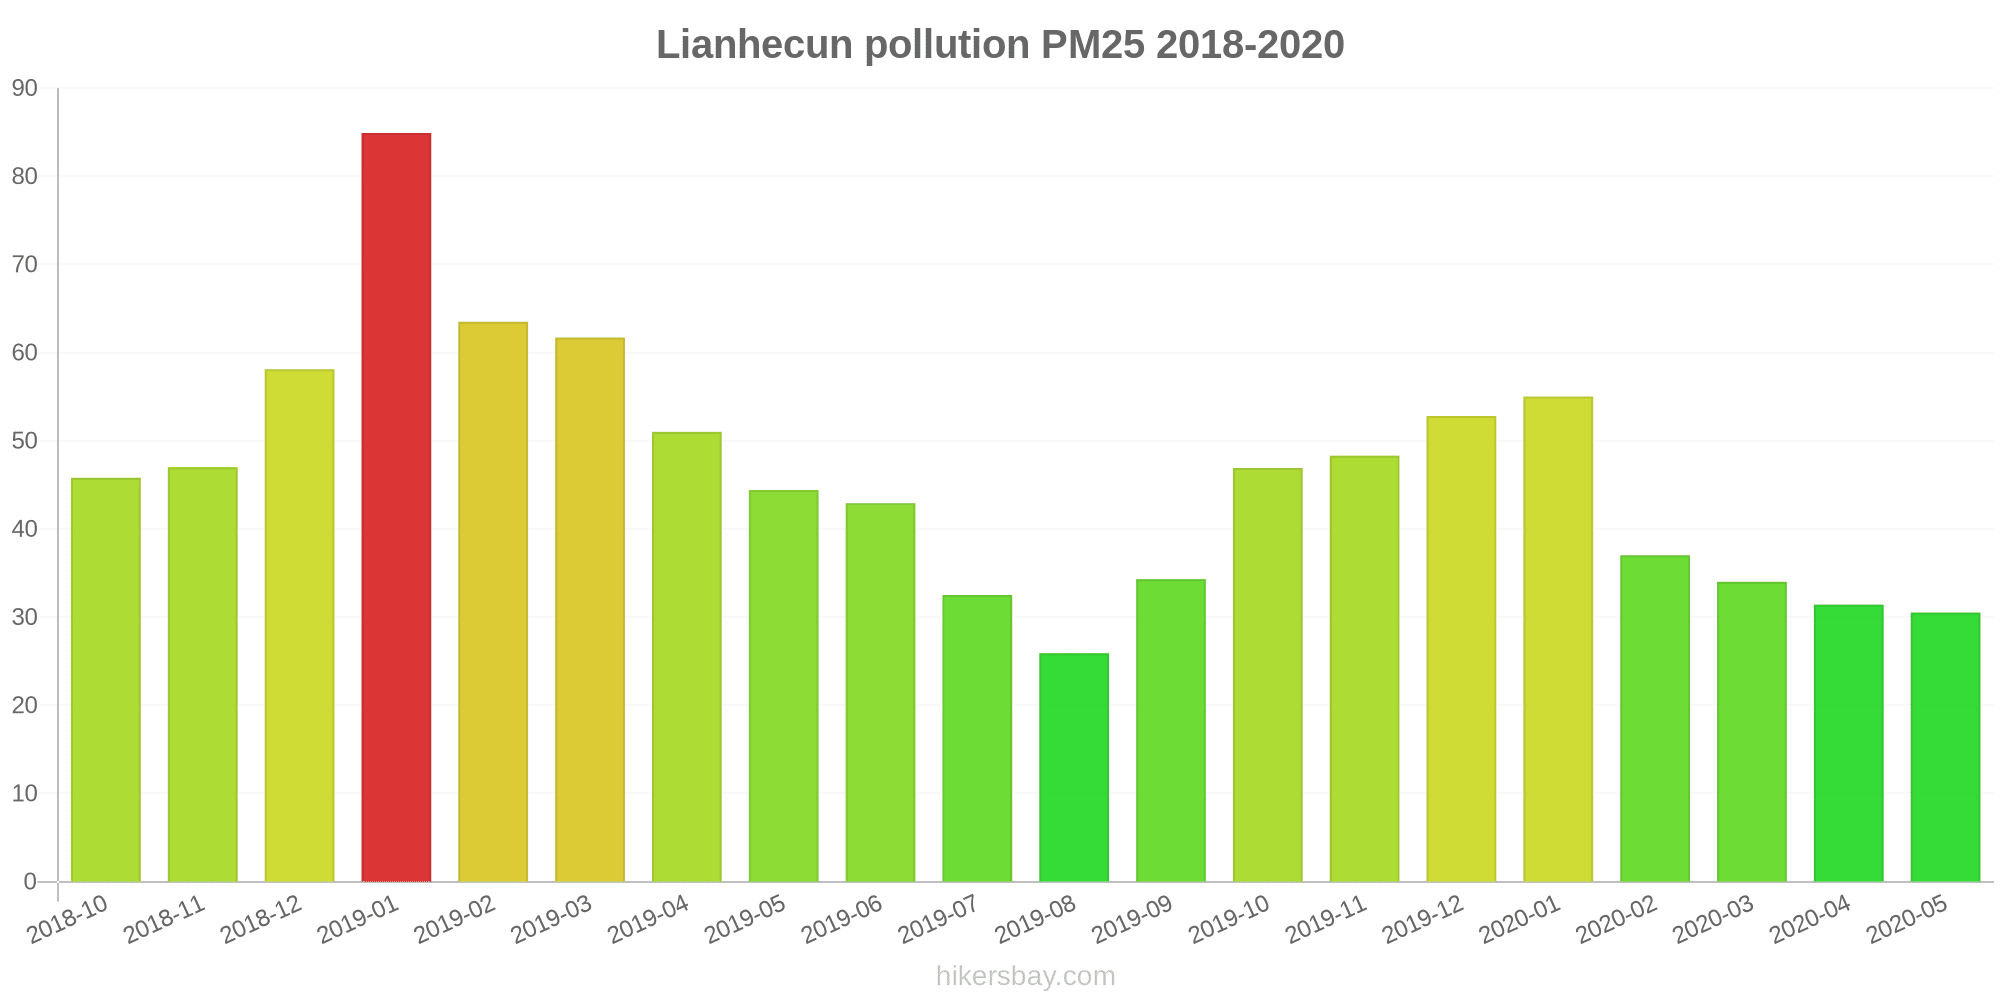
The highest PM2.5 values were recorded: 85 (January 2019).
The lowest level of particulate matter PM2.5 pollution occurs in month: August (26).
How high is the CO level? (carbon monoxide (CO))
100 (Good)
How high is the level of NO2? (nitrogen dioxide (NO2))
8 (Good)
How is the O3 level today in Lianhecun? (ozone (O3))
0 (Good)
What is the level of SO2 pollution? (sulfur dioxide (SO2))
9 (Good)
Current data Friday, May 27, 2022, 12:00 PM
PM10 7 (Good)
PM2,5 2 (Good)
CO 100 (Good)
NO2 8 (Good)
O3 0 (Good)
SO2 9 (Good)
Data on air pollution from recent days in Lianhecun
index
2022-05-27
pm10
32
Moderate
pm25
24
Moderate
co
468
Good
no2
21
Good
o3
32
Good
so2
5
Good
data source »
Air pollution in Lianhecun from October 2018 to May 2020
index
2020-05
2020-04
2020-03
2020-02
2020-01
2019-12
2019-11
2019-10
2019-09
2019-08
2019-07
2019-06
2019-05
2019-04
2019-03
2019-02
2019-01
2018-12
2018-11
2018-10
pm25
31 (Moderate)
31 (Moderate)
34 (Moderate)
37 (Unhealthy for Sensitive Groups)
55 (Unhealthy)
53 (Unhealthy for Sensitive Groups)
48 (Unhealthy for Sensitive Groups)
47 (Unhealthy for Sensitive Groups)
34 (Moderate)
26 (Moderate)
33 (Moderate)
43 (Unhealthy for Sensitive Groups)
44 (Unhealthy for Sensitive Groups)
51 (Unhealthy for Sensitive Groups)
62 (Unhealthy)
64 (Unhealthy)
85 (Very Unhealthy)
58 (Unhealthy)
47 (Unhealthy for Sensitive Groups)
46 (Unhealthy for Sensitive Groups)
co
707 (Good)
714 (Good)
738 (Good)
914 (Good)
1 (Good)
1 (Good)
762 (Good)
780 (Good)
935 (Good)
726 (Good)
674 (Good)
651 (Good)
683 (Good)
767 (Good)
1 (Good)
1 (Good)
1 (Good)
984 (Good)
764 (Good)
704 (Good)
no2
23 (Good)
32 (Good)
28 (Good)
22 (Good)
27 (Good)
46 (Moderate)
42 (Moderate)
37 (Good)
27 (Good)
23 (Good)
25 (Good)
21 (Good)
30 (Good)
31 (Good)
41 (Moderate)
30 (Good)
49 (Moderate)
41 (Moderate)
38 (Good)
42 (Moderate)
o3
114 (Moderate)
119 (Moderate)
93 (Moderate)
73 (Moderate)
51 (Good)
61 (Good)
94 (Moderate)
109 (Moderate)
170 (Unhealthy)
154 (Unhealthy)
135 (Unhealthy for Sensitive Groups)
154 (Unhealthy)
157 (Unhealthy)
142 (Unhealthy for Sensitive Groups)
128 (Unhealthy for Sensitive Groups)
75 (Moderate)
64 (Good)
62 (Good)
88 (Moderate)
111 (Moderate)
pm10
57 (Unhealthy for Sensitive Groups)
66 (Unhealthy for Sensitive Groups)
63 (Unhealthy for Sensitive Groups)
53 (Unhealthy for Sensitive Groups)
75 (Unhealthy for Sensitive Groups)
81 (Unhealthy)
97 (Unhealthy)
83 (Unhealthy)
60 (Unhealthy for Sensitive Groups)
44 (Moderate)
46 (Moderate)
48 (Moderate)
70 (Unhealthy for Sensitive Groups)
72 (Unhealthy for Sensitive Groups)
85 (Unhealthy)
79 (Unhealthy for Sensitive Groups)
110 (Very Unhealthy)
81 (Unhealthy)
72 (Unhealthy for Sensitive Groups)
80 (Unhealthy for Sensitive Groups)
so2
16 (Good)
14 (Good)
13 (Good)
13 (Good)
12 (Good)
14 (Good)
12 (Good)
11 (Good)
11 (Good)
14 (Good)
14 (Good)
10 (Good)
12 (Good)
14 (Good)
14 (Good)
10 (Good)
11 (Good)
10 (Good)
9.2 (Good)
14 (Good)
data source »
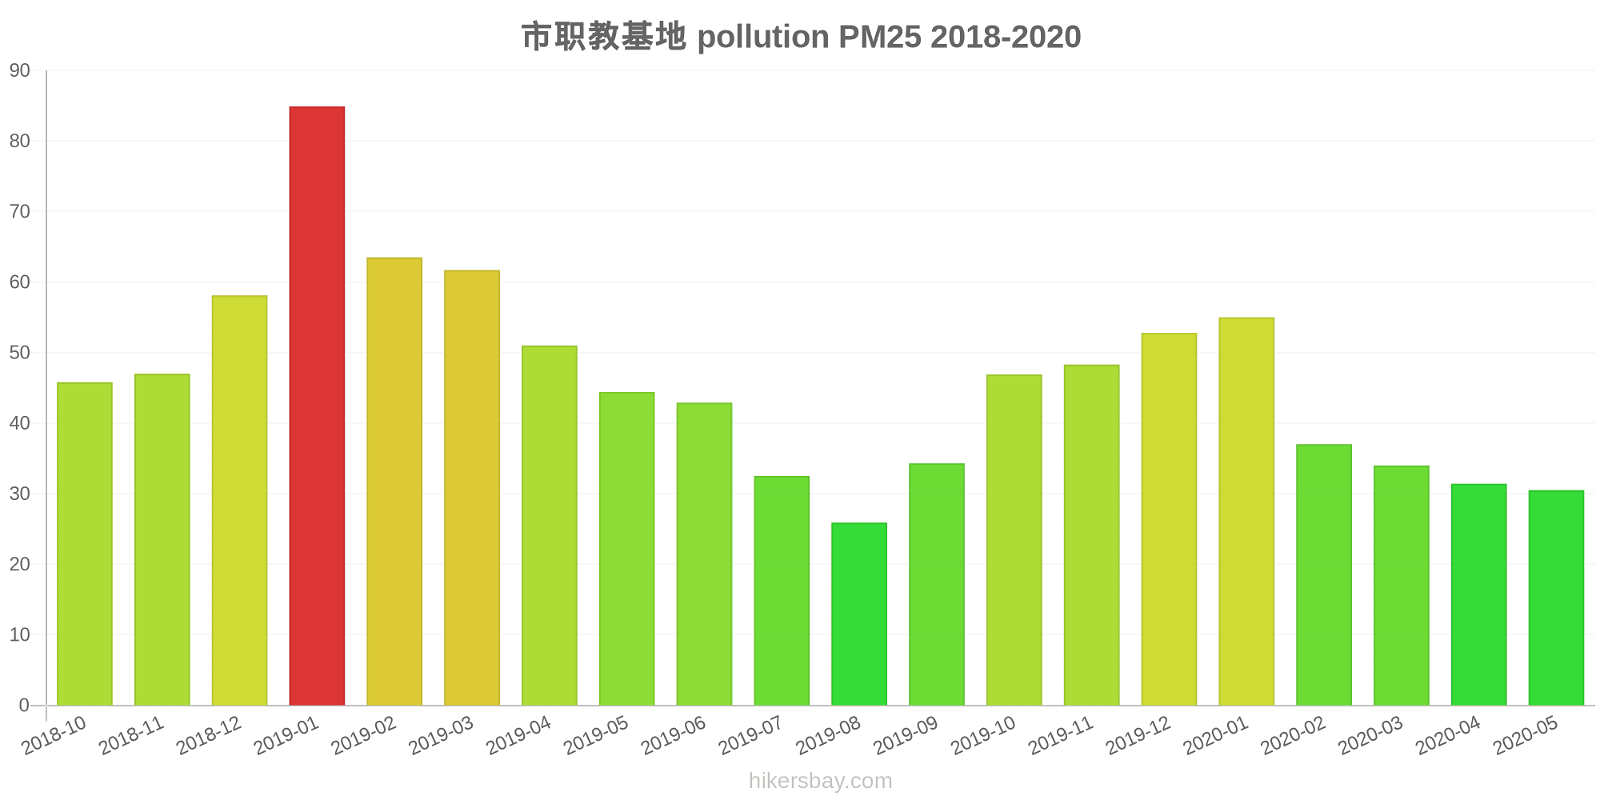
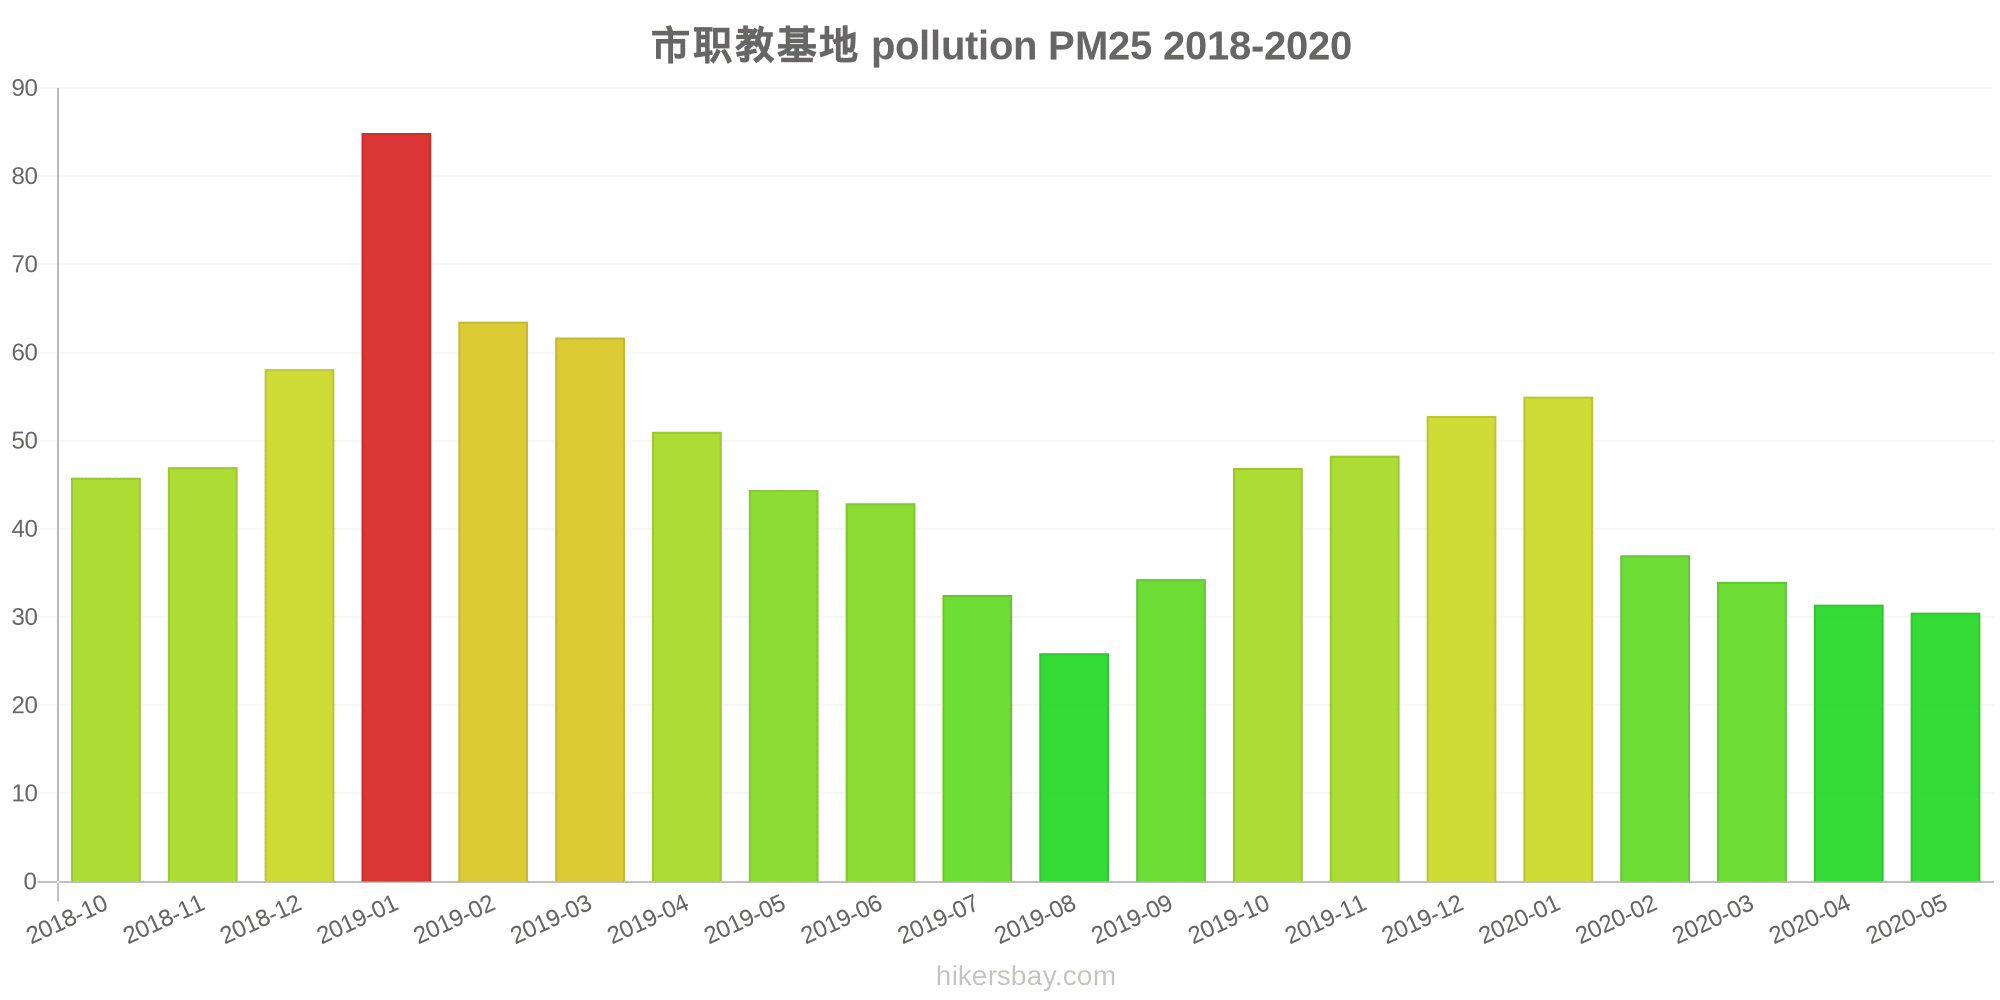
市职教基地
Friday, May 27, 2022, 12:00 PM
PM10 6.7 (Good)
particulate matter (PM10) suspended dust
PM2,5 1.7 (Good)
particulate matter (PM2.5) dust
CO 100 (Good)
carbon monoxide (CO)
NO2 7.6 (Good)
nitrogen dioxide (NO2)
O3 0.02 (Good)
ozone (O3)
SO2 8.6 (Good)
sulfur dioxide (SO2)
市职教基地
index
2022-05-27
pm10
32
pm25
24
co
468
no2
21
o3
32
so2
4.6
市职教基地
2018-10 2020-05
index
2020-05
2020-04
2020-03
2020-02
2020-01
2019-12
2019-11
2019-10
2019-09
2019-08
2019-07
2019-06
2019-05
2019-04
2019-03
2019-02
2019-01
2018-12
2018-11
2018-10
pm25
31
31
34
37
55
53
48
47
34
26
33
43
44
51
62
64
85
58
47
46
co
707
714
738
914
1
1
762
780
935
726
674
651
683
767
1
1
1
984
764
704
no2
23
32
28
22
27
46
42
37
27
23
25
21
30
31
41
30
49
41
38
42
o3
114
119
93
73
51
61
94
109
170
154
135
154
157
142
128
75
64
62
88
111
pm10
57
66
63
53
75
81
97
83
60
44
46
48
70
72
85
79
110
81
72
80
so2
16
14
13
13
12
14
12
11
11
14
14
10
12
14
14
10
11
10
9.2
14
* Pollution data source:
https://openaq.org
(ChinaAQIData)
The data is licensed under CC-By 4.0
PM10 7 (Good)
PM2,5 2 (Good)
CO 100 (Good)
NO2 8 (Good)
O3 0 (Good)
SO2 9 (Good)
Data on air pollution from recent days in Lianhecun
| index | 2022-05-27 |
|---|---|
| pm10 | 32 Moderate |
| pm25 | 24 Moderate |
| co | 468 Good |
| no2 | 21 Good |
| o3 | 32 Good |
| so2 | 5 Good |
| index | 2020-05 | 2020-04 | 2020-03 | 2020-02 | 2020-01 | 2019-12 | 2019-11 | 2019-10 | 2019-09 | 2019-08 | 2019-07 | 2019-06 | 2019-05 | 2019-04 | 2019-03 | 2019-02 | 2019-01 | 2018-12 | 2018-11 | 2018-10 |
|---|---|---|---|---|---|---|---|---|---|---|---|---|---|---|---|---|---|---|---|---|
| pm25 | 31 (Moderate) | 31 (Moderate) | 34 (Moderate) | 37 (Unhealthy for Sensitive Groups) | 55 (Unhealthy) | 53 (Unhealthy for Sensitive Groups) | 48 (Unhealthy for Sensitive Groups) | 47 (Unhealthy for Sensitive Groups) | 34 (Moderate) | 26 (Moderate) | 33 (Moderate) | 43 (Unhealthy for Sensitive Groups) | 44 (Unhealthy for Sensitive Groups) | 51 (Unhealthy for Sensitive Groups) | 62 (Unhealthy) | 64 (Unhealthy) | 85 (Very Unhealthy) | 58 (Unhealthy) | 47 (Unhealthy for Sensitive Groups) | 46 (Unhealthy for Sensitive Groups) |
| co | 707 (Good) | 714 (Good) | 738 (Good) | 914 (Good) | 1 (Good) | 1 (Good) | 762 (Good) | 780 (Good) | 935 (Good) | 726 (Good) | 674 (Good) | 651 (Good) | 683 (Good) | 767 (Good) | 1 (Good) | 1 (Good) | 1 (Good) | 984 (Good) | 764 (Good) | 704 (Good) |
| no2 | 23 (Good) | 32 (Good) | 28 (Good) | 22 (Good) | 27 (Good) | 46 (Moderate) | 42 (Moderate) | 37 (Good) | 27 (Good) | 23 (Good) | 25 (Good) | 21 (Good) | 30 (Good) | 31 (Good) | 41 (Moderate) | 30 (Good) | 49 (Moderate) | 41 (Moderate) | 38 (Good) | 42 (Moderate) |
| o3 | 114 (Moderate) | 119 (Moderate) | 93 (Moderate) | 73 (Moderate) | 51 (Good) | 61 (Good) | 94 (Moderate) | 109 (Moderate) | 170 (Unhealthy) | 154 (Unhealthy) | 135 (Unhealthy for Sensitive Groups) | 154 (Unhealthy) | 157 (Unhealthy) | 142 (Unhealthy for Sensitive Groups) | 128 (Unhealthy for Sensitive Groups) | 75 (Moderate) | 64 (Good) | 62 (Good) | 88 (Moderate) | 111 (Moderate) |
| pm10 | 57 (Unhealthy for Sensitive Groups) | 66 (Unhealthy for Sensitive Groups) | 63 (Unhealthy for Sensitive Groups) | 53 (Unhealthy for Sensitive Groups) | 75 (Unhealthy for Sensitive Groups) | 81 (Unhealthy) | 97 (Unhealthy) | 83 (Unhealthy) | 60 (Unhealthy for Sensitive Groups) | 44 (Moderate) | 46 (Moderate) | 48 (Moderate) | 70 (Unhealthy for Sensitive Groups) | 72 (Unhealthy for Sensitive Groups) | 85 (Unhealthy) | 79 (Unhealthy for Sensitive Groups) | 110 (Very Unhealthy) | 81 (Unhealthy) | 72 (Unhealthy for Sensitive Groups) | 80 (Unhealthy for Sensitive Groups) |
| so2 | 16 (Good) | 14 (Good) | 13 (Good) | 13 (Good) | 12 (Good) | 14 (Good) | 12 (Good) | 11 (Good) | 11 (Good) | 14 (Good) | 14 (Good) | 10 (Good) | 12 (Good) | 14 (Good) | 14 (Good) | 10 (Good) | 11 (Good) | 10 (Good) | 9.2 (Good) | 14 (Good) |
PM10 6.7 (Good)
particulate matter (PM10) suspended dustPM2,5 1.7 (Good)
particulate matter (PM2.5) dustCO 100 (Good)
carbon monoxide (CO)NO2 7.6 (Good)
nitrogen dioxide (NO2)O3 0.02 (Good)
ozone (O3)SO2 8.6 (Good)
sulfur dioxide (SO2)市职教基地
| index | 2022-05-27 |
|---|---|
| pm10 | 32 |
| pm25 | 24 |
| co | 468 |
| no2 | 21 |
| o3 | 32 |
| so2 | 4.6 |
市职教基地
| index | 2020-05 | 2020-04 | 2020-03 | 2020-02 | 2020-01 | 2019-12 | 2019-11 | 2019-10 | 2019-09 | 2019-08 | 2019-07 | 2019-06 | 2019-05 | 2019-04 | 2019-03 | 2019-02 | 2019-01 | 2018-12 | 2018-11 | 2018-10 |
|---|---|---|---|---|---|---|---|---|---|---|---|---|---|---|---|---|---|---|---|---|
| pm25 | 31 | 31 | 34 | 37 | 55 | 53 | 48 | 47 | 34 | 26 | 33 | 43 | 44 | 51 | 62 | 64 | 85 | 58 | 47 | 46 |
| co | 707 | 714 | 738 | 914 | 1 | 1 | 762 | 780 | 935 | 726 | 674 | 651 | 683 | 767 | 1 | 1 | 1 | 984 | 764 | 704 |
| no2 | 23 | 32 | 28 | 22 | 27 | 46 | 42 | 37 | 27 | 23 | 25 | 21 | 30 | 31 | 41 | 30 | 49 | 41 | 38 | 42 |
| o3 | 114 | 119 | 93 | 73 | 51 | 61 | 94 | 109 | 170 | 154 | 135 | 154 | 157 | 142 | 128 | 75 | 64 | 62 | 88 | 111 |
| pm10 | 57 | 66 | 63 | 53 | 75 | 81 | 97 | 83 | 60 | 44 | 46 | 48 | 70 | 72 | 85 | 79 | 110 | 81 | 72 | 80 |
| so2 | 16 | 14 | 13 | 13 | 12 | 14 | 12 | 11 | 11 | 14 | 14 | 10 | 12 | 14 | 14 | 10 | 11 | 10 | 9.2 | 14 |