Air Pollution in Chaitangcun: Real-time Air Quality Index and smog alert.
Pollution and air quality forecast for Chaitangcun. Today is Tuesday, June 16, 2026. The following air pollution values have been recorded for Chaitangcun:- particulate matter (PM10) suspended dust - 7 (Good)
- particulate matter (PM2.5) dust - 2 (Good)
- carbon monoxide (CO) - 100 (Good)
- nitrogen dioxide (NO2) - 8 (Good)
- ozone (O3) - 0 (Good)
- sulfur dioxide (SO2) - 9 (Good)

What is the air quality in Chaitangcun today? Is the air polluted in Chaitangcun?. Is there smog?
What is the level of PM10 today in Chaitangcun? (particulate matter (PM10) suspended dust)
The current level of particulate matter PM10 in Chaitangcun is:
7 (Good)
The highest PM10 values usually occur in month: 102 (January 2019).
The lowest value of particulate matter PM10 pollution in Chaitangcun is usually recorded in: August (44).
What is the current level of PM2.5 in Chaitangcun? (particulate matter (PM2.5) dust)
Today's PM2.5 level is:
2 (Good)
For comparison, the highest level of PM2.5 in Chaitangcun in the last 7 days was: 24 (Friday, May 27, 2022) and the lowest: 24 (Friday, May 27, 2022).
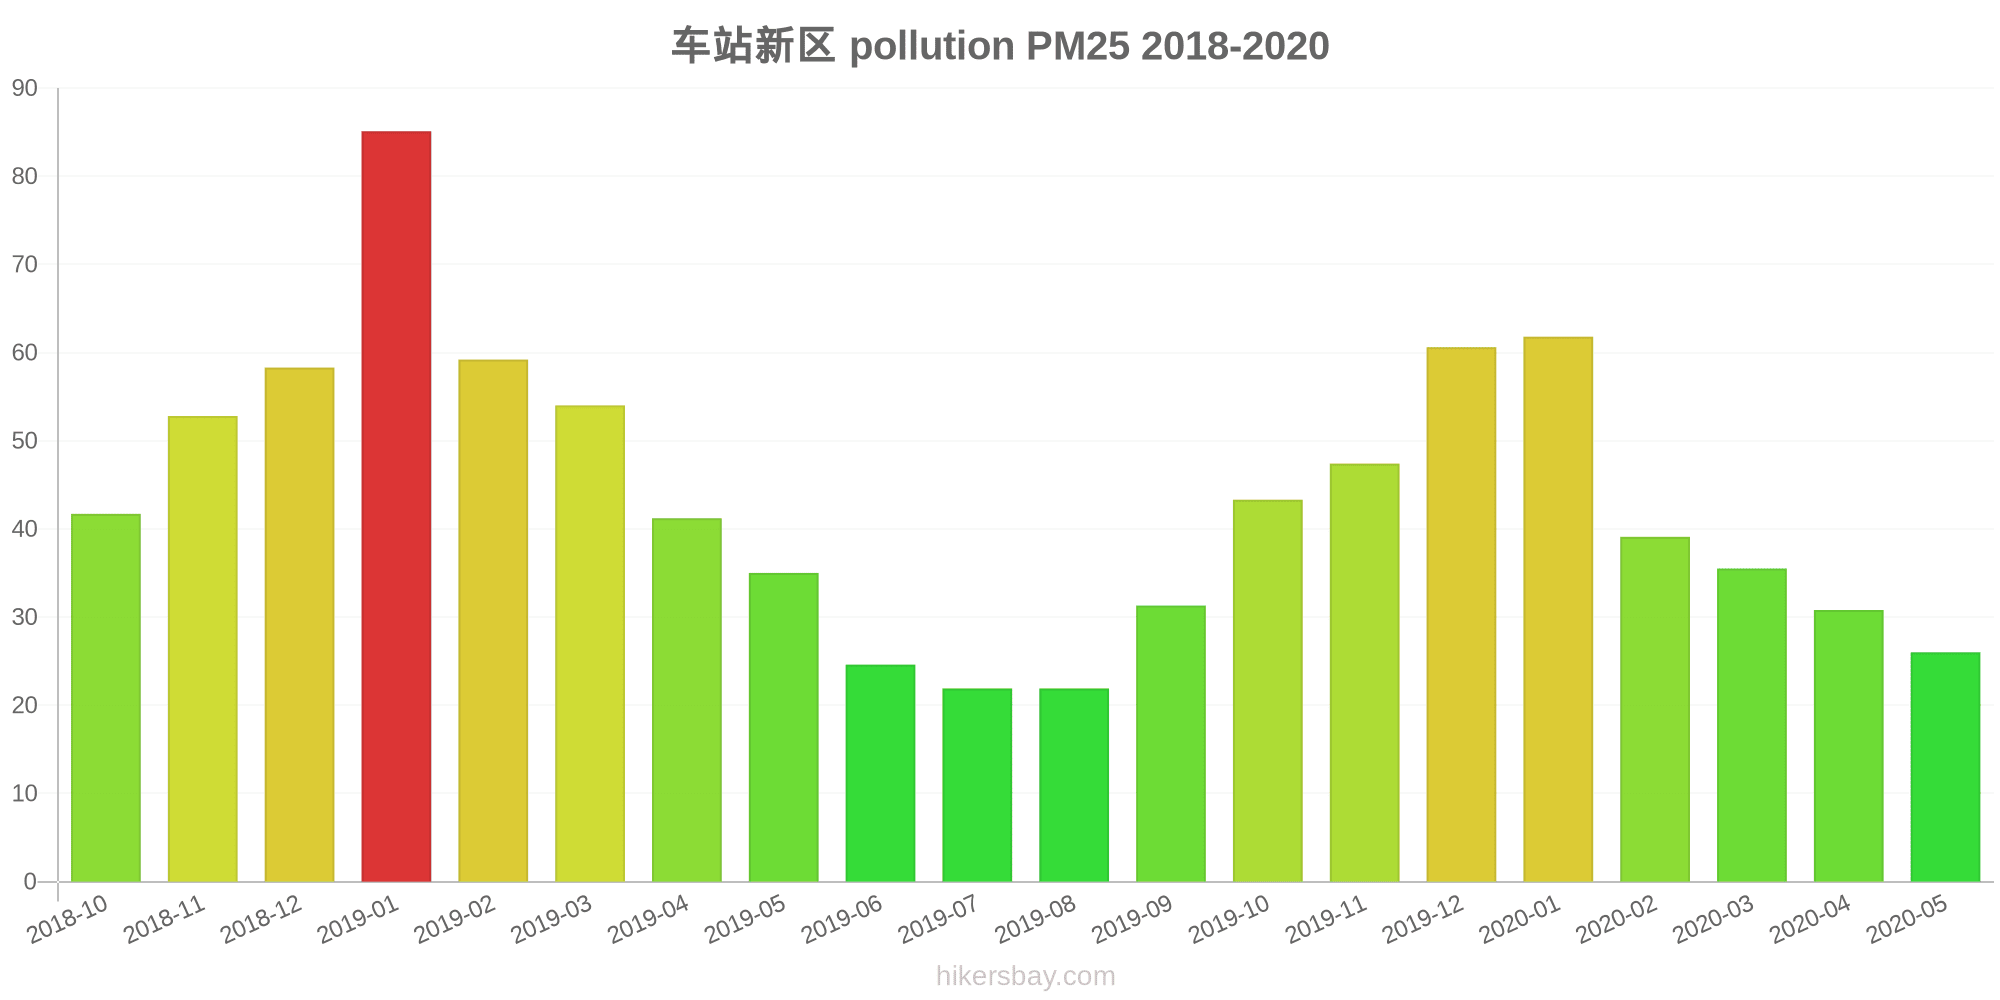
The highest PM2.5 values were recorded: 85 (January 2019).
The lowest level of particulate matter PM2.5 pollution occurs in month: August (22).
How high is the CO level? (carbon monoxide (CO))
100 (Good)
How high is the level of NO2? (nitrogen dioxide (NO2))
8 (Good)
How is the O3 level today in Chaitangcun? (ozone (O3))
0 (Good)
What is the level of SO2 pollution? (sulfur dioxide (SO2))
9 (Good)
Current data Friday, May 27, 2022, 12:00 PM
PM10 7 (Good)
PM2,5 2 (Good)
CO 100 (Good)
NO2 8 (Good)
O3 0 (Good)
SO2 9 (Good)
Data on air pollution from recent days in Chaitangcun
index
2022-05-27
pm10
32
Moderate
pm25
24
Moderate
co
468
Good
no2
21
Good
o3
32
Good
so2
5
Good
data source »
Air pollution in Chaitangcun from October 2018 to May 2020

index
2020-05
2020-04
2020-03
2020-02
2020-01
2019-12
2019-11
2019-10
2019-09
2019-08
2019-07
2019-06
2019-05
2019-04
2019-03
2019-02
2019-01
2018-12
2018-11
2018-10
pm25
26 (Moderate)
31 (Moderate)
36 (Unhealthy for Sensitive Groups)
39 (Unhealthy for Sensitive Groups)
62 (Unhealthy)
61 (Unhealthy)
47 (Unhealthy for Sensitive Groups)
43 (Unhealthy for Sensitive Groups)
31 (Moderate)
22 (Moderate)
22 (Moderate)
25 (Moderate)
35 (Unhealthy for Sensitive Groups)
41 (Unhealthy for Sensitive Groups)
54 (Unhealthy for Sensitive Groups)
59 (Unhealthy)
85 (Very Unhealthy)
58 (Unhealthy)
53 (Unhealthy for Sensitive Groups)
42 (Unhealthy for Sensitive Groups)
co
598 (Good)
638 (Good)
768 (Good)
830 (Good)
802 (Good)
920 (Good)
774 (Good)
814 (Good)
604 (Good)
404 (Good)
518 (Good)
519 (Good)
611 (Good)
682 (Good)
736 (Good)
1 (Good)
1 (Good)
932 (Good)
829 (Good)
745 (Good)
no2
27 (Good)
36 (Good)
33 (Good)
25 (Good)
37 (Good)
53 (Moderate)
47 (Moderate)
39 (Good)
26 (Good)
21 (Good)
23 (Good)
23 (Good)
29 (Good)
34 (Good)
38 (Good)
30 (Good)
48 (Moderate)
42 (Moderate)
45 (Moderate)
44 (Moderate)
o3
122 (Unhealthy for Sensitive Groups)
122 (Unhealthy for Sensitive Groups)
101 (Moderate)
92 (Moderate)
81 (Moderate)
79 (Moderate)
97 (Moderate)
108 (Moderate)
145 (Unhealthy for Sensitive Groups)
150 (Unhealthy)
140 (Unhealthy for Sensitive Groups)
152 (Unhealthy)
139 (Unhealthy for Sensitive Groups)
116 (Moderate)
99 (Moderate)
63 (Good)
68 (Good)
56 (Good)
73 (Moderate)
83 (Moderate)
pm10
59 (Unhealthy for Sensitive Groups)
71 (Unhealthy for Sensitive Groups)
66 (Unhealthy for Sensitive Groups)
55 (Unhealthy for Sensitive Groups)
75 (Unhealthy for Sensitive Groups)
82 (Unhealthy)
90 (Unhealthy)
88 (Unhealthy)
61 (Unhealthy for Sensitive Groups)
44 (Moderate)
47 (Moderate)
48 (Moderate)
67 (Unhealthy for Sensitive Groups)
71 (Unhealthy for Sensitive Groups)
86 (Unhealthy)
72 (Unhealthy for Sensitive Groups)
102 (Unhealthy)
83 (Unhealthy)
66 (Unhealthy for Sensitive Groups)
65 (Unhealthy for Sensitive Groups)
so2
13 (Good)
11 (Good)
9.9 (Good)
9.8 (Good)
10 (Good)
9.8 (Good)
9.3 (Good)
8.9 (Good)
11 (Good)
11 (Good)
9.9 (Good)
11 (Good)
9.3 (Good)
10 (Good)
12 (Good)
12 (Good)
12 (Good)
9.7 (Good)
9.7 (Good)
12 (Good)
data source »
Tongling Che Zhan Xin Qu
Friday, May 27, 2022, 12:00 PM
PM10 6.7 (Good)
particulate matter (PM10) suspended dust
PM2,5 1.7 (Good)
particulate matter (PM2.5) dust
CO 100 (Good)
carbon monoxide (CO)
NO2 7.6 (Good)
nitrogen dioxide (NO2)
O3 0.02 (Good)
ozone (O3)
SO2 8.6 (Good)
sulfur dioxide (SO2)
Tongling Che Zhan Xin Qu
index
2022-05-27
pm10
32
pm25
24
co
468
no2
21
o3
32
so2
4.6
车站新区
2018-10 2020-05

index
2020-05
2020-04
2020-03
2020-02
2020-01
2019-12
2019-11
2019-10
2019-09
2019-08
2019-07
2019-06
2019-05
2019-04
2019-03
2019-02
2019-01
2018-12
2018-11
2018-10
pm25
26
31
36
39
62
61
47
43
31
22
22
25
35
41
54
59
85
58
53
42
co
598
638
768
830
802
920
774
814
604
404
518
519
611
682
736
1
1
932
829
745
no2
27
36
33
25
37
53
47
39
26
21
23
23
29
34
38
30
48
42
45
44
o3
122
122
101
92
81
79
97
108
145
150
140
152
139
116
99
63
68
56
73
83
pm10
59
71
66
55
75
82
90
88
61
44
47
48
67
71
86
72
102
83
66
65
so2
13
11
9.9
9.8
10
9.8
9.3
8.9
11
11
9.9
11
9.3
10
12
12
12
9.7
9.7
12
* Pollution data source:
https://openaq.org
(ChinaAQIData)
The data is licensed under CC-By 4.0
PM10 7 (Good)
PM2,5 2 (Good)
CO 100 (Good)
NO2 8 (Good)
O3 0 (Good)
SO2 9 (Good)
Data on air pollution from recent days in Chaitangcun
| index | 2022-05-27 |
|---|---|
| pm10 | 32 Moderate |
| pm25 | 24 Moderate |
| co | 468 Good |
| no2 | 21 Good |
| o3 | 32 Good |
| so2 | 5 Good |

| index | 2020-05 | 2020-04 | 2020-03 | 2020-02 | 2020-01 | 2019-12 | 2019-11 | 2019-10 | 2019-09 | 2019-08 | 2019-07 | 2019-06 | 2019-05 | 2019-04 | 2019-03 | 2019-02 | 2019-01 | 2018-12 | 2018-11 | 2018-10 |
|---|---|---|---|---|---|---|---|---|---|---|---|---|---|---|---|---|---|---|---|---|
| pm25 | 26 (Moderate) | 31 (Moderate) | 36 (Unhealthy for Sensitive Groups) | 39 (Unhealthy for Sensitive Groups) | 62 (Unhealthy) | 61 (Unhealthy) | 47 (Unhealthy for Sensitive Groups) | 43 (Unhealthy for Sensitive Groups) | 31 (Moderate) | 22 (Moderate) | 22 (Moderate) | 25 (Moderate) | 35 (Unhealthy for Sensitive Groups) | 41 (Unhealthy for Sensitive Groups) | 54 (Unhealthy for Sensitive Groups) | 59 (Unhealthy) | 85 (Very Unhealthy) | 58 (Unhealthy) | 53 (Unhealthy for Sensitive Groups) | 42 (Unhealthy for Sensitive Groups) |
| co | 598 (Good) | 638 (Good) | 768 (Good) | 830 (Good) | 802 (Good) | 920 (Good) | 774 (Good) | 814 (Good) | 604 (Good) | 404 (Good) | 518 (Good) | 519 (Good) | 611 (Good) | 682 (Good) | 736 (Good) | 1 (Good) | 1 (Good) | 932 (Good) | 829 (Good) | 745 (Good) |
| no2 | 27 (Good) | 36 (Good) | 33 (Good) | 25 (Good) | 37 (Good) | 53 (Moderate) | 47 (Moderate) | 39 (Good) | 26 (Good) | 21 (Good) | 23 (Good) | 23 (Good) | 29 (Good) | 34 (Good) | 38 (Good) | 30 (Good) | 48 (Moderate) | 42 (Moderate) | 45 (Moderate) | 44 (Moderate) |
| o3 | 122 (Unhealthy for Sensitive Groups) | 122 (Unhealthy for Sensitive Groups) | 101 (Moderate) | 92 (Moderate) | 81 (Moderate) | 79 (Moderate) | 97 (Moderate) | 108 (Moderate) | 145 (Unhealthy for Sensitive Groups) | 150 (Unhealthy) | 140 (Unhealthy for Sensitive Groups) | 152 (Unhealthy) | 139 (Unhealthy for Sensitive Groups) | 116 (Moderate) | 99 (Moderate) | 63 (Good) | 68 (Good) | 56 (Good) | 73 (Moderate) | 83 (Moderate) |
| pm10 | 59 (Unhealthy for Sensitive Groups) | 71 (Unhealthy for Sensitive Groups) | 66 (Unhealthy for Sensitive Groups) | 55 (Unhealthy for Sensitive Groups) | 75 (Unhealthy for Sensitive Groups) | 82 (Unhealthy) | 90 (Unhealthy) | 88 (Unhealthy) | 61 (Unhealthy for Sensitive Groups) | 44 (Moderate) | 47 (Moderate) | 48 (Moderate) | 67 (Unhealthy for Sensitive Groups) | 71 (Unhealthy for Sensitive Groups) | 86 (Unhealthy) | 72 (Unhealthy for Sensitive Groups) | 102 (Unhealthy) | 83 (Unhealthy) | 66 (Unhealthy for Sensitive Groups) | 65 (Unhealthy for Sensitive Groups) |
| so2 | 13 (Good) | 11 (Good) | 9.9 (Good) | 9.8 (Good) | 10 (Good) | 9.8 (Good) | 9.3 (Good) | 8.9 (Good) | 11 (Good) | 11 (Good) | 9.9 (Good) | 11 (Good) | 9.3 (Good) | 10 (Good) | 12 (Good) | 12 (Good) | 12 (Good) | 9.7 (Good) | 9.7 (Good) | 12 (Good) |
PM10 6.7 (Good)
particulate matter (PM10) suspended dustPM2,5 1.7 (Good)
particulate matter (PM2.5) dustCO 100 (Good)
carbon monoxide (CO)NO2 7.6 (Good)
nitrogen dioxide (NO2)O3 0.02 (Good)
ozone (O3)SO2 8.6 (Good)
sulfur dioxide (SO2)Tongling Che Zhan Xin Qu
| index | 2022-05-27 |
|---|---|
| pm10 | 32 |
| pm25 | 24 |
| co | 468 |
| no2 | 21 |
| o3 | 32 |
| so2 | 4.6 |
车站新区
| index | 2020-05 | 2020-04 | 2020-03 | 2020-02 | 2020-01 | 2019-12 | 2019-11 | 2019-10 | 2019-09 | 2019-08 | 2019-07 | 2019-06 | 2019-05 | 2019-04 | 2019-03 | 2019-02 | 2019-01 | 2018-12 | 2018-11 | 2018-10 |
|---|---|---|---|---|---|---|---|---|---|---|---|---|---|---|---|---|---|---|---|---|
| pm25 | 26 | 31 | 36 | 39 | 62 | 61 | 47 | 43 | 31 | 22 | 22 | 25 | 35 | 41 | 54 | 59 | 85 | 58 | 53 | 42 |
| co | 598 | 638 | 768 | 830 | 802 | 920 | 774 | 814 | 604 | 404 | 518 | 519 | 611 | 682 | 736 | 1 | 1 | 932 | 829 | 745 |
| no2 | 27 | 36 | 33 | 25 | 37 | 53 | 47 | 39 | 26 | 21 | 23 | 23 | 29 | 34 | 38 | 30 | 48 | 42 | 45 | 44 |
| o3 | 122 | 122 | 101 | 92 | 81 | 79 | 97 | 108 | 145 | 150 | 140 | 152 | 139 | 116 | 99 | 63 | 68 | 56 | 73 | 83 |
| pm10 | 59 | 71 | 66 | 55 | 75 | 82 | 90 | 88 | 61 | 44 | 47 | 48 | 67 | 71 | 86 | 72 | 102 | 83 | 66 | 65 |
| so2 | 13 | 11 | 9.9 | 9.8 | 10 | 9.8 | 9.3 | 8.9 | 11 | 11 | 9.9 | 11 | 9.3 | 10 | 12 | 12 | 12 | 9.7 | 9.7 | 12 |