Air Pollution in Liaoyuancun: Real-time Air Quality Index and smog alert.
Pollution and air quality forecast for Liaoyuancun. Today is Tuesday, June 16, 2026. The following air pollution values have been recorded for Liaoyuancun:- particulate matter (PM10) suspended dust - 7 (Good)
- particulate matter (PM2.5) dust - 2 (Good)
- carbon monoxide (CO) - 100 (Good)
- nitrogen dioxide (NO2) - 8 (Good)
- ozone (O3) - 0 (Good)
- sulfur dioxide (SO2) - 9 (Good)

What is the air quality in Liaoyuancun today? Is the air polluted in Liaoyuancun?. Is there smog?
What is the level of PM10 today in Liaoyuancun? (particulate matter (PM10) suspended dust)
The current level of particulate matter PM10 in Liaoyuancun is:
7 (Good)
The highest PM10 values usually occur in month: 110 (January 2019).
The lowest value of particulate matter PM10 pollution in Liaoyuancun is usually recorded in: August (36).
What is the current level of PM2.5 in Liaoyuancun? (particulate matter (PM2.5) dust)
Today's PM2.5 level is:
2 (Good)
For comparison, the highest level of PM2.5 in Liaoyuancun in the last 7 days was: 24 (Friday, May 27, 2022) and the lowest: 24 (Friday, May 27, 2022).
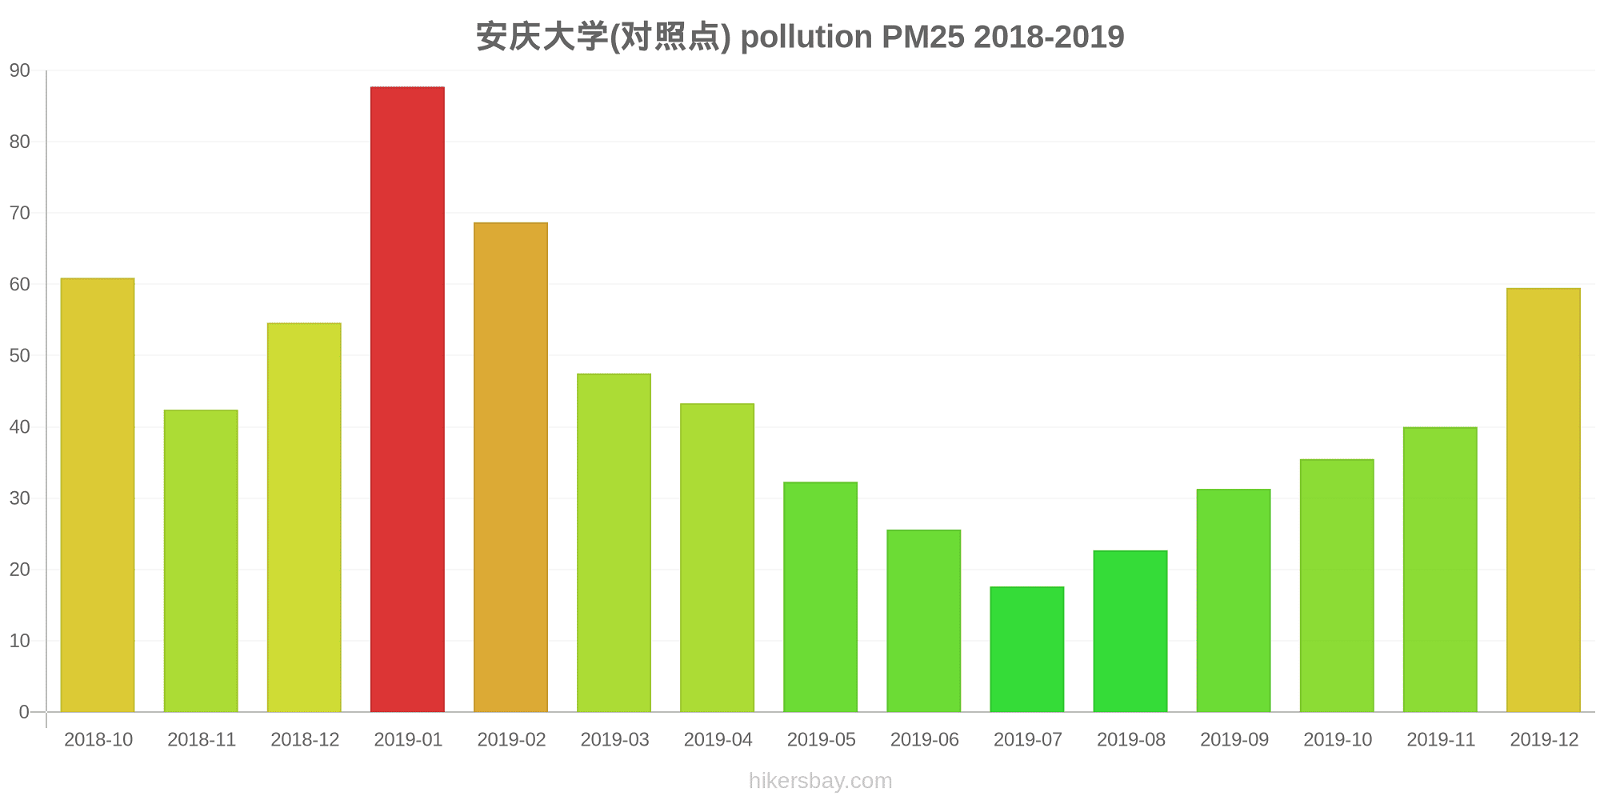
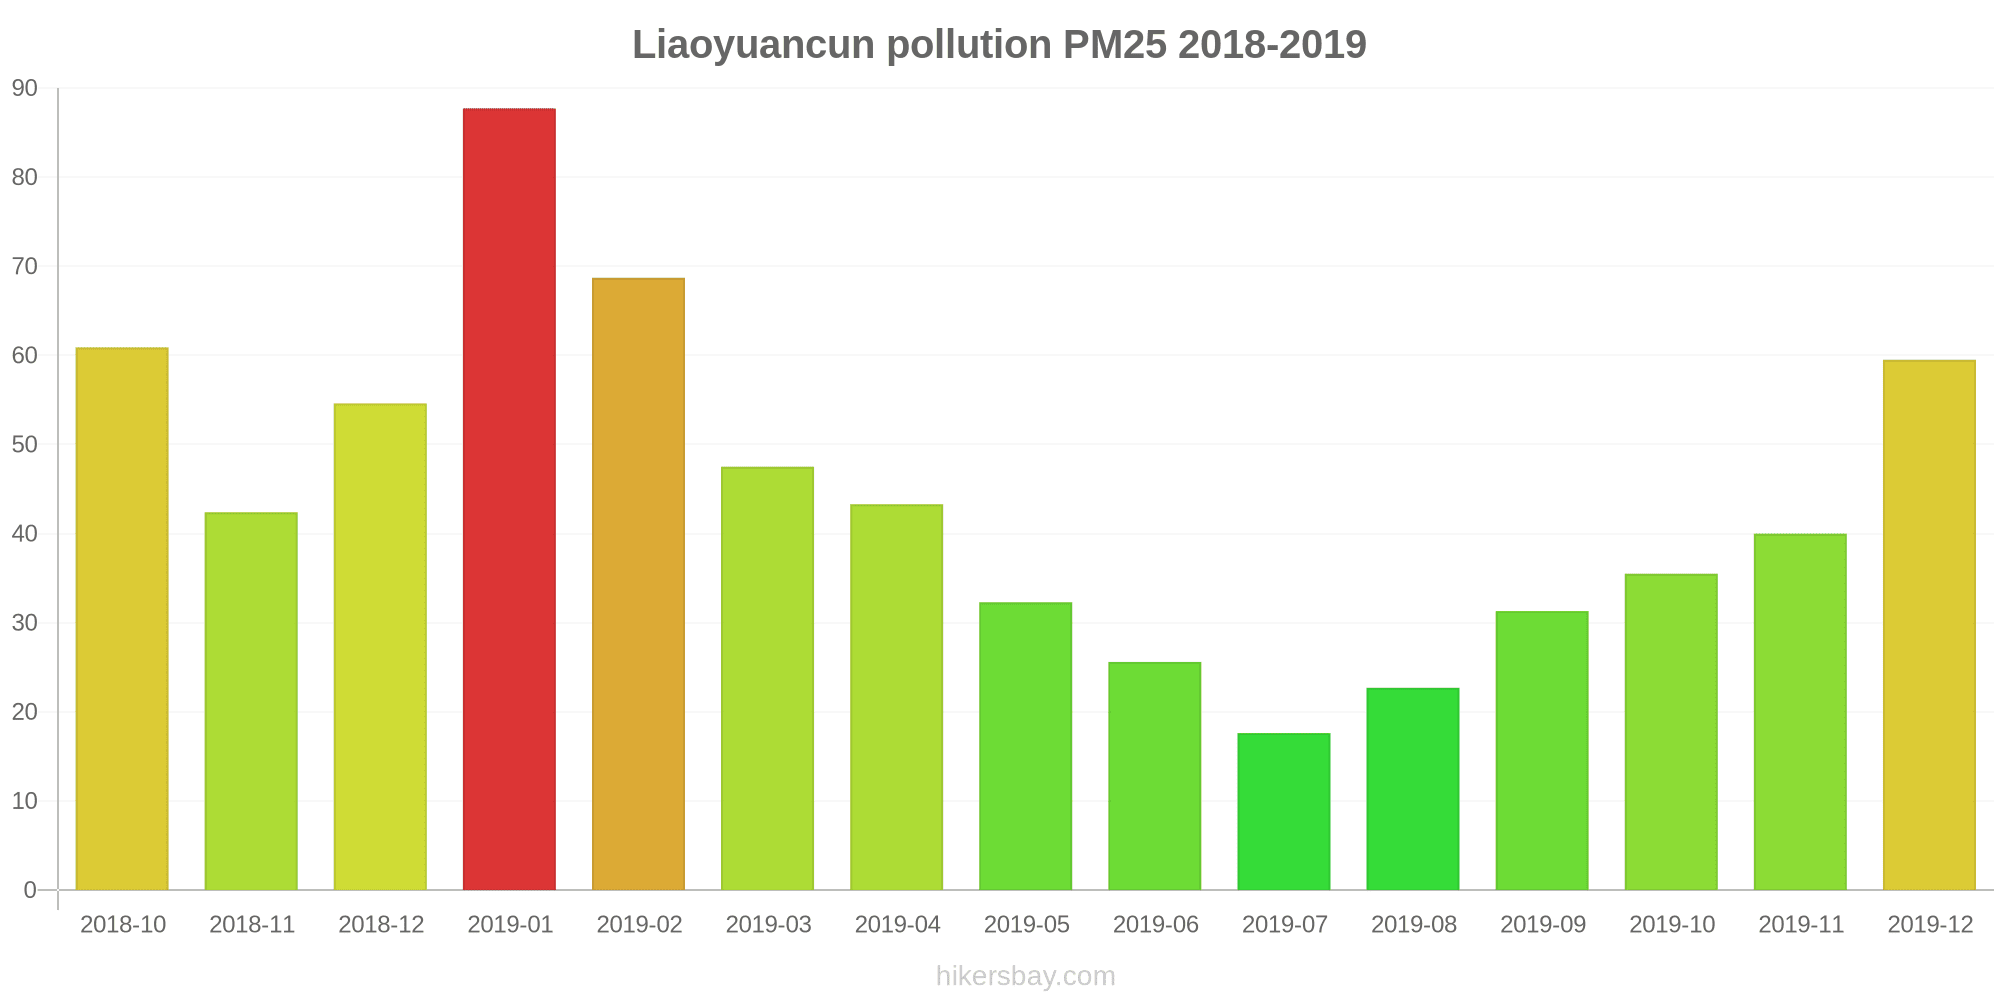
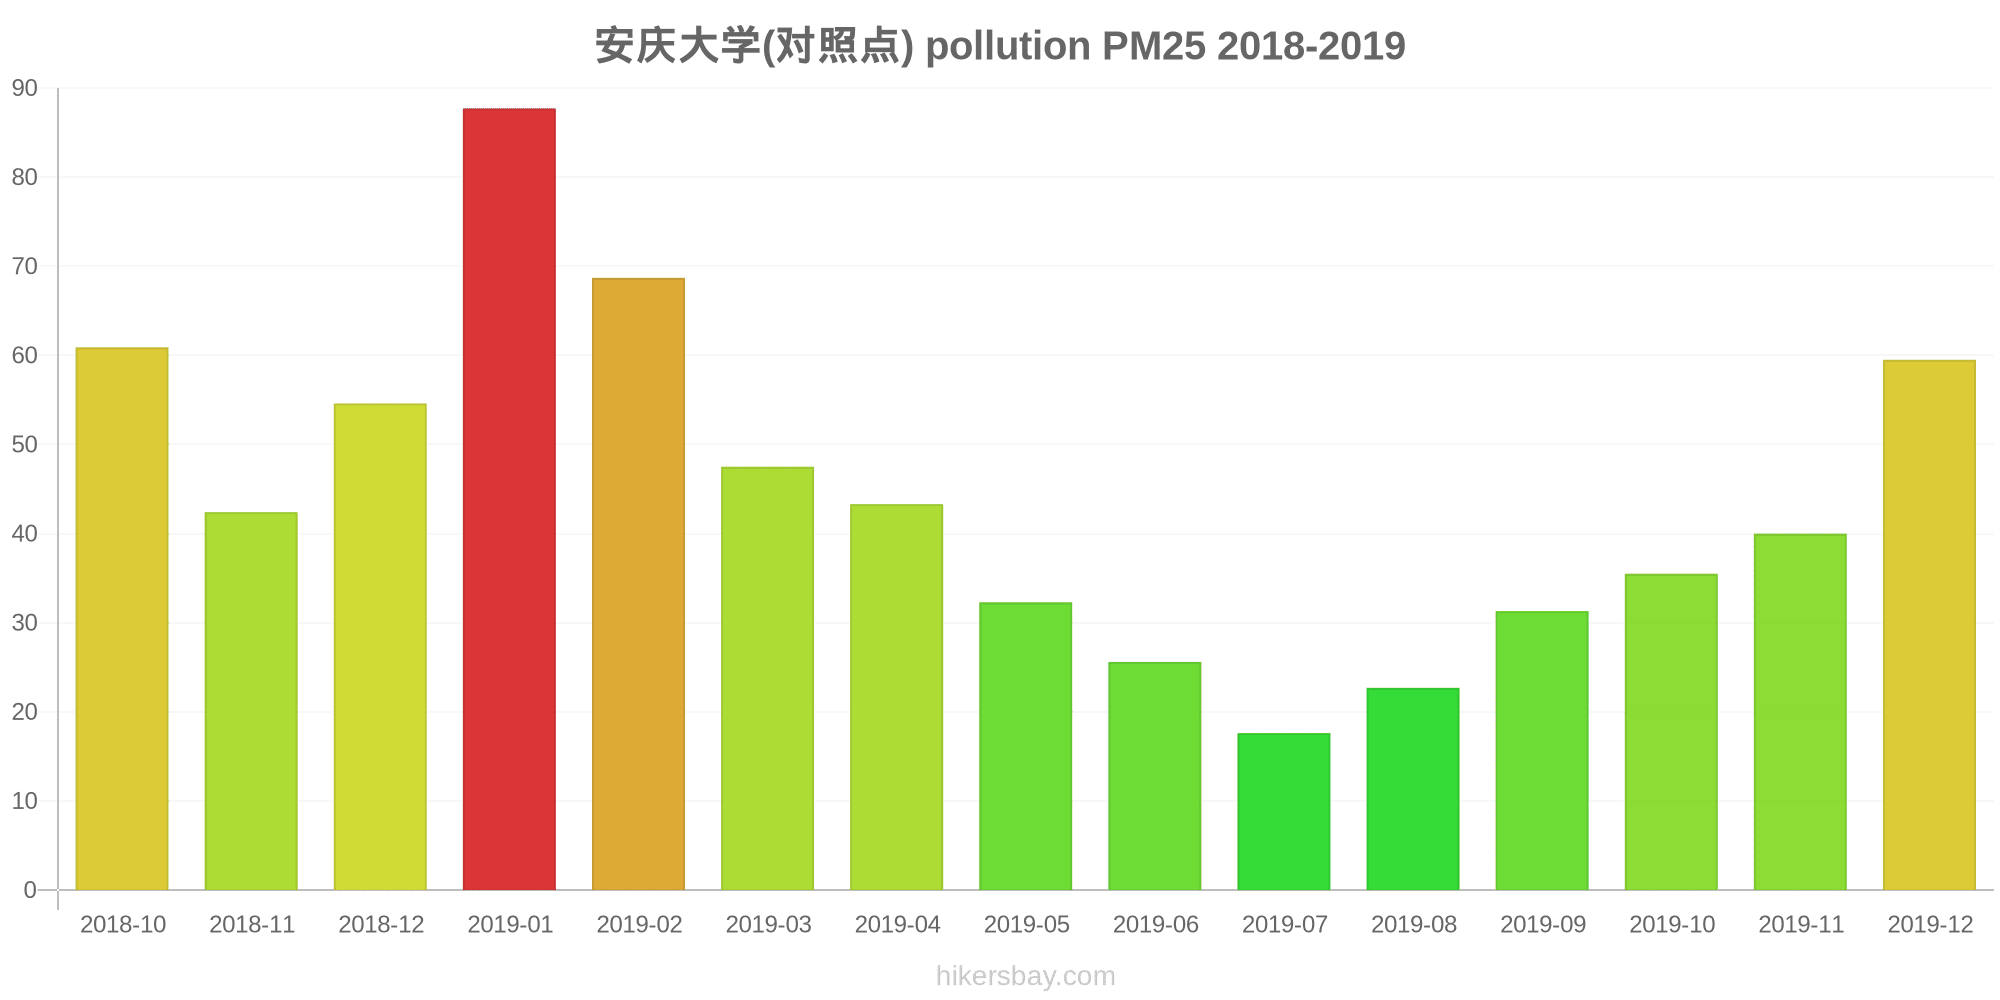
The highest PM2.5 values were recorded: 88 (January 2019).
The lowest level of particulate matter PM2.5 pollution occurs in month: July (18).
How high is the CO level? (carbon monoxide (CO))
100 (Good)
How high is the level of NO2? (nitrogen dioxide (NO2))
8 (Good)
How is the O3 level today in Liaoyuancun? (ozone (O3))
0 (Good)
What is the level of SO2 pollution? (sulfur dioxide (SO2))
9 (Good)
Current data Friday, May 27, 2022, 12:00 PM
PM10 7 (Good)
PM2,5 2 (Good)
CO 100 (Good)
NO2 8 (Good)
O3 0 (Good)
SO2 9 (Good)
Data on air pollution from recent days in Liaoyuancun
index
2022-05-27
pm10
32
Moderate
pm25
24
Moderate
co
468
Good
no2
21
Good
o3
32
Good
so2
5
Good
data source »
Air pollution in Liaoyuancun from October 2018 to December 2019

index
2019-12
2019-11
2019-10
2019-09
2019-08
2019-07
2019-06
2019-05
2019-04
2019-03
2019-02
2019-01
2018-12
2018-11
2018-10
pm25
60 (Unhealthy)
40 (Unhealthy for Sensitive Groups)
36 (Unhealthy for Sensitive Groups)
31 (Moderate)
23 (Moderate)
18 (Moderate)
26 (Moderate)
32 (Moderate)
43 (Unhealthy for Sensitive Groups)
48 (Unhealthy for Sensitive Groups)
69 (Unhealthy)
88 (Very Unhealthy)
55 (Unhealthy for Sensitive Groups)
42 (Unhealthy for Sensitive Groups)
61 (Unhealthy)
co
751 (Good)
724 (Good)
720 (Good)
583 (Good)
642 (Good)
600 (Good)
657 (Good)
618 (Good)
585 (Good)
787 (Good)
880 (Good)
1 (Good)
882 (Good)
789 (Good)
714 (Good)
no2
39 (Good)
31 (Good)
24 (Good)
14 (Good)
11 (Good)
13 (Good)
17 (Good)
19 (Good)
22 (Good)
26 (Good)
17 (Good)
32 (Good)
24 (Good)
25 (Good)
24 (Good)
o3
81 (Moderate)
119 (Moderate)
134 (Unhealthy for Sensitive Groups)
175 (Unhealthy)
156 (Unhealthy)
139 (Unhealthy for Sensitive Groups)
162 (Unhealthy)
165 (Unhealthy)
133 (Unhealthy for Sensitive Groups)
119 (Moderate)
75 (Moderate)
69 (Good)
68 (Good)
101 (Moderate)
125 (Unhealthy for Sensitive Groups)
pm10
86 (Unhealthy)
75 (Unhealthy for Sensitive Groups)
65 (Unhealthy for Sensitive Groups)
49 (Moderate)
36 (Moderate)
36 (Moderate)
39 (Moderate)
60 (Unhealthy for Sensitive Groups)
57 (Unhealthy for Sensitive Groups)
79 (Unhealthy for Sensitive Groups)
85 (Unhealthy)
110 (Very Unhealthy)
82 (Unhealthy)
63 (Unhealthy for Sensitive Groups)
71 (Unhealthy for Sensitive Groups)
so2
6.7 (Good)
7 (Good)
8.7 (Good)
8.8 (Good)
5.4 (Good)
6.3 (Good)
7 (Good)
8.2 (Good)
7.6 (Good)
8.6 (Good)
6.9 (Good)
8.4 (Good)
7.5 (Good)
6.8 (Good)
7.4 (Good)
data source »
安庆大学(191227更为评价点)
Friday, May 27, 2022, 12:00 PM
PM10 6.7 (Good)
particulate matter (PM10) suspended dust
PM2,5 1.7 (Good)
particulate matter (PM2.5) dust
CO 100 (Good)
carbon monoxide (CO)
NO2 7.6 (Good)
nitrogen dioxide (NO2)
O3 0.02 (Good)
ozone (O3)
SO2 8.6 (Good)
sulfur dioxide (SO2)
安庆大学(191227更为评价点)
index
2022-05-27
pm10
32
pm25
24
co
468
no2
21
o3
32
so2
4.6
安庆大学(对照点)
2018-10 2019-12
index
2019-12
2019-11
2019-10
2019-09
2019-08
2019-07
2019-06
2019-05
2019-04
2019-03
2019-02
2019-01
2018-12
2018-11
2018-10
pm25
60
40
36
31
23
18
26
32
43
48
69
88
55
42
61
co
751
724
720
583
642
600
657
618
585
787
880
1
882
789
714
no2
39
31
24
14
11
13
17
19
22
26
17
32
24
25
24
o3
81
119
134
175
156
139
162
165
133
119
75
69
68
101
125
pm10
86
75
65
49
36
36
39
60
57
79
85
110
82
63
71
so2
6.7
7
8.7
8.8
5.4
6.3
7
8.2
7.6
8.6
6.9
8.4
7.5
6.8
7.4
* Pollution data source:
https://openaq.org
(ChinaAQIData)
The data is licensed under CC-By 4.0
PM10 7 (Good)
PM2,5 2 (Good)
CO 100 (Good)
NO2 8 (Good)
O3 0 (Good)
SO2 9 (Good)
Data on air pollution from recent days in Liaoyuancun
| index | 2022-05-27 |
|---|---|
| pm10 | 32 Moderate |
| pm25 | 24 Moderate |
| co | 468 Good |
| no2 | 21 Good |
| o3 | 32 Good |
| so2 | 5 Good |
| index | 2019-12 | 2019-11 | 2019-10 | 2019-09 | 2019-08 | 2019-07 | 2019-06 | 2019-05 | 2019-04 | 2019-03 | 2019-02 | 2019-01 | 2018-12 | 2018-11 | 2018-10 |
|---|---|---|---|---|---|---|---|---|---|---|---|---|---|---|---|
| pm25 | 60 (Unhealthy) | 40 (Unhealthy for Sensitive Groups) | 36 (Unhealthy for Sensitive Groups) | 31 (Moderate) | 23 (Moderate) | 18 (Moderate) | 26 (Moderate) | 32 (Moderate) | 43 (Unhealthy for Sensitive Groups) | 48 (Unhealthy for Sensitive Groups) | 69 (Unhealthy) | 88 (Very Unhealthy) | 55 (Unhealthy for Sensitive Groups) | 42 (Unhealthy for Sensitive Groups) | 61 (Unhealthy) |
| co | 751 (Good) | 724 (Good) | 720 (Good) | 583 (Good) | 642 (Good) | 600 (Good) | 657 (Good) | 618 (Good) | 585 (Good) | 787 (Good) | 880 (Good) | 1 (Good) | 882 (Good) | 789 (Good) | 714 (Good) |
| no2 | 39 (Good) | 31 (Good) | 24 (Good) | 14 (Good) | 11 (Good) | 13 (Good) | 17 (Good) | 19 (Good) | 22 (Good) | 26 (Good) | 17 (Good) | 32 (Good) | 24 (Good) | 25 (Good) | 24 (Good) |
| o3 | 81 (Moderate) | 119 (Moderate) | 134 (Unhealthy for Sensitive Groups) | 175 (Unhealthy) | 156 (Unhealthy) | 139 (Unhealthy for Sensitive Groups) | 162 (Unhealthy) | 165 (Unhealthy) | 133 (Unhealthy for Sensitive Groups) | 119 (Moderate) | 75 (Moderate) | 69 (Good) | 68 (Good) | 101 (Moderate) | 125 (Unhealthy for Sensitive Groups) |
| pm10 | 86 (Unhealthy) | 75 (Unhealthy for Sensitive Groups) | 65 (Unhealthy for Sensitive Groups) | 49 (Moderate) | 36 (Moderate) | 36 (Moderate) | 39 (Moderate) | 60 (Unhealthy for Sensitive Groups) | 57 (Unhealthy for Sensitive Groups) | 79 (Unhealthy for Sensitive Groups) | 85 (Unhealthy) | 110 (Very Unhealthy) | 82 (Unhealthy) | 63 (Unhealthy for Sensitive Groups) | 71 (Unhealthy for Sensitive Groups) |
| so2 | 6.7 (Good) | 7 (Good) | 8.7 (Good) | 8.8 (Good) | 5.4 (Good) | 6.3 (Good) | 7 (Good) | 8.2 (Good) | 7.6 (Good) | 8.6 (Good) | 6.9 (Good) | 8.4 (Good) | 7.5 (Good) | 6.8 (Good) | 7.4 (Good) |
PM10 6.7 (Good)
particulate matter (PM10) suspended dustPM2,5 1.7 (Good)
particulate matter (PM2.5) dustCO 100 (Good)
carbon monoxide (CO)NO2 7.6 (Good)
nitrogen dioxide (NO2)O3 0.02 (Good)
ozone (O3)SO2 8.6 (Good)
sulfur dioxide (SO2)安庆大学(191227更为评价点)
| index | 2022-05-27 |
|---|---|
| pm10 | 32 |
| pm25 | 24 |
| co | 468 |
| no2 | 21 |
| o3 | 32 |
| so2 | 4.6 |
安庆大学(对照点)
| index | 2019-12 | 2019-11 | 2019-10 | 2019-09 | 2019-08 | 2019-07 | 2019-06 | 2019-05 | 2019-04 | 2019-03 | 2019-02 | 2019-01 | 2018-12 | 2018-11 | 2018-10 |
|---|---|---|---|---|---|---|---|---|---|---|---|---|---|---|---|
| pm25 | 60 | 40 | 36 | 31 | 23 | 18 | 26 | 32 | 43 | 48 | 69 | 88 | 55 | 42 | 61 |
| co | 751 | 724 | 720 | 583 | 642 | 600 | 657 | 618 | 585 | 787 | 880 | 1 | 882 | 789 | 714 |
| no2 | 39 | 31 | 24 | 14 | 11 | 13 | 17 | 19 | 22 | 26 | 17 | 32 | 24 | 25 | 24 |
| o3 | 81 | 119 | 134 | 175 | 156 | 139 | 162 | 165 | 133 | 119 | 75 | 69 | 68 | 101 | 125 |
| pm10 | 86 | 75 | 65 | 49 | 36 | 36 | 39 | 60 | 57 | 79 | 85 | 110 | 82 | 63 | 71 |
| so2 | 6.7 | 7 | 8.7 | 8.8 | 5.4 | 6.3 | 7 | 8.2 | 7.6 | 8.6 | 6.9 | 8.4 | 7.5 | 6.8 | 7.4 |