Air Pollution in Xinxian: Real-time Air Quality Index and smog alert.
Pollution and air quality forecast for Xinxian. Today is Tuesday, June 2, 2026. The following air pollution values have been recorded for Xinxian:- particulate matter (PM10) suspended dust - 7 (Good)
- particulate matter (PM2.5) dust - 2 (Good)
- carbon monoxide (CO) - 100 (Good)
- nitrogen dioxide (NO2) - 8 (Good)
- ozone (O3) - 0 (Good)
- sulfur dioxide (SO2) - 9 (Good)

What is the air quality in Xinxian today? Is the air polluted in Xinxian?. Is there smog?
What is the level of PM10 today in Xinxian? (particulate matter (PM10) suspended dust)
The current level of particulate matter PM10 in Xinxian is:
7 (Good)
The highest PM10 values usually occur in month: 177 (May 2019).
The lowest value of particulate matter PM10 pollution in Xinxian is usually recorded in: July (49).
What is the current level of PM2.5 in Xinxian? (particulate matter (PM2.5) dust)
Today's PM2.5 level is:
2 (Good)
For comparison, the highest level of PM2.5 in Xinxian in the last 7 days was: 24 (Friday, May 27, 2022) and the lowest: 24 (Friday, May 27, 2022).
The highest PM2.5 values were recorded: 75 (January 2020).
The lowest level of particulate matter PM2.5 pollution occurs in month: July (19).
How high is the CO level? (carbon monoxide (CO))
100 (Good)
How high is the level of NO2? (nitrogen dioxide (NO2))
8 (Good)
How is the O3 level today in Xinxian? (ozone (O3))
0 (Good)
What is the level of SO2 pollution? (sulfur dioxide (SO2))
9 (Good)
Current data Friday, May 27, 2022, 12:00 PM
PM10 7 (Good)
PM2,5 2 (Good)
CO 100 (Good)
NO2 8 (Good)
O3 0 (Good)
SO2 9 (Good)
Data on air pollution from recent days in Xinxian
index
2022-05-27
pm10
32
Moderate
pm25
24
Moderate
co
468
Good
no2
21
Good
o3
32
Good
so2
5
Good
data source »
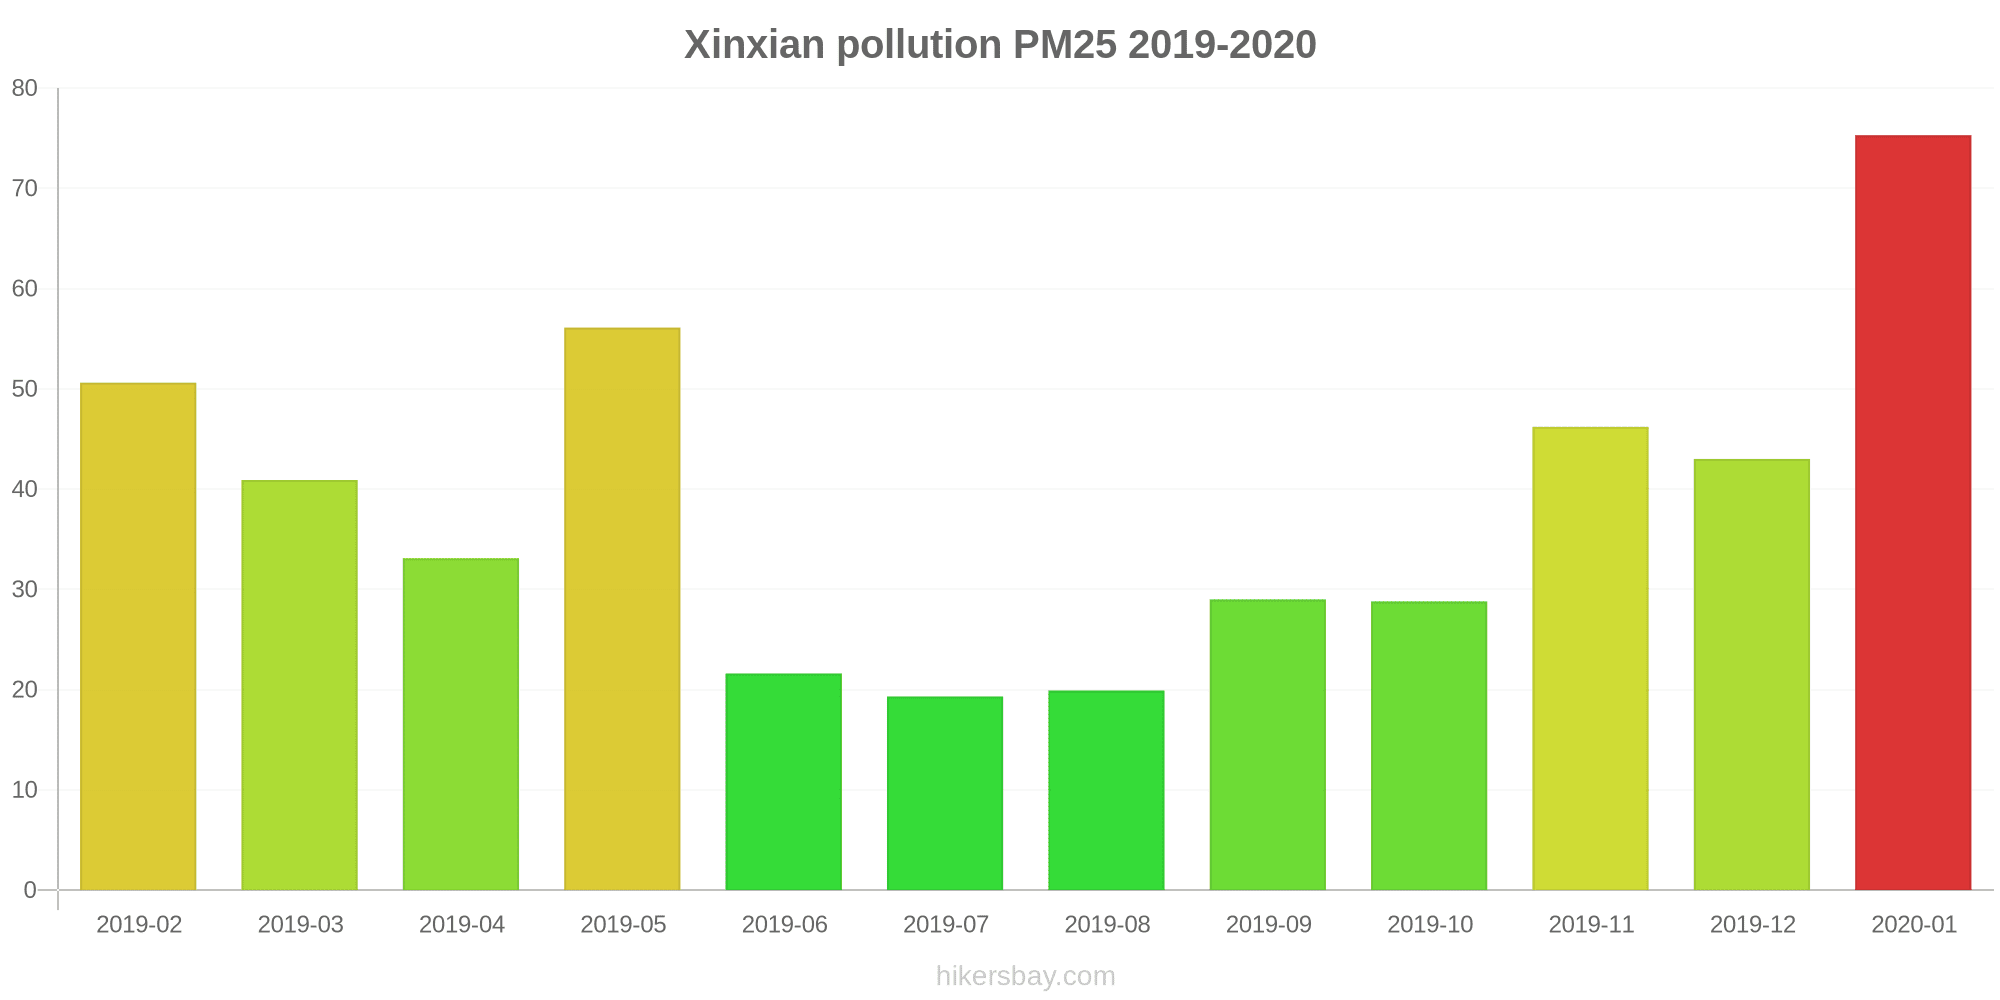
Air pollution in Xinxian from February 2019 to January 2020

index
2020-01
2019-12
2019-11
2019-10
2019-09
2019-08
2019-07
2019-06
2019-05
2019-04
2019-03
2019-02
pm25
75 (Very Unhealthy)
43 (Unhealthy for Sensitive Groups)
46 (Unhealthy for Sensitive Groups)
29 (Moderate)
29 (Moderate)
20 (Moderate)
19 (Moderate)
22 (Moderate)
56 (Unhealthy)
33 (Moderate)
41 (Unhealthy for Sensitive Groups)
51 (Unhealthy for Sensitive Groups)
co
1 (Good)
1 (Good)
1 (Good)
605 (Good)
427 (Good)
356 (Good)
318 (Good)
226 (Good)
351 (Good)
428 (Good)
686 (Good)
874 (Good)
no2
36 (Good)
38 (Good)
34 (Good)
23 (Good)
24 (Good)
18 (Good)
21 (Good)
17 (Good)
18 (Good)
24 (Good)
25 (Good)
22 (Good)
o3
89 (Moderate)
90 (Moderate)
95 (Moderate)
97 (Moderate)
122 (Unhealthy for Sensitive Groups)
132 (Unhealthy for Sensitive Groups)
139 (Unhealthy for Sensitive Groups)
129 (Unhealthy for Sensitive Groups)
132 (Unhealthy for Sensitive Groups)
124 (Unhealthy for Sensitive Groups)
113 (Moderate)
100 (Moderate)
pm10
85 (Unhealthy)
66 (Unhealthy for Sensitive Groups)
76 (Unhealthy for Sensitive Groups)
61 (Unhealthy for Sensitive Groups)
73 (Unhealthy for Sensitive Groups)
49 (Moderate)
49 (Moderate)
55 (Unhealthy for Sensitive Groups)
177 (Very bad Hazardous)
111 (Very Unhealthy)
114 (Very Unhealthy)
121 (Very Unhealthy)
so2
18 (Good)
17 (Good)
13 (Good)
4.8 (Good)
3.5 (Good)
6.4 (Good)
5.5 (Good)
4 (Good)
4.3 (Good)
7.4 (Good)
9.9 (Good)
12 (Good)
data source »
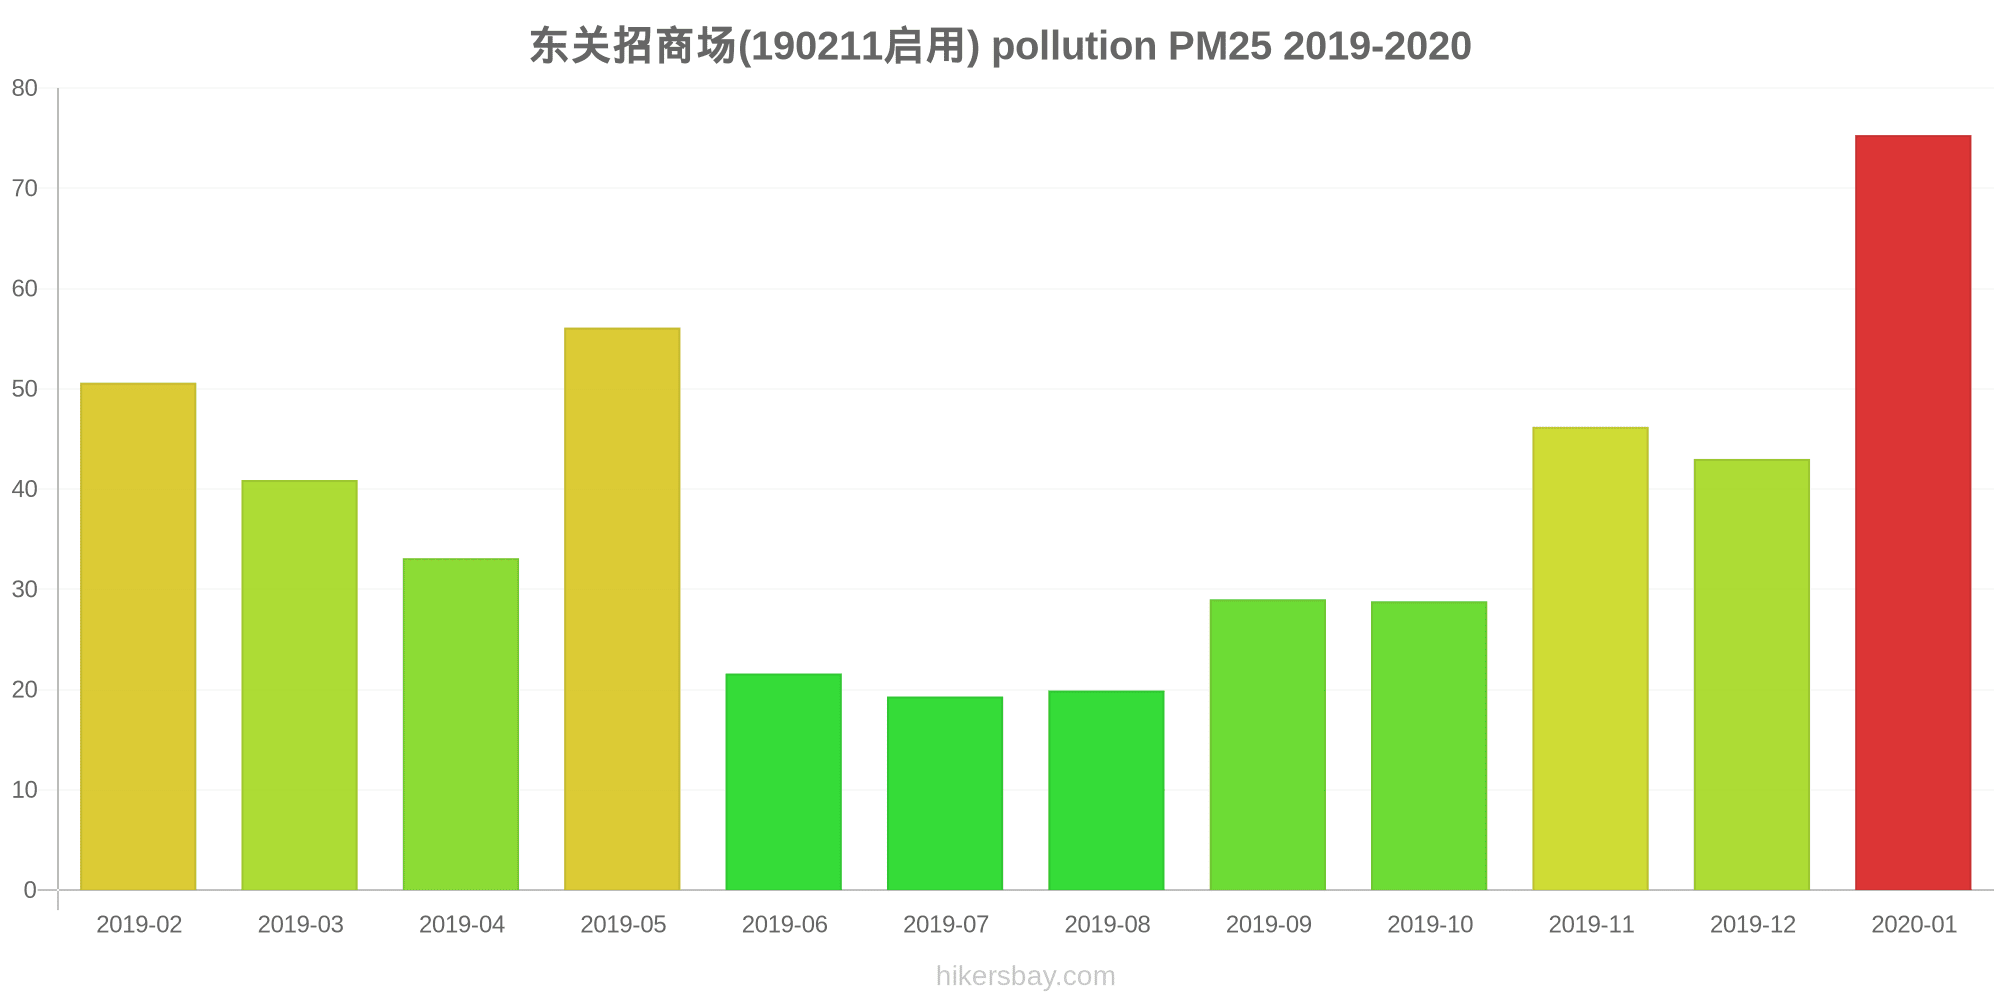
东关招商场(190211启用)
Friday, May 27, 2022, 12:00 PM
PM10 6.7 (Good)
particulate matter (PM10) suspended dust
PM2,5 1.7 (Good)
particulate matter (PM2.5) dust
CO 100 (Good)
carbon monoxide (CO)
NO2 7.6 (Good)
nitrogen dioxide (NO2)
O3 0.02 (Good)
ozone (O3)
SO2 8.6 (Good)
sulfur dioxide (SO2)
东关招商场(190211启用)
index
2022-05-27
pm10
32
pm25
24
co
468
no2
21
o3
32
so2
4.6
东关招商场(190211启用)
2019-02 2020-01

index
2020-01
2019-12
2019-11
2019-10
2019-09
2019-08
2019-07
2019-06
2019-05
2019-04
2019-03
2019-02
pm25
75
43
46
29
29
20
19
22
56
33
41
51
co
1
1
1
605
427
356
318
226
351
428
686
874
no2
36
38
34
23
24
18
21
17
18
24
25
22
o3
89
90
95
97
122
132
139
129
132
124
113
100
pm10
85
66
76
61
73
49
49
55
177
111
114
121
so2
18
17
13
4.8
3.5
6.4
5.5
4
4.3
7.4
9.9
12
* Pollution data source:
https://openaq.org
()
The data is licensed under CC-By 4.0
PM10 7 (Good)
PM2,5 2 (Good)
CO 100 (Good)
NO2 8 (Good)
O3 0 (Good)
SO2 9 (Good)
Data on air pollution from recent days in Xinxian
| index | 2022-05-27 |
|---|---|
| pm10 | 32 Moderate |
| pm25 | 24 Moderate |
| co | 468 Good |
| no2 | 21 Good |
| o3 | 32 Good |
| so2 | 5 Good |
| index | 2020-01 | 2019-12 | 2019-11 | 2019-10 | 2019-09 | 2019-08 | 2019-07 | 2019-06 | 2019-05 | 2019-04 | 2019-03 | 2019-02 |
|---|---|---|---|---|---|---|---|---|---|---|---|---|
| pm25 | 75 (Very Unhealthy) | 43 (Unhealthy for Sensitive Groups) | 46 (Unhealthy for Sensitive Groups) | 29 (Moderate) | 29 (Moderate) | 20 (Moderate) | 19 (Moderate) | 22 (Moderate) | 56 (Unhealthy) | 33 (Moderate) | 41 (Unhealthy for Sensitive Groups) | 51 (Unhealthy for Sensitive Groups) |
| co | 1 (Good) | 1 (Good) | 1 (Good) | 605 (Good) | 427 (Good) | 356 (Good) | 318 (Good) | 226 (Good) | 351 (Good) | 428 (Good) | 686 (Good) | 874 (Good) |
| no2 | 36 (Good) | 38 (Good) | 34 (Good) | 23 (Good) | 24 (Good) | 18 (Good) | 21 (Good) | 17 (Good) | 18 (Good) | 24 (Good) | 25 (Good) | 22 (Good) |
| o3 | 89 (Moderate) | 90 (Moderate) | 95 (Moderate) | 97 (Moderate) | 122 (Unhealthy for Sensitive Groups) | 132 (Unhealthy for Sensitive Groups) | 139 (Unhealthy for Sensitive Groups) | 129 (Unhealthy for Sensitive Groups) | 132 (Unhealthy for Sensitive Groups) | 124 (Unhealthy for Sensitive Groups) | 113 (Moderate) | 100 (Moderate) |
| pm10 | 85 (Unhealthy) | 66 (Unhealthy for Sensitive Groups) | 76 (Unhealthy for Sensitive Groups) | 61 (Unhealthy for Sensitive Groups) | 73 (Unhealthy for Sensitive Groups) | 49 (Moderate) | 49 (Moderate) | 55 (Unhealthy for Sensitive Groups) | 177 (Very bad Hazardous) | 111 (Very Unhealthy) | 114 (Very Unhealthy) | 121 (Very Unhealthy) |
| so2 | 18 (Good) | 17 (Good) | 13 (Good) | 4.8 (Good) | 3.5 (Good) | 6.4 (Good) | 5.5 (Good) | 4 (Good) | 4.3 (Good) | 7.4 (Good) | 9.9 (Good) | 12 (Good) |
PM10 6.7 (Good)
particulate matter (PM10) suspended dustPM2,5 1.7 (Good)
particulate matter (PM2.5) dustCO 100 (Good)
carbon monoxide (CO)NO2 7.6 (Good)
nitrogen dioxide (NO2)O3 0.02 (Good)
ozone (O3)SO2 8.6 (Good)
sulfur dioxide (SO2)东关招商场(190211启用)
| index | 2022-05-27 |
|---|---|
| pm10 | 32 |
| pm25 | 24 |
| co | 468 |
| no2 | 21 |
| o3 | 32 |
| so2 | 4.6 |
东关招商场(190211启用)
| index | 2020-01 | 2019-12 | 2019-11 | 2019-10 | 2019-09 | 2019-08 | 2019-07 | 2019-06 | 2019-05 | 2019-04 | 2019-03 | 2019-02 |
|---|---|---|---|---|---|---|---|---|---|---|---|---|
| pm25 | 75 | 43 | 46 | 29 | 29 | 20 | 19 | 22 | 56 | 33 | 41 | 51 |
| co | 1 | 1 | 1 | 605 | 427 | 356 | 318 | 226 | 351 | 428 | 686 | 874 |
| no2 | 36 | 38 | 34 | 23 | 24 | 18 | 21 | 17 | 18 | 24 | 25 | 22 |
| o3 | 89 | 90 | 95 | 97 | 122 | 132 | 139 | 129 | 132 | 124 | 113 | 100 |
| pm10 | 85 | 66 | 76 | 61 | 73 | 49 | 49 | 55 | 177 | 111 | 114 | 121 |
| so2 | 18 | 17 | 13 | 4.8 | 3.5 | 6.4 | 5.5 | 4 | 4.3 | 7.4 | 9.9 | 12 |