Air Pollution in Dingzhuang: Real-time Air Quality Index and smog alert.
Pollution and air quality forecast for Dingzhuang. Today is Tuesday, June 2, 2026. The following air pollution values have been recorded for Dingzhuang:- particulate matter (PM10) suspended dust - 179 (Very bad Hazardous)
- particulate matter (PM2.5) dust - 35 (Unhealthy for Sensitive Groups)
- ozone (O3) - 0 (Good)
- nitrogen dioxide (NO2) - 0 (Good)
- sulfur dioxide (SO2) - 0 (Good)

What is the air quality in Dingzhuang today? Is the air polluted in Dingzhuang?. Is there smog?
What is the level of PM10 today in Dingzhuang? (particulate matter (PM10) suspended dust)
The current level of particulate matter PM10 in Dingzhuang is:
179 (Very bad Hazardous)
The highest PM10 values usually occur in month: 183 (December 2018).
The lowest value of particulate matter PM10 pollution in Dingzhuang is usually recorded in: August (48).
What is the current level of PM2.5 in Dingzhuang? (particulate matter (PM2.5) dust)
Today's PM2.5 level is:
35 (Unhealthy for Sensitive Groups)
For comparison, the highest level of PM2.5 in Dingzhuang in the last 7 days was: 56 (Friday, May 27, 2022) and the lowest: 56 (Friday, May 27, 2022).
The highest PM2.5 values were recorded: 131 (January 2020).
The lowest level of particulate matter PM2.5 pollution occurs in month: July (23).
How is the O3 level today in Dingzhuang? (ozone (O3))
0 (Good)
How high is the level of NO2? (nitrogen dioxide (NO2))
0 (Good)
What is the level of SO2 pollution? (sulfur dioxide (SO2))
0 (Good)
Current data Friday, May 27, 2022, 12:00 PM
PM10 179 (Very bad Hazardous)
PM2,5 35 (Unhealthy for Sensitive Groups)
O3 0 (Good)
NO2 0 (Good)
SO2 0 (Good)
Data on air pollution from recent days in Dingzhuang
index
2022-05-27
pm10
56
Unhealthy for Sensitive Groups
pm25
56
Unhealthy
o3
0
Good
no2
0
Good
so2
0
Good
data source »
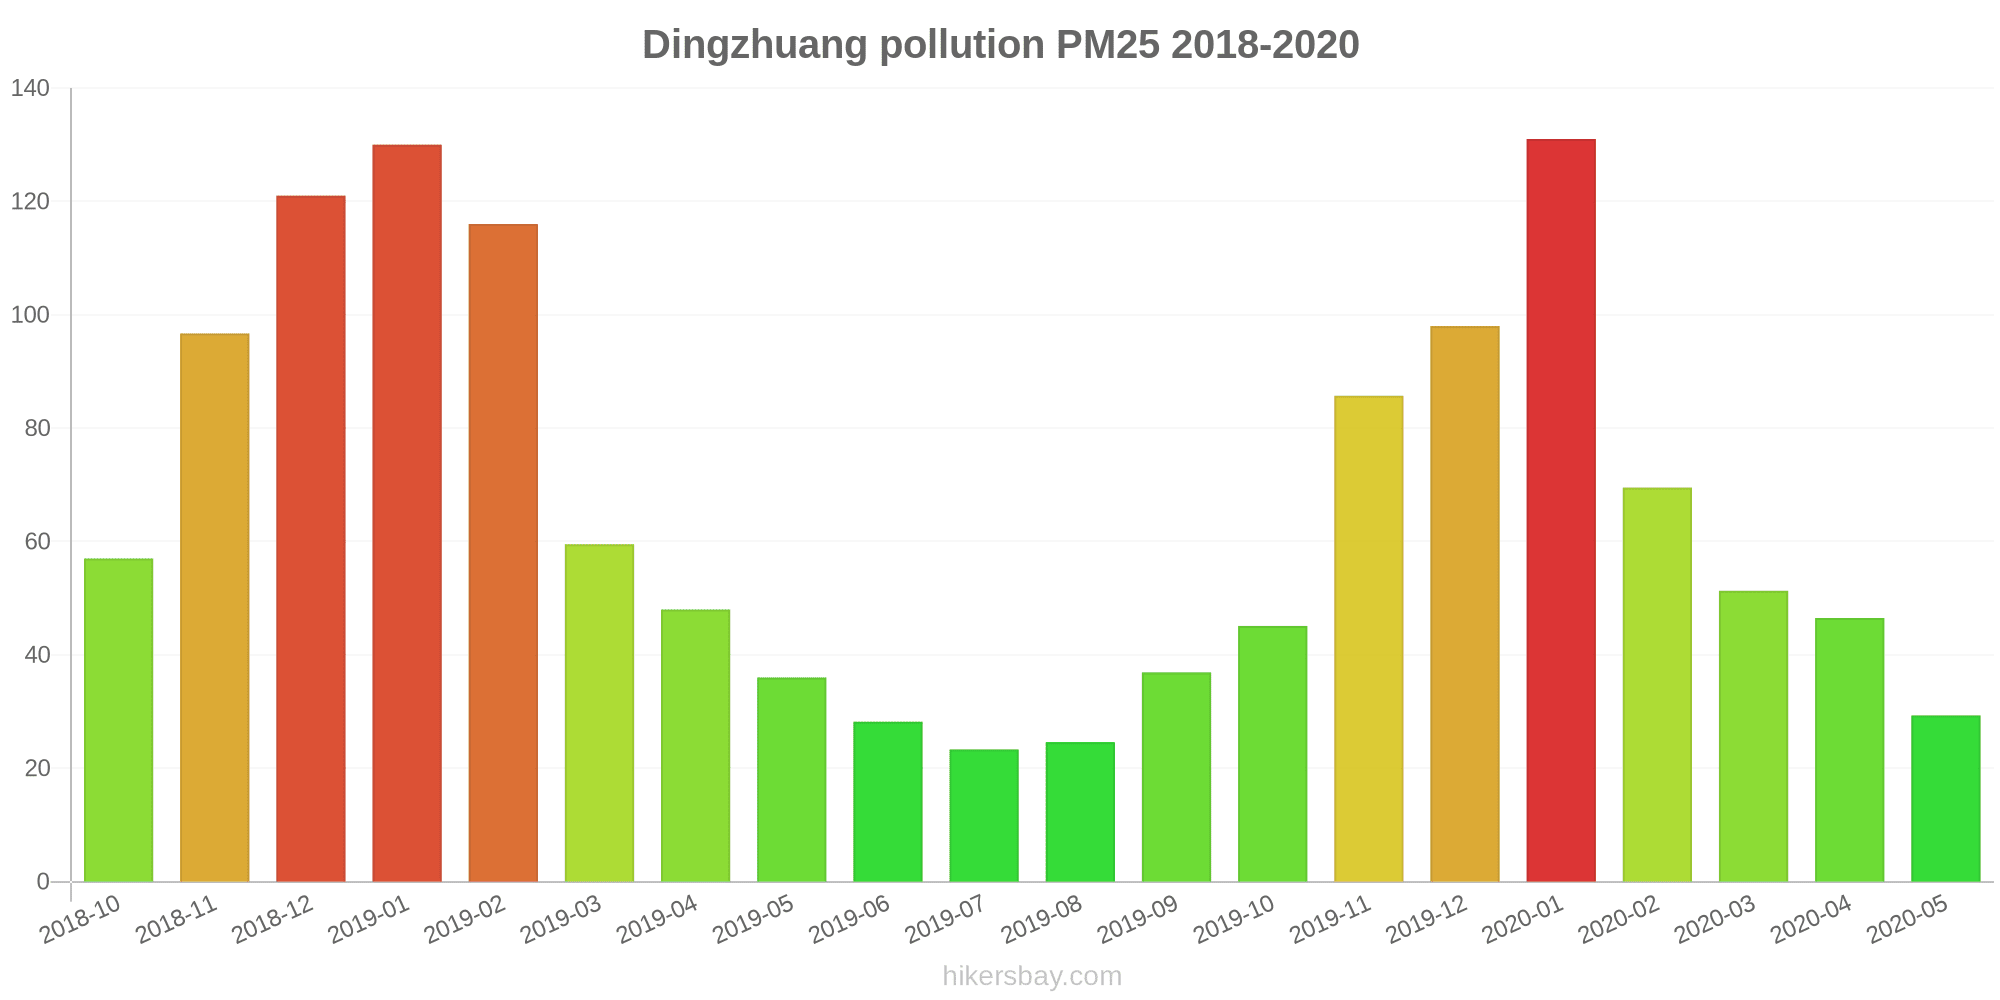
Air pollution in Dingzhuang from October 2018 to May 2020

index
2020-05
2020-04
2020-03
2020-02
2020-01
2019-12
2019-11
2019-10
2019-09
2019-08
2019-07
2019-06
2019-05
2019-04
2019-03
2019-02
2019-01
2018-12
2018-11
2018-10
pm25
29 (Moderate)
47 (Unhealthy for Sensitive Groups)
51 (Unhealthy for Sensitive Groups)
70 (Unhealthy)
131 (Very bad Hazardous)
98 (Very Unhealthy)
86 (Very Unhealthy)
45 (Unhealthy for Sensitive Groups)
37 (Unhealthy for Sensitive Groups)
25 (Moderate)
23 (Moderate)
28 (Moderate)
36 (Unhealthy for Sensitive Groups)
48 (Unhealthy for Sensitive Groups)
60 (Unhealthy)
116 (Very bad Hazardous)
130 (Very bad Hazardous)
121 (Very bad Hazardous)
97 (Very Unhealthy)
57 (Unhealthy)
co
533 (Good)
574 (Good)
599 (Good)
629 (Good)
1 (Good)
935 (Good)
811 (Good)
640 (Good)
626 (Good)
538 (Good)
527 (Good)
547 (Good)
598 (Good)
683 (Good)
691 (Good)
885 (Good)
946 (Good)
1 (Good)
944 (Good)
584 (Good)
no2
16 (Good)
27 (Good)
23 (Good)
14 (Good)
30 (Good)
43 (Moderate)
40 (Good)
32 (Good)
21 (Good)
16 (Good)
21 (Good)
19 (Good)
23 (Good)
24 (Good)
32 (Good)
29 (Good)
45 (Moderate)
48 (Moderate)
44 (Moderate)
50 (Moderate)
o3
131 (Unhealthy for Sensitive Groups)
137 (Unhealthy for Sensitive Groups)
105 (Moderate)
80 (Moderate)
65 (Good)
57 (Good)
99 (Moderate)
119 (Moderate)
161 (Unhealthy)
154 (Unhealthy)
180 (Very Unhealthy)
190 (Very Unhealthy)
160 (Unhealthy)
131 (Unhealthy for Sensitive Groups)
116 (Moderate)
90 (Moderate)
73 (Moderate)
45 (Good)
89 (Moderate)
124 (Unhealthy for Sensitive Groups)
pm10
69 (Unhealthy for Sensitive Groups)
88 (Unhealthy)
94 (Unhealthy)
80 (Unhealthy for Sensitive Groups)
139 (Very Unhealthy)
122 (Very Unhealthy)
136 (Very Unhealthy)
95 (Unhealthy)
81 (Unhealthy)
48 (Moderate)
48 (Moderate)
65 (Unhealthy for Sensitive Groups)
93 (Unhealthy)
97 (Unhealthy)
110 (Very Unhealthy)
140 (Very Unhealthy)
166 (Very bad Hazardous)
183 (Very bad Hazardous)
159 (Very bad Hazardous)
113 (Very Unhealthy)
so2
12 (Good)
14 (Good)
11 (Good)
6.5 (Good)
7.8 (Good)
8.4 (Good)
12 (Good)
11 (Good)
11 (Good)
8.6 (Good)
6.6 (Good)
7.1 (Good)
8.9 (Good)
9.5 (Good)
11 (Good)
10 (Good)
14 (Good)
15 (Good)
13 (Good)
20 (Good)
data source »
广电局
Friday, May 27, 2022, 12:00 PM
PM10 179 (Very bad Hazardous)
particulate matter (PM10) suspended dust
PM2,5 35 (Unhealthy for Sensitive Groups)
particulate matter (PM2.5) dust
O3 0.04 (Good)
ozone (O3)
NO2 0 (Good)
nitrogen dioxide (NO2)
SO2 0 (Good)
sulfur dioxide (SO2)
广电局
index
2022-05-27
pm10
56
pm25
56
o3
0.03
no2
0
so2
0
广电局
2018-10 2020-05

index
2020-05
2020-04
2020-03
2020-02
2020-01
2019-12
2019-11
2019-10
2019-09
2019-08
2019-07
2019-06
2019-05
2019-04
2019-03
2019-02
2019-01
2018-12
2018-11
2018-10
pm25
29
47
51
70
131
98
86
45
37
25
23
28
36
48
60
116
130
121
97
57
co
533
574
599
629
1
935
811
640
626
538
527
547
598
683
691
885
946
1
944
584
no2
16
27
23
14
30
43
40
32
21
16
21
19
23
24
32
29
45
48
44
50
o3
131
137
105
80
65
57
99
119
161
154
180
190
160
131
116
90
73
45
89
124
pm10
69
88
94
80
139
122
136
95
81
48
48
65
93
97
110
140
166
183
159
113
so2
12
14
11
6.5
7.8
8.4
12
11
11
8.6
6.6
7.1
8.9
9.5
11
10
14
15
13
20
* Pollution data source:
https://openaq.org
(ChinaAQIData)
The data is licensed under CC-By 4.0
PM10 179 (Very bad Hazardous)
PM2,5 35 (Unhealthy for Sensitive Groups)
O3 0 (Good)
NO2 0 (Good)
SO2 0 (Good)
Data on air pollution from recent days in Dingzhuang
| index | 2022-05-27 |
|---|---|
| pm10 | 56 Unhealthy for Sensitive Groups |
| pm25 | 56 Unhealthy |
| o3 | 0 Good |
| no2 | 0 Good |
| so2 | 0 Good |
| index | 2020-05 | 2020-04 | 2020-03 | 2020-02 | 2020-01 | 2019-12 | 2019-11 | 2019-10 | 2019-09 | 2019-08 | 2019-07 | 2019-06 | 2019-05 | 2019-04 | 2019-03 | 2019-02 | 2019-01 | 2018-12 | 2018-11 | 2018-10 |
|---|---|---|---|---|---|---|---|---|---|---|---|---|---|---|---|---|---|---|---|---|
| pm25 | 29 (Moderate) | 47 (Unhealthy for Sensitive Groups) | 51 (Unhealthy for Sensitive Groups) | 70 (Unhealthy) | 131 (Very bad Hazardous) | 98 (Very Unhealthy) | 86 (Very Unhealthy) | 45 (Unhealthy for Sensitive Groups) | 37 (Unhealthy for Sensitive Groups) | 25 (Moderate) | 23 (Moderate) | 28 (Moderate) | 36 (Unhealthy for Sensitive Groups) | 48 (Unhealthy for Sensitive Groups) | 60 (Unhealthy) | 116 (Very bad Hazardous) | 130 (Very bad Hazardous) | 121 (Very bad Hazardous) | 97 (Very Unhealthy) | 57 (Unhealthy) |
| co | 533 (Good) | 574 (Good) | 599 (Good) | 629 (Good) | 1 (Good) | 935 (Good) | 811 (Good) | 640 (Good) | 626 (Good) | 538 (Good) | 527 (Good) | 547 (Good) | 598 (Good) | 683 (Good) | 691 (Good) | 885 (Good) | 946 (Good) | 1 (Good) | 944 (Good) | 584 (Good) |
| no2 | 16 (Good) | 27 (Good) | 23 (Good) | 14 (Good) | 30 (Good) | 43 (Moderate) | 40 (Good) | 32 (Good) | 21 (Good) | 16 (Good) | 21 (Good) | 19 (Good) | 23 (Good) | 24 (Good) | 32 (Good) | 29 (Good) | 45 (Moderate) | 48 (Moderate) | 44 (Moderate) | 50 (Moderate) |
| o3 | 131 (Unhealthy for Sensitive Groups) | 137 (Unhealthy for Sensitive Groups) | 105 (Moderate) | 80 (Moderate) | 65 (Good) | 57 (Good) | 99 (Moderate) | 119 (Moderate) | 161 (Unhealthy) | 154 (Unhealthy) | 180 (Very Unhealthy) | 190 (Very Unhealthy) | 160 (Unhealthy) | 131 (Unhealthy for Sensitive Groups) | 116 (Moderate) | 90 (Moderate) | 73 (Moderate) | 45 (Good) | 89 (Moderate) | 124 (Unhealthy for Sensitive Groups) |
| pm10 | 69 (Unhealthy for Sensitive Groups) | 88 (Unhealthy) | 94 (Unhealthy) | 80 (Unhealthy for Sensitive Groups) | 139 (Very Unhealthy) | 122 (Very Unhealthy) | 136 (Very Unhealthy) | 95 (Unhealthy) | 81 (Unhealthy) | 48 (Moderate) | 48 (Moderate) | 65 (Unhealthy for Sensitive Groups) | 93 (Unhealthy) | 97 (Unhealthy) | 110 (Very Unhealthy) | 140 (Very Unhealthy) | 166 (Very bad Hazardous) | 183 (Very bad Hazardous) | 159 (Very bad Hazardous) | 113 (Very Unhealthy) |
| so2 | 12 (Good) | 14 (Good) | 11 (Good) | 6.5 (Good) | 7.8 (Good) | 8.4 (Good) | 12 (Good) | 11 (Good) | 11 (Good) | 8.6 (Good) | 6.6 (Good) | 7.1 (Good) | 8.9 (Good) | 9.5 (Good) | 11 (Good) | 10 (Good) | 14 (Good) | 15 (Good) | 13 (Good) | 20 (Good) |
PM10 179 (Very bad Hazardous)
particulate matter (PM10) suspended dustPM2,5 35 (Unhealthy for Sensitive Groups)
particulate matter (PM2.5) dustO3 0.04 (Good)
ozone (O3)NO2 0 (Good)
nitrogen dioxide (NO2)SO2 0 (Good)
sulfur dioxide (SO2)广电局
| index | 2022-05-27 |
|---|---|
| pm10 | 56 |
| pm25 | 56 |
| o3 | 0.03 |
| no2 | 0 |
| so2 | 0 |
广电局

| index | 2020-05 | 2020-04 | 2020-03 | 2020-02 | 2020-01 | 2019-12 | 2019-11 | 2019-10 | 2019-09 | 2019-08 | 2019-07 | 2019-06 | 2019-05 | 2019-04 | 2019-03 | 2019-02 | 2019-01 | 2018-12 | 2018-11 | 2018-10 |
|---|---|---|---|---|---|---|---|---|---|---|---|---|---|---|---|---|---|---|---|---|
| pm25 | 29 | 47 | 51 | 70 | 131 | 98 | 86 | 45 | 37 | 25 | 23 | 28 | 36 | 48 | 60 | 116 | 130 | 121 | 97 | 57 |
| co | 533 | 574 | 599 | 629 | 1 | 935 | 811 | 640 | 626 | 538 | 527 | 547 | 598 | 683 | 691 | 885 | 946 | 1 | 944 | 584 |
| no2 | 16 | 27 | 23 | 14 | 30 | 43 | 40 | 32 | 21 | 16 | 21 | 19 | 23 | 24 | 32 | 29 | 45 | 48 | 44 | 50 |
| o3 | 131 | 137 | 105 | 80 | 65 | 57 | 99 | 119 | 161 | 154 | 180 | 190 | 160 | 131 | 116 | 90 | 73 | 45 | 89 | 124 |
| pm10 | 69 | 88 | 94 | 80 | 139 | 122 | 136 | 95 | 81 | 48 | 48 | 65 | 93 | 97 | 110 | 140 | 166 | 183 | 159 | 113 |
| so2 | 12 | 14 | 11 | 6.5 | 7.8 | 8.4 | 12 | 11 | 11 | 8.6 | 6.6 | 7.1 | 8.9 | 9.5 | 11 | 10 | 14 | 15 | 13 | 20 |