Air Pollution in Wulimiao: Real-time Air Quality Index and smog alert.
Pollution and air quality forecast for Wulimiao. Today is Tuesday, June 2, 2026. The following air pollution values have been recorded for Wulimiao:- particulate matter (PM10) suspended dust - 179 (Very bad Hazardous)
- particulate matter (PM2.5) dust - 35 (Unhealthy for Sensitive Groups)
- ozone (O3) - 0 (Good)
- nitrogen dioxide (NO2) - 0 (Good)
- sulfur dioxide (SO2) - 0 (Good)

What is the air quality in Wulimiao today? Is the air polluted in Wulimiao?. Is there smog?
What is the level of PM10 today in Wulimiao? (particulate matter (PM10) suspended dust)
The current level of particulate matter PM10 in Wulimiao is:
179 (Very bad Hazardous)
The highest PM10 values usually occur in month: 180 (December 2018).
The lowest value of particulate matter PM10 pollution in Wulimiao is usually recorded in: August (45).
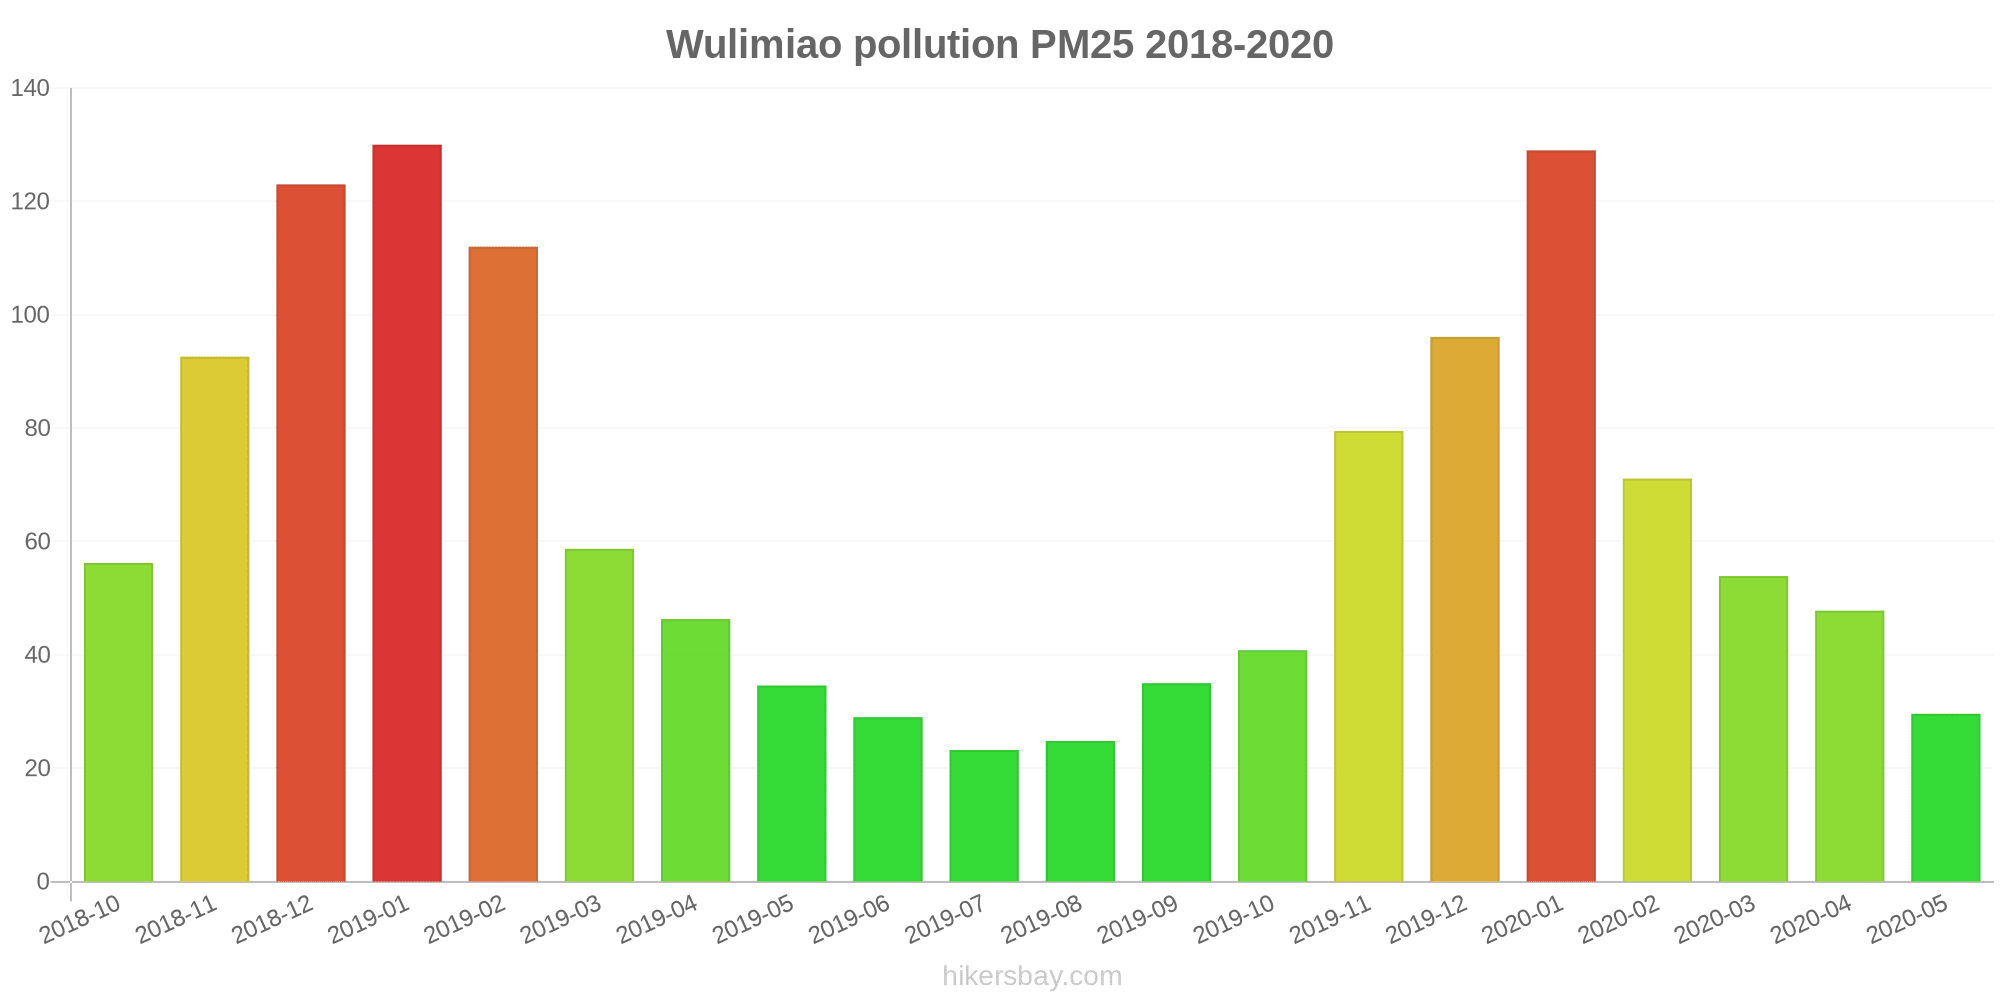
What is the current level of PM2.5 in Wulimiao? (particulate matter (PM2.5) dust)
Today's PM2.5 level is:
35 (Unhealthy for Sensitive Groups)
For comparison, the highest level of PM2.5 in Wulimiao in the last 7 days was: 56 (Friday, May 27, 2022) and the lowest: 56 (Friday, May 27, 2022).
The highest PM2.5 values were recorded: 130 (January 2019).
The lowest level of particulate matter PM2.5 pollution occurs in month: July (23).
How is the O3 level today in Wulimiao? (ozone (O3))
0 (Good)
How high is the level of NO2? (nitrogen dioxide (NO2))
0 (Good)
What is the level of SO2 pollution? (sulfur dioxide (SO2))
0 (Good)
Current data Friday, May 27, 2022, 12:00 PM
PM10 179 (Very bad Hazardous)
PM2,5 35 (Unhealthy for Sensitive Groups)
O3 0 (Good)
NO2 0 (Good)
SO2 0 (Good)
Data on air pollution from recent days in Wulimiao
index
2022-05-27
pm10
56
Unhealthy for Sensitive Groups
pm25
56
Unhealthy
o3
0
Good
no2
0
Good
so2
0
Good
data source »
Air pollution in Wulimiao from October 2018 to May 2020

index
2020-05
2020-04
2020-03
2020-02
2020-01
2019-12
2019-11
2019-10
2019-09
2019-08
2019-07
2019-06
2019-05
2019-04
2019-03
2019-02
2019-01
2018-12
2018-11
2018-10
pm25
30 (Moderate)
48 (Unhealthy for Sensitive Groups)
54 (Unhealthy for Sensitive Groups)
71 (Unhealthy)
129 (Very bad Hazardous)
96 (Very Unhealthy)
80 (Very Unhealthy)
41 (Unhealthy for Sensitive Groups)
35 (Unhealthy for Sensitive Groups)
25 (Moderate)
23 (Moderate)
29 (Moderate)
35 (Moderate)
46 (Unhealthy for Sensitive Groups)
59 (Unhealthy)
112 (Very bad Hazardous)
130 (Very bad Hazardous)
123 (Very bad Hazardous)
93 (Very Unhealthy)
56 (Unhealthy)
co
724 (Good)
654 (Good)
693 (Good)
774 (Good)
1 (Good)
966 (Good)
912 (Good)
656 (Good)
740 (Good)
531 (Good)
486 (Good)
568 (Good)
613 (Good)
685 (Good)
640 (Good)
899 (Good)
1 (Good)
1 (Good)
1 (Good)
507 (Good)
no2
20 (Good)
31 (Good)
24 (Good)
14 (Good)
33 (Good)
44 (Moderate)
46 (Moderate)
32 (Good)
24 (Good)
17 (Good)
20 (Good)
18 (Good)
20 (Good)
20 (Good)
28 (Good)
26 (Good)
41 (Moderate)
51 (Moderate)
46 (Moderate)
43 (Moderate)
o3
136 (Unhealthy for Sensitive Groups)
132 (Unhealthy for Sensitive Groups)
102 (Moderate)
85 (Moderate)
69 (Good)
57 (Good)
94 (Moderate)
115 (Moderate)
159 (Unhealthy)
157 (Unhealthy)
173 (Unhealthy)
188 (Very Unhealthy)
154 (Unhealthy)
128 (Unhealthy for Sensitive Groups)
112 (Moderate)
88 (Moderate)
71 (Moderate)
45 (Good)
89 (Moderate)
115 (Moderate)
pm10
63 (Unhealthy for Sensitive Groups)
85 (Unhealthy)
94 (Unhealthy)
81 (Unhealthy)
142 (Very Unhealthy)
124 (Very Unhealthy)
135 (Very Unhealthy)
93 (Unhealthy)
80 (Unhealthy for Sensitive Groups)
45 (Moderate)
45 (Moderate)
63 (Unhealthy for Sensitive Groups)
92 (Unhealthy)
99 (Unhealthy)
109 (Unhealthy)
138 (Very Unhealthy)
167 (Very bad Hazardous)
180 (Very bad Hazardous)
152 (Very bad Hazardous)
113 (Very Unhealthy)
so2
7.2 (Good)
12 (Good)
9.7 (Good)
6.8 (Good)
8.1 (Good)
8.5 (Good)
10 (Good)
8.9 (Good)
8.1 (Good)
8 (Good)
6.8 (Good)
8.4 (Good)
8.7 (Good)
9.3 (Good)
11 (Good)
9.9 (Good)
13 (Good)
15 (Good)
13 (Good)
17 (Good)
data source »
水利局
Friday, May 27, 2022, 12:00 PM
PM10 179 (Very bad Hazardous)
particulate matter (PM10) suspended dust
PM2,5 35 (Unhealthy for Sensitive Groups)
particulate matter (PM2.5) dust
O3 0.04 (Good)
ozone (O3)
NO2 0 (Good)
nitrogen dioxide (NO2)
SO2 0 (Good)
sulfur dioxide (SO2)
水利局
index
2022-05-27
pm10
56
pm25
56
o3
0.03
no2
0
so2
0
水利局
2018-10 2020-05

index
2020-05
2020-04
2020-03
2020-02
2020-01
2019-12
2019-11
2019-10
2019-09
2019-08
2019-07
2019-06
2019-05
2019-04
2019-03
2019-02
2019-01
2018-12
2018-11
2018-10
pm25
30
48
54
71
129
96
80
41
35
25
23
29
35
46
59
112
130
123
93
56
co
724
654
693
774
1
966
912
656
740
531
486
568
613
685
640
899
1
1
1
507
no2
20
31
24
14
33
44
46
32
24
17
20
18
20
20
28
26
41
51
46
43
o3
136
132
102
85
69
57
94
115
159
157
173
188
154
128
112
88
71
45
89
115
pm10
63
85
94
81
142
124
135
93
80
45
45
63
92
99
109
138
167
180
152
113
so2
7.2
12
9.7
6.8
8.1
8.5
10
8.9
8.1
8
6.8
8.4
8.7
9.3
11
9.9
13
15
13
17
* Pollution data source:
https://openaq.org
(ChinaAQIData)
The data is licensed under CC-By 4.0
PM10 179 (Very bad Hazardous)
PM2,5 35 (Unhealthy for Sensitive Groups)
O3 0 (Good)
NO2 0 (Good)
SO2 0 (Good)
Data on air pollution from recent days in Wulimiao
| index | 2022-05-27 |
|---|---|
| pm10 | 56 Unhealthy for Sensitive Groups |
| pm25 | 56 Unhealthy |
| o3 | 0 Good |
| no2 | 0 Good |
| so2 | 0 Good |
| index | 2020-05 | 2020-04 | 2020-03 | 2020-02 | 2020-01 | 2019-12 | 2019-11 | 2019-10 | 2019-09 | 2019-08 | 2019-07 | 2019-06 | 2019-05 | 2019-04 | 2019-03 | 2019-02 | 2019-01 | 2018-12 | 2018-11 | 2018-10 |
|---|---|---|---|---|---|---|---|---|---|---|---|---|---|---|---|---|---|---|---|---|
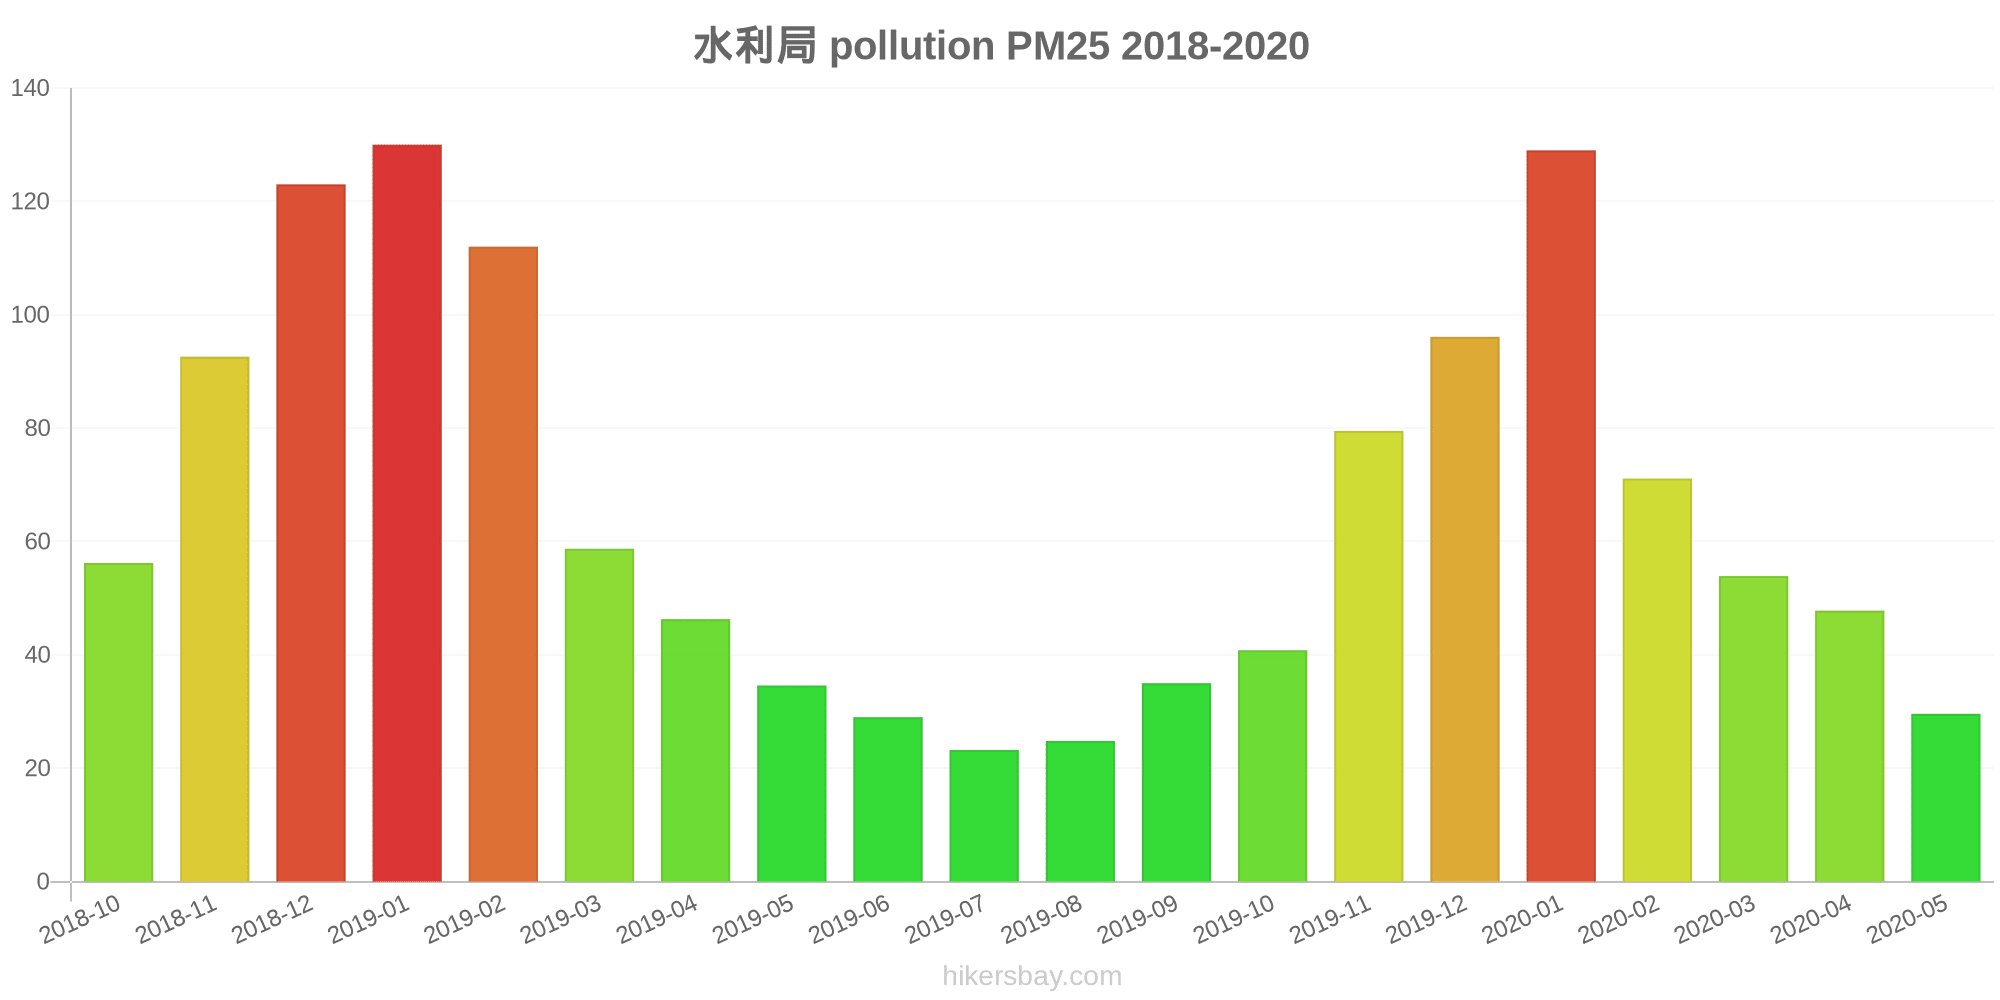
| pm25 | 30 (Moderate) | 48 (Unhealthy for Sensitive Groups) | 54 (Unhealthy for Sensitive Groups) | 71 (Unhealthy) | 129 (Very bad Hazardous) | 96 (Very Unhealthy) | 80 (Very Unhealthy) | 41 (Unhealthy for Sensitive Groups) | 35 (Unhealthy for Sensitive Groups) | 25 (Moderate) | 23 (Moderate) | 29 (Moderate) | 35 (Moderate) | 46 (Unhealthy for Sensitive Groups) | 59 (Unhealthy) | 112 (Very bad Hazardous) | 130 (Very bad Hazardous) | 123 (Very bad Hazardous) | 93 (Very Unhealthy) | 56 (Unhealthy) |
| co | 724 (Good) | 654 (Good) | 693 (Good) | 774 (Good) | 1 (Good) | 966 (Good) | 912 (Good) | 656 (Good) | 740 (Good) | 531 (Good) | 486 (Good) | 568 (Good) | 613 (Good) | 685 (Good) | 640 (Good) | 899 (Good) | 1 (Good) | 1 (Good) | 1 (Good) | 507 (Good) |
| no2 | 20 (Good) | 31 (Good) | 24 (Good) | 14 (Good) | 33 (Good) | 44 (Moderate) | 46 (Moderate) | 32 (Good) | 24 (Good) | 17 (Good) | 20 (Good) | 18 (Good) | 20 (Good) | 20 (Good) | 28 (Good) | 26 (Good) | 41 (Moderate) | 51 (Moderate) | 46 (Moderate) | 43 (Moderate) |
| o3 | 136 (Unhealthy for Sensitive Groups) | 132 (Unhealthy for Sensitive Groups) | 102 (Moderate) | 85 (Moderate) | 69 (Good) | 57 (Good) | 94 (Moderate) | 115 (Moderate) | 159 (Unhealthy) | 157 (Unhealthy) | 173 (Unhealthy) | 188 (Very Unhealthy) | 154 (Unhealthy) | 128 (Unhealthy for Sensitive Groups) | 112 (Moderate) | 88 (Moderate) | 71 (Moderate) | 45 (Good) | 89 (Moderate) | 115 (Moderate) |
| pm10 | 63 (Unhealthy for Sensitive Groups) | 85 (Unhealthy) | 94 (Unhealthy) | 81 (Unhealthy) | 142 (Very Unhealthy) | 124 (Very Unhealthy) | 135 (Very Unhealthy) | 93 (Unhealthy) | 80 (Unhealthy for Sensitive Groups) | 45 (Moderate) | 45 (Moderate) | 63 (Unhealthy for Sensitive Groups) | 92 (Unhealthy) | 99 (Unhealthy) | 109 (Unhealthy) | 138 (Very Unhealthy) | 167 (Very bad Hazardous) | 180 (Very bad Hazardous) | 152 (Very bad Hazardous) | 113 (Very Unhealthy) |
| so2 | 7.2 (Good) | 12 (Good) | 9.7 (Good) | 6.8 (Good) | 8.1 (Good) | 8.5 (Good) | 10 (Good) | 8.9 (Good) | 8.1 (Good) | 8 (Good) | 6.8 (Good) | 8.4 (Good) | 8.7 (Good) | 9.3 (Good) | 11 (Good) | 9.9 (Good) | 13 (Good) | 15 (Good) | 13 (Good) | 17 (Good) |
PM10 179 (Very bad Hazardous)
particulate matter (PM10) suspended dustPM2,5 35 (Unhealthy for Sensitive Groups)
particulate matter (PM2.5) dustO3 0.04 (Good)
ozone (O3)NO2 0 (Good)
nitrogen dioxide (NO2)SO2 0 (Good)
sulfur dioxide (SO2)水利局
| index | 2022-05-27 |
|---|---|
| pm10 | 56 |
| pm25 | 56 |
| o3 | 0.03 |
| no2 | 0 |
| so2 | 0 |
水利局
| index | 2020-05 | 2020-04 | 2020-03 | 2020-02 | 2020-01 | 2019-12 | 2019-11 | 2019-10 | 2019-09 | 2019-08 | 2019-07 | 2019-06 | 2019-05 | 2019-04 | 2019-03 | 2019-02 | 2019-01 | 2018-12 | 2018-11 | 2018-10 |
|---|---|---|---|---|---|---|---|---|---|---|---|---|---|---|---|---|---|---|---|---|
| pm25 | 30 | 48 | 54 | 71 | 129 | 96 | 80 | 41 | 35 | 25 | 23 | 29 | 35 | 46 | 59 | 112 | 130 | 123 | 93 | 56 |
| co | 724 | 654 | 693 | 774 | 1 | 966 | 912 | 656 | 740 | 531 | 486 | 568 | 613 | 685 | 640 | 899 | 1 | 1 | 1 | 507 |
| no2 | 20 | 31 | 24 | 14 | 33 | 44 | 46 | 32 | 24 | 17 | 20 | 18 | 20 | 20 | 28 | 26 | 41 | 51 | 46 | 43 |
| o3 | 136 | 132 | 102 | 85 | 69 | 57 | 94 | 115 | 159 | 157 | 173 | 188 | 154 | 128 | 112 | 88 | 71 | 45 | 89 | 115 |
| pm10 | 63 | 85 | 94 | 81 | 142 | 124 | 135 | 93 | 80 | 45 | 45 | 63 | 92 | 99 | 109 | 138 | 167 | 180 | 152 | 113 |
| so2 | 7.2 | 12 | 9.7 | 6.8 | 8.1 | 8.5 | 10 | 8.9 | 8.1 | 8 | 6.8 | 8.4 | 8.7 | 9.3 | 11 | 9.9 | 13 | 15 | 13 | 17 |