Air Pollution in Xiaolizhuang: Real-time Air Quality Index and smog alert.
Pollution and air quality forecast for Xiaolizhuang. Today is Tuesday, June 2, 2026. The following air pollution values have been recorded for Xiaolizhuang:- particulate matter (PM10) suspended dust - 179 (Very bad Hazardous)
- particulate matter (PM2.5) dust - 35 (Unhealthy for Sensitive Groups)
- ozone (O3) - 0 (Good)
- nitrogen dioxide (NO2) - 0 (Good)
- sulfur dioxide (SO2) - 0 (Good)

What is the air quality in Xiaolizhuang today? Is the air polluted in Xiaolizhuang?. Is there smog?
What is the level of PM10 today in Xiaolizhuang? (particulate matter (PM10) suspended dust)
The current level of particulate matter PM10 in Xiaolizhuang is:
179 (Very bad Hazardous)
The highest PM10 values usually occur in month: 165 (December 2018).
The lowest value of particulate matter PM10 pollution in Xiaolizhuang is usually recorded in: July (46).
What is the current level of PM2.5 in Xiaolizhuang? (particulate matter (PM2.5) dust)
Today's PM2.5 level is:
35 (Unhealthy for Sensitive Groups)
For comparison, the highest level of PM2.5 in Xiaolizhuang in the last 7 days was: 56 (Friday, May 27, 2022) and the lowest: 56 (Friday, May 27, 2022).
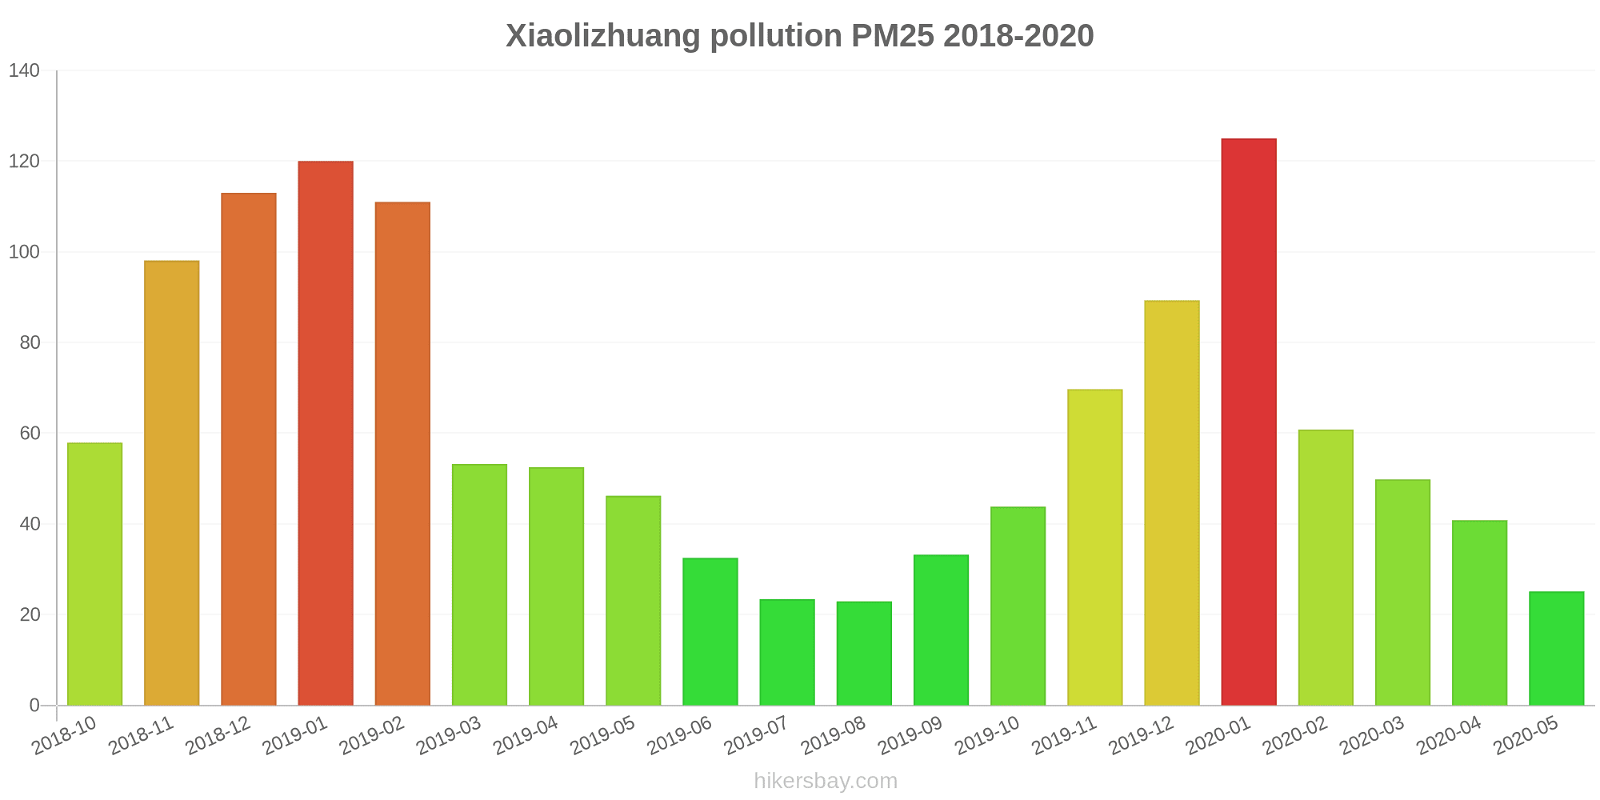
The highest PM2.5 values were recorded: 125 (January 2020).
The lowest level of particulate matter PM2.5 pollution occurs in month: August (23).
How is the O3 level today in Xiaolizhuang? (ozone (O3))
0 (Good)
How high is the level of NO2? (nitrogen dioxide (NO2))
0 (Good)
What is the level of SO2 pollution? (sulfur dioxide (SO2))
0 (Good)
Current data Friday, May 27, 2022, 12:00 PM
PM10 179 (Very bad Hazardous)
PM2,5 35 (Unhealthy for Sensitive Groups)
O3 0 (Good)
NO2 0 (Good)
SO2 0 (Good)
Data on air pollution from recent days in Xiaolizhuang
index
2022-05-27
pm10
56
Unhealthy for Sensitive Groups
pm25
56
Unhealthy
o3
0
Good
no2
0
Good
so2
0
Good
data source »
Air pollution in Xiaolizhuang from October 2018 to May 2020
index
2020-05
2020-04
2020-03
2020-02
2020-01
2019-12
2019-11
2019-10
2019-09
2019-08
2019-07
2019-06
2019-05
2019-04
2019-03
2019-02
2019-01
2018-12
2018-11
2018-10
pm25
25 (Moderate)
41 (Unhealthy for Sensitive Groups)
50 (Unhealthy for Sensitive Groups)
61 (Unhealthy)
125 (Very bad Hazardous)
89 (Very Unhealthy)
70 (Unhealthy)
44 (Unhealthy for Sensitive Groups)
33 (Moderate)
23 (Moderate)
23 (Moderate)
33 (Moderate)
46 (Unhealthy for Sensitive Groups)
53 (Unhealthy for Sensitive Groups)
53 (Unhealthy for Sensitive Groups)
111 (Very bad Hazardous)
120 (Very bad Hazardous)
113 (Very bad Hazardous)
98 (Very Unhealthy)
58 (Unhealthy)
co
628 (Good)
673 (Good)
675 (Good)
816 (Good)
1 (Good)
1 (Good)
981 (Good)
761 (Good)
866 (Good)
757 (Good)
617 (Good)
671 (Good)
603 (Good)
718 (Good)
673 (Good)
862 (Good)
1 (Good)
1 (Good)
1 (Good)
880 (Good)
no2
13 (Good)
24 (Good)
24 (Good)
17 (Good)
27 (Good)
40 (Good)
38 (Good)
33 (Good)
22 (Good)
16 (Good)
14 (Good)
17 (Good)
24 (Good)
20 (Good)
30 (Good)
22 (Good)
39 (Good)
40 (Good)
37 (Good)
42 (Moderate)
o3
143 (Unhealthy for Sensitive Groups)
144 (Unhealthy for Sensitive Groups)
109 (Moderate)
91 (Moderate)
75 (Moderate)
61 (Good)
91 (Moderate)
122 (Unhealthy for Sensitive Groups)
166 (Unhealthy)
142 (Unhealthy for Sensitive Groups)
161 (Unhealthy)
182 (Very Unhealthy)
151 (Unhealthy)
143 (Unhealthy for Sensitive Groups)
134 (Unhealthy for Sensitive Groups)
99 (Moderate)
70 (Moderate)
52 (Good)
98 (Moderate)
127 (Unhealthy for Sensitive Groups)
pm10
75 (Unhealthy for Sensitive Groups)
81 (Unhealthy)
82 (Unhealthy)
69 (Unhealthy for Sensitive Groups)
129 (Very Unhealthy)
110 (Very Unhealthy)
125 (Very Unhealthy)
96 (Unhealthy)
73 (Unhealthy for Sensitive Groups)
48 (Moderate)
46 (Moderate)
62 (Unhealthy for Sensitive Groups)
107 (Unhealthy)
95 (Unhealthy)
110 (Very Unhealthy)
147 (Very Unhealthy)
162 (Very bad Hazardous)
165 (Very bad Hazardous)
143 (Very Unhealthy)
112 (Very Unhealthy)
so2
8.2 (Good)
10 (Good)
8.8 (Good)
6.7 (Good)
8 (Good)
8.7 (Good)
14 (Good)
11 (Good)
10 (Good)
8.3 (Good)
8.6 (Good)
7.4 (Good)
8.7 (Good)
8.9 (Good)
11 (Good)
9.3 (Good)
12 (Good)
13 (Good)
13 (Good)
15 (Good)
data source »
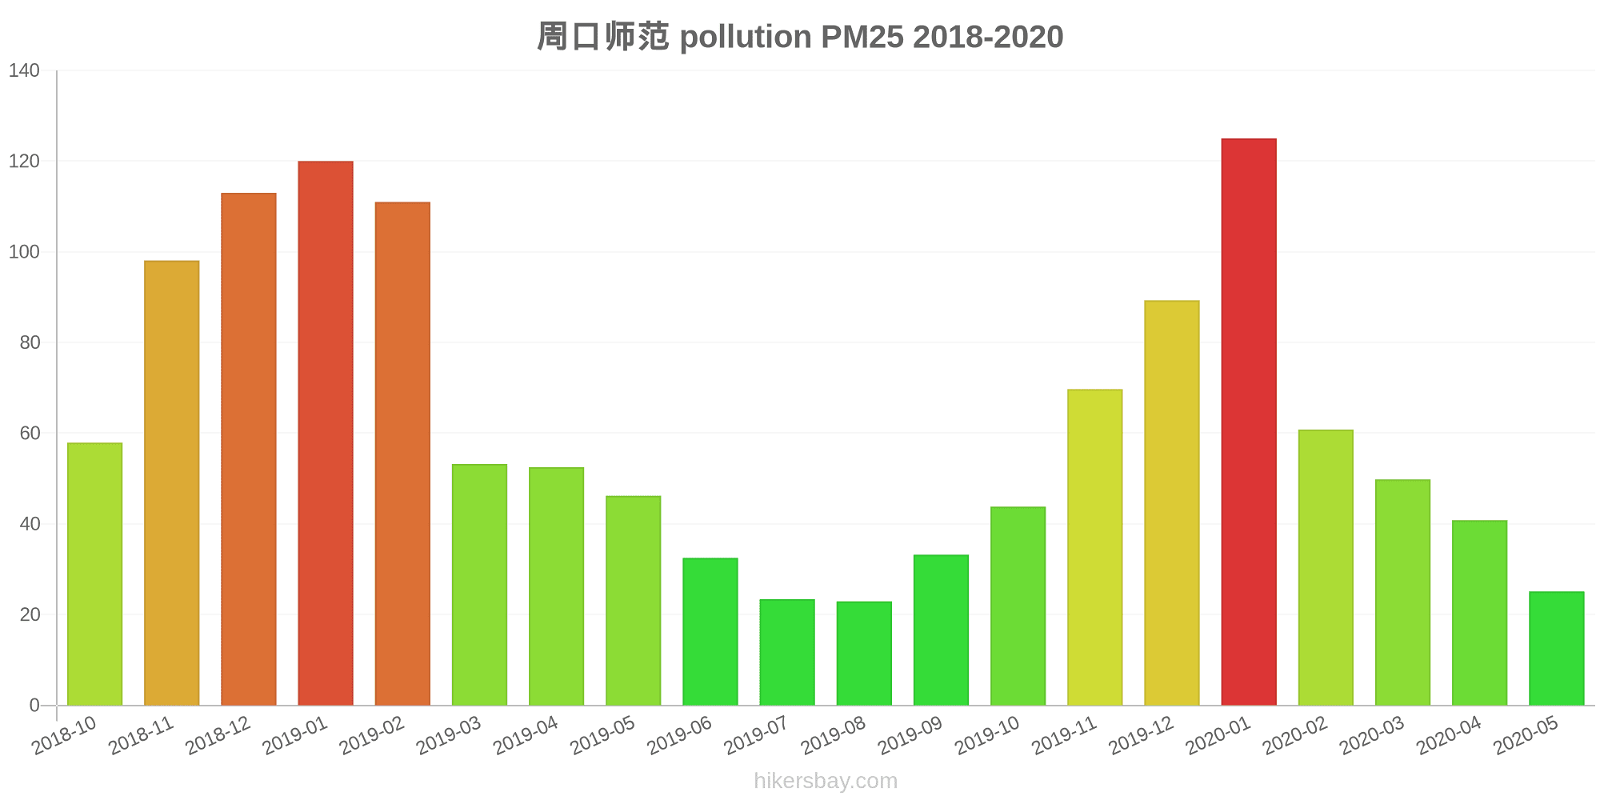
周口师范
Friday, May 27, 2022, 12:00 PM
PM10 179 (Very bad Hazardous)
particulate matter (PM10) suspended dust
PM2,5 35 (Unhealthy for Sensitive Groups)
particulate matter (PM2.5) dust
O3 0.04 (Good)
ozone (O3)
NO2 0 (Good)
nitrogen dioxide (NO2)
SO2 0 (Good)
sulfur dioxide (SO2)
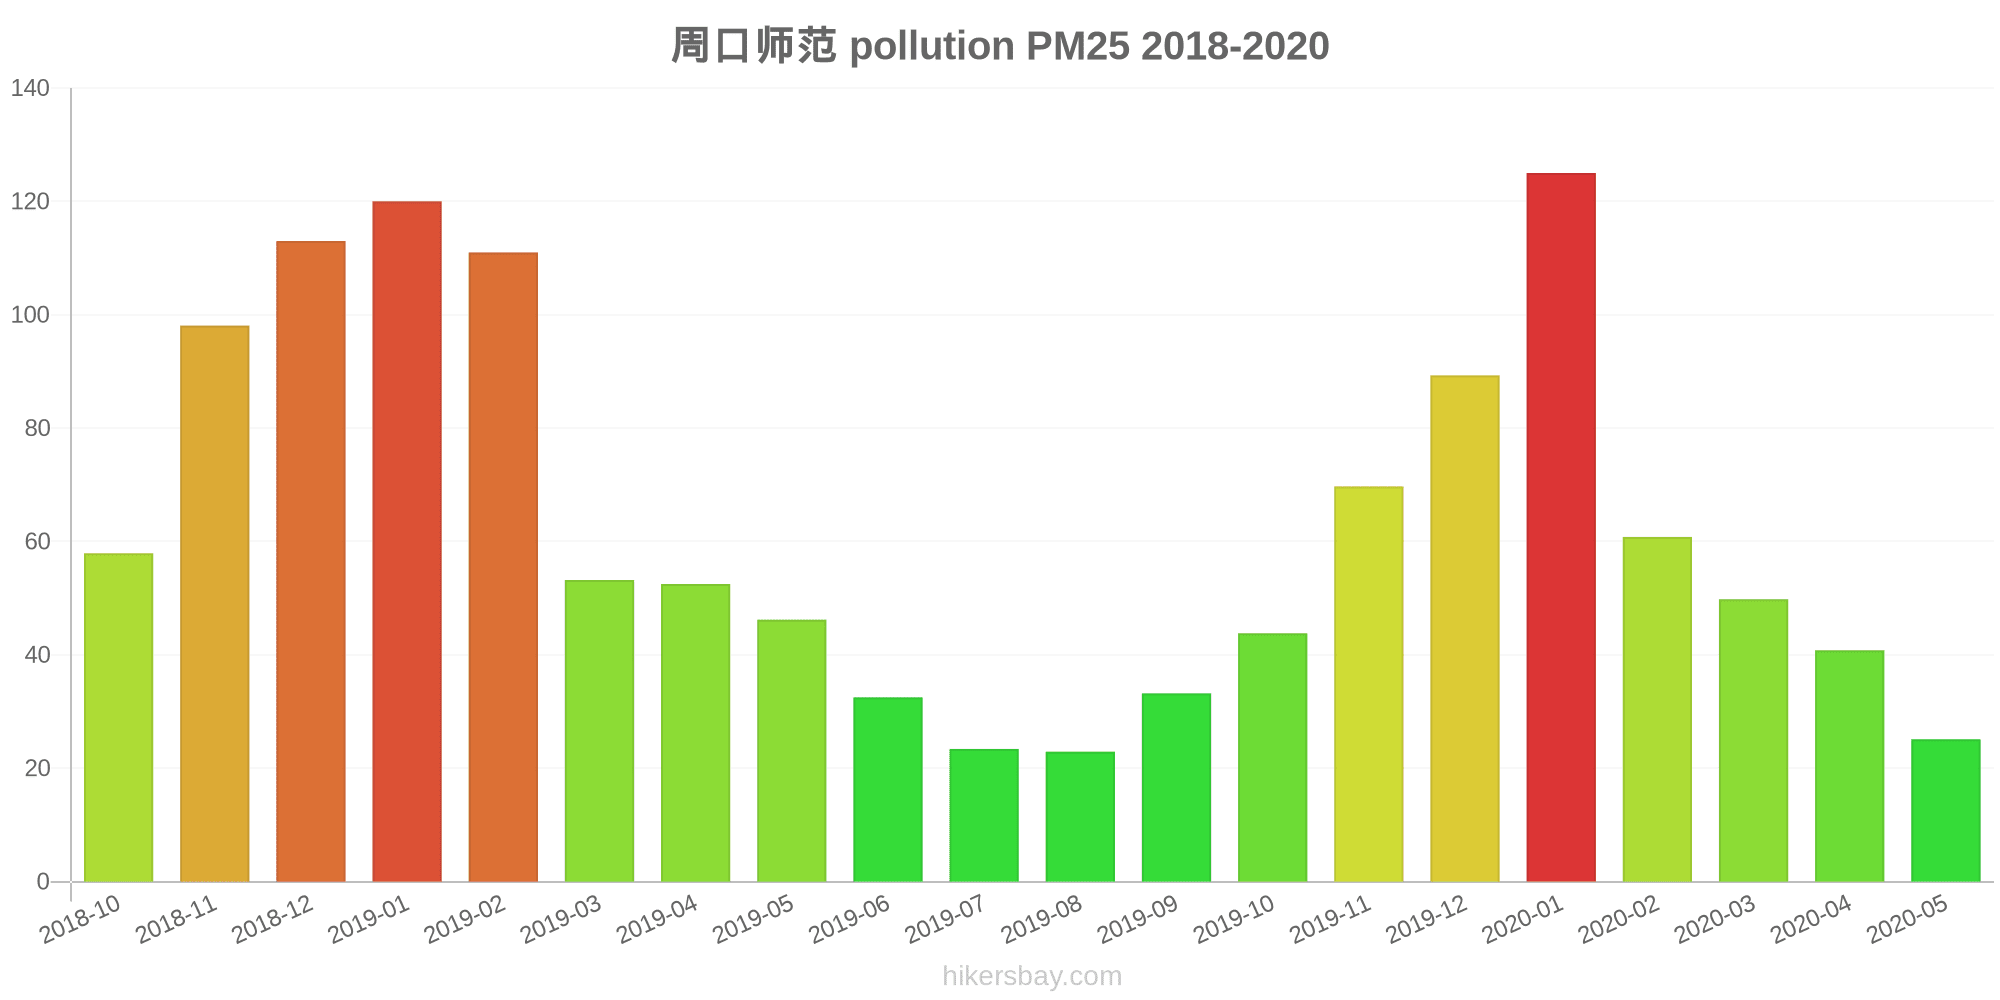
周口师范
index
2022-05-27
pm10
56
pm25
56
o3
0.03
no2
0
so2
0
周口师范
2018-10 2020-05
index
2020-05
2020-04
2020-03
2020-02
2020-01
2019-12
2019-11
2019-10
2019-09
2019-08
2019-07
2019-06
2019-05
2019-04
2019-03
2019-02
2019-01
2018-12
2018-11
2018-10
pm25
25
41
50
61
125
89
70
44
33
23
23
33
46
53
53
111
120
113
98
58
co
628
673
675
816
1
1
981
761
866
757
617
671
603
718
673
862
1
1
1
880
no2
13
24
24
17
27
40
38
33
22
16
14
17
24
20
30
22
39
40
37
42
o3
143
144
109
91
75
61
91
122
166
142
161
182
151
143
134
99
70
52
98
127
pm10
75
81
82
69
129
110
125
96
73
48
46
62
107
95
110
147
162
165
143
112
so2
8.2
10
8.8
6.7
8
8.7
14
11
10
8.3
8.6
7.4
8.7
8.9
11
9.3
12
13
13
15
* Pollution data source:
https://openaq.org
(ChinaAQIData)
The data is licensed under CC-By 4.0
PM10 179 (Very bad Hazardous)
PM2,5 35 (Unhealthy for Sensitive Groups)
O3 0 (Good)
NO2 0 (Good)
SO2 0 (Good)
Data on air pollution from recent days in Xiaolizhuang
| index | 2022-05-27 |
|---|---|
| pm10 | 56 Unhealthy for Sensitive Groups |
| pm25 | 56 Unhealthy |
| o3 | 0 Good |
| no2 | 0 Good |
| so2 | 0 Good |

| index | 2020-05 | 2020-04 | 2020-03 | 2020-02 | 2020-01 | 2019-12 | 2019-11 | 2019-10 | 2019-09 | 2019-08 | 2019-07 | 2019-06 | 2019-05 | 2019-04 | 2019-03 | 2019-02 | 2019-01 | 2018-12 | 2018-11 | 2018-10 |
|---|---|---|---|---|---|---|---|---|---|---|---|---|---|---|---|---|---|---|---|---|
| pm25 | 25 (Moderate) | 41 (Unhealthy for Sensitive Groups) | 50 (Unhealthy for Sensitive Groups) | 61 (Unhealthy) | 125 (Very bad Hazardous) | 89 (Very Unhealthy) | 70 (Unhealthy) | 44 (Unhealthy for Sensitive Groups) | 33 (Moderate) | 23 (Moderate) | 23 (Moderate) | 33 (Moderate) | 46 (Unhealthy for Sensitive Groups) | 53 (Unhealthy for Sensitive Groups) | 53 (Unhealthy for Sensitive Groups) | 111 (Very bad Hazardous) | 120 (Very bad Hazardous) | 113 (Very bad Hazardous) | 98 (Very Unhealthy) | 58 (Unhealthy) |
| co | 628 (Good) | 673 (Good) | 675 (Good) | 816 (Good) | 1 (Good) | 1 (Good) | 981 (Good) | 761 (Good) | 866 (Good) | 757 (Good) | 617 (Good) | 671 (Good) | 603 (Good) | 718 (Good) | 673 (Good) | 862 (Good) | 1 (Good) | 1 (Good) | 1 (Good) | 880 (Good) |
| no2 | 13 (Good) | 24 (Good) | 24 (Good) | 17 (Good) | 27 (Good) | 40 (Good) | 38 (Good) | 33 (Good) | 22 (Good) | 16 (Good) | 14 (Good) | 17 (Good) | 24 (Good) | 20 (Good) | 30 (Good) | 22 (Good) | 39 (Good) | 40 (Good) | 37 (Good) | 42 (Moderate) |
| o3 | 143 (Unhealthy for Sensitive Groups) | 144 (Unhealthy for Sensitive Groups) | 109 (Moderate) | 91 (Moderate) | 75 (Moderate) | 61 (Good) | 91 (Moderate) | 122 (Unhealthy for Sensitive Groups) | 166 (Unhealthy) | 142 (Unhealthy for Sensitive Groups) | 161 (Unhealthy) | 182 (Very Unhealthy) | 151 (Unhealthy) | 143 (Unhealthy for Sensitive Groups) | 134 (Unhealthy for Sensitive Groups) | 99 (Moderate) | 70 (Moderate) | 52 (Good) | 98 (Moderate) | 127 (Unhealthy for Sensitive Groups) |
| pm10 | 75 (Unhealthy for Sensitive Groups) | 81 (Unhealthy) | 82 (Unhealthy) | 69 (Unhealthy for Sensitive Groups) | 129 (Very Unhealthy) | 110 (Very Unhealthy) | 125 (Very Unhealthy) | 96 (Unhealthy) | 73 (Unhealthy for Sensitive Groups) | 48 (Moderate) | 46 (Moderate) | 62 (Unhealthy for Sensitive Groups) | 107 (Unhealthy) | 95 (Unhealthy) | 110 (Very Unhealthy) | 147 (Very Unhealthy) | 162 (Very bad Hazardous) | 165 (Very bad Hazardous) | 143 (Very Unhealthy) | 112 (Very Unhealthy) |
| so2 | 8.2 (Good) | 10 (Good) | 8.8 (Good) | 6.7 (Good) | 8 (Good) | 8.7 (Good) | 14 (Good) | 11 (Good) | 10 (Good) | 8.3 (Good) | 8.6 (Good) | 7.4 (Good) | 8.7 (Good) | 8.9 (Good) | 11 (Good) | 9.3 (Good) | 12 (Good) | 13 (Good) | 13 (Good) | 15 (Good) |
PM10 179 (Very bad Hazardous)
particulate matter (PM10) suspended dustPM2,5 35 (Unhealthy for Sensitive Groups)
particulate matter (PM2.5) dustO3 0.04 (Good)
ozone (O3)NO2 0 (Good)
nitrogen dioxide (NO2)SO2 0 (Good)
sulfur dioxide (SO2)周口师范
| index | 2022-05-27 |
|---|---|
| pm10 | 56 |
| pm25 | 56 |
| o3 | 0.03 |
| no2 | 0 |
| so2 | 0 |
周口师范
| index | 2020-05 | 2020-04 | 2020-03 | 2020-02 | 2020-01 | 2019-12 | 2019-11 | 2019-10 | 2019-09 | 2019-08 | 2019-07 | 2019-06 | 2019-05 | 2019-04 | 2019-03 | 2019-02 | 2019-01 | 2018-12 | 2018-11 | 2018-10 |
|---|---|---|---|---|---|---|---|---|---|---|---|---|---|---|---|---|---|---|---|---|
| pm25 | 25 | 41 | 50 | 61 | 125 | 89 | 70 | 44 | 33 | 23 | 23 | 33 | 46 | 53 | 53 | 111 | 120 | 113 | 98 | 58 |
| co | 628 | 673 | 675 | 816 | 1 | 1 | 981 | 761 | 866 | 757 | 617 | 671 | 603 | 718 | 673 | 862 | 1 | 1 | 1 | 880 |
| no2 | 13 | 24 | 24 | 17 | 27 | 40 | 38 | 33 | 22 | 16 | 14 | 17 | 24 | 20 | 30 | 22 | 39 | 40 | 37 | 42 |
| o3 | 143 | 144 | 109 | 91 | 75 | 61 | 91 | 122 | 166 | 142 | 161 | 182 | 151 | 143 | 134 | 99 | 70 | 52 | 98 | 127 |
| pm10 | 75 | 81 | 82 | 69 | 129 | 110 | 125 | 96 | 73 | 48 | 46 | 62 | 107 | 95 | 110 | 147 | 162 | 165 | 143 | 112 |
| so2 | 8.2 | 10 | 8.8 | 6.7 | 8 | 8.7 | 14 | 11 | 10 | 8.3 | 8.6 | 7.4 | 8.7 | 8.9 | 11 | 9.3 | 12 | 13 | 13 | 15 |