Air Pollution in Nanchaitun: Real-time Air Quality Index and smog alert.
Pollution and air quality forecast for Nanchaitun. Today is Tuesday, June 2, 2026. The following air pollution values have been recorded for Nanchaitun:- particulate matter (PM10) suspended dust - 179 (Very bad Hazardous)
- particulate matter (PM2.5) dust - 35 (Unhealthy for Sensitive Groups)
- ozone (O3) - 0 (Good)
- nitrogen dioxide (NO2) - 0 (Good)
- sulfur dioxide (SO2) - 0 (Good)

What is the air quality in Nanchaitun today? Is the air polluted in Nanchaitun?. Is there smog?
What is the level of PM10 today in Nanchaitun? (particulate matter (PM10) suspended dust)
The current level of particulate matter PM10 in Nanchaitun is:
179 (Very bad Hazardous)
The highest PM10 values usually occur in month: 165 (December 2018).
The lowest value of particulate matter PM10 pollution in Nanchaitun is usually recorded in: August (54).
What is the current level of PM2.5 in Nanchaitun? (particulate matter (PM2.5) dust)
Today's PM2.5 level is:
35 (Unhealthy for Sensitive Groups)
For comparison, the highest level of PM2.5 in Nanchaitun in the last 7 days was: 56 (Friday, May 27, 2022) and the lowest: 56 (Friday, May 27, 2022).
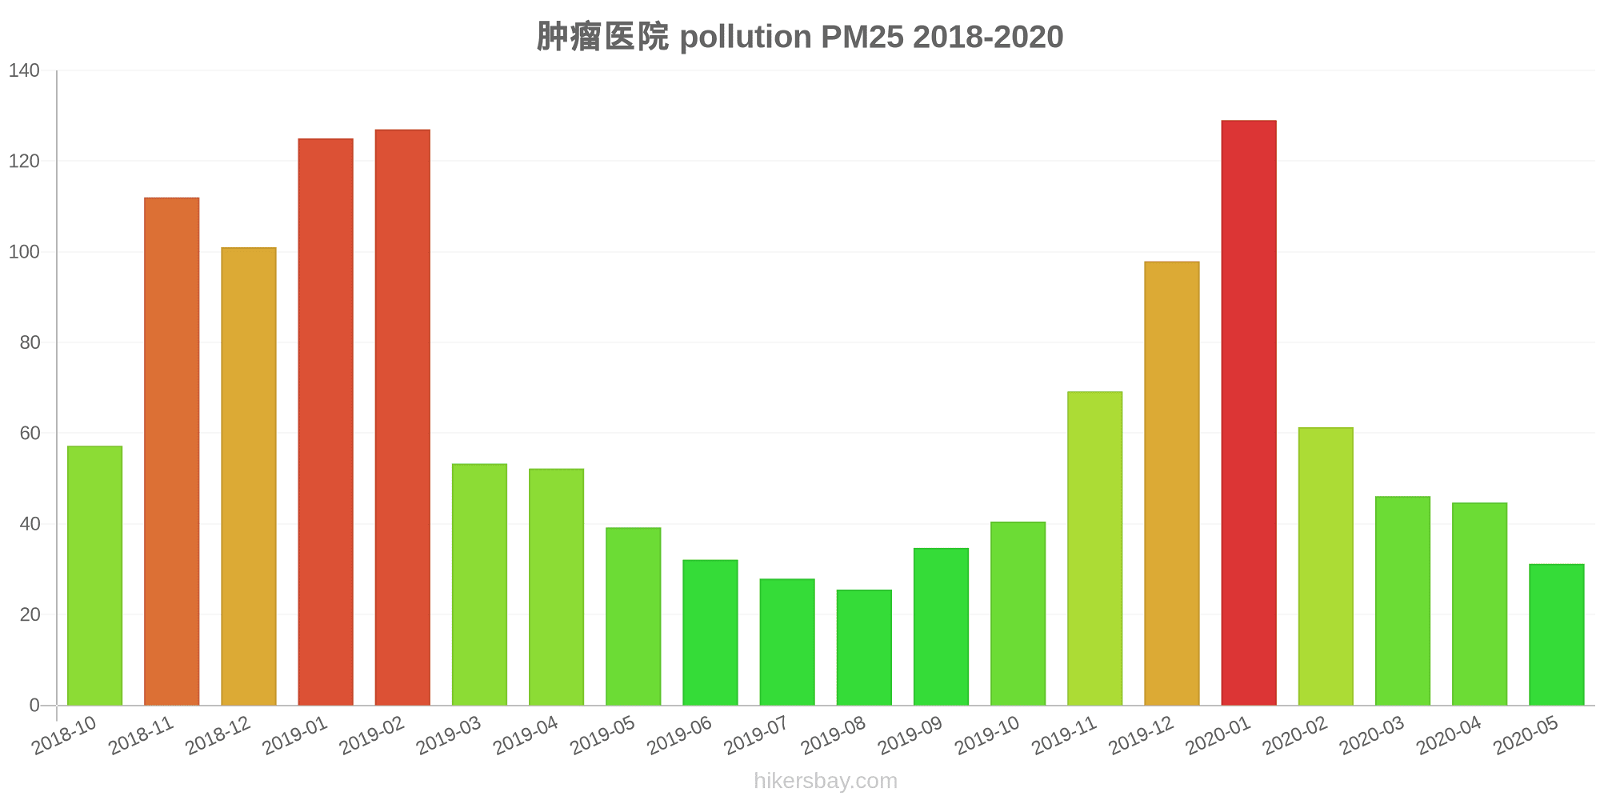
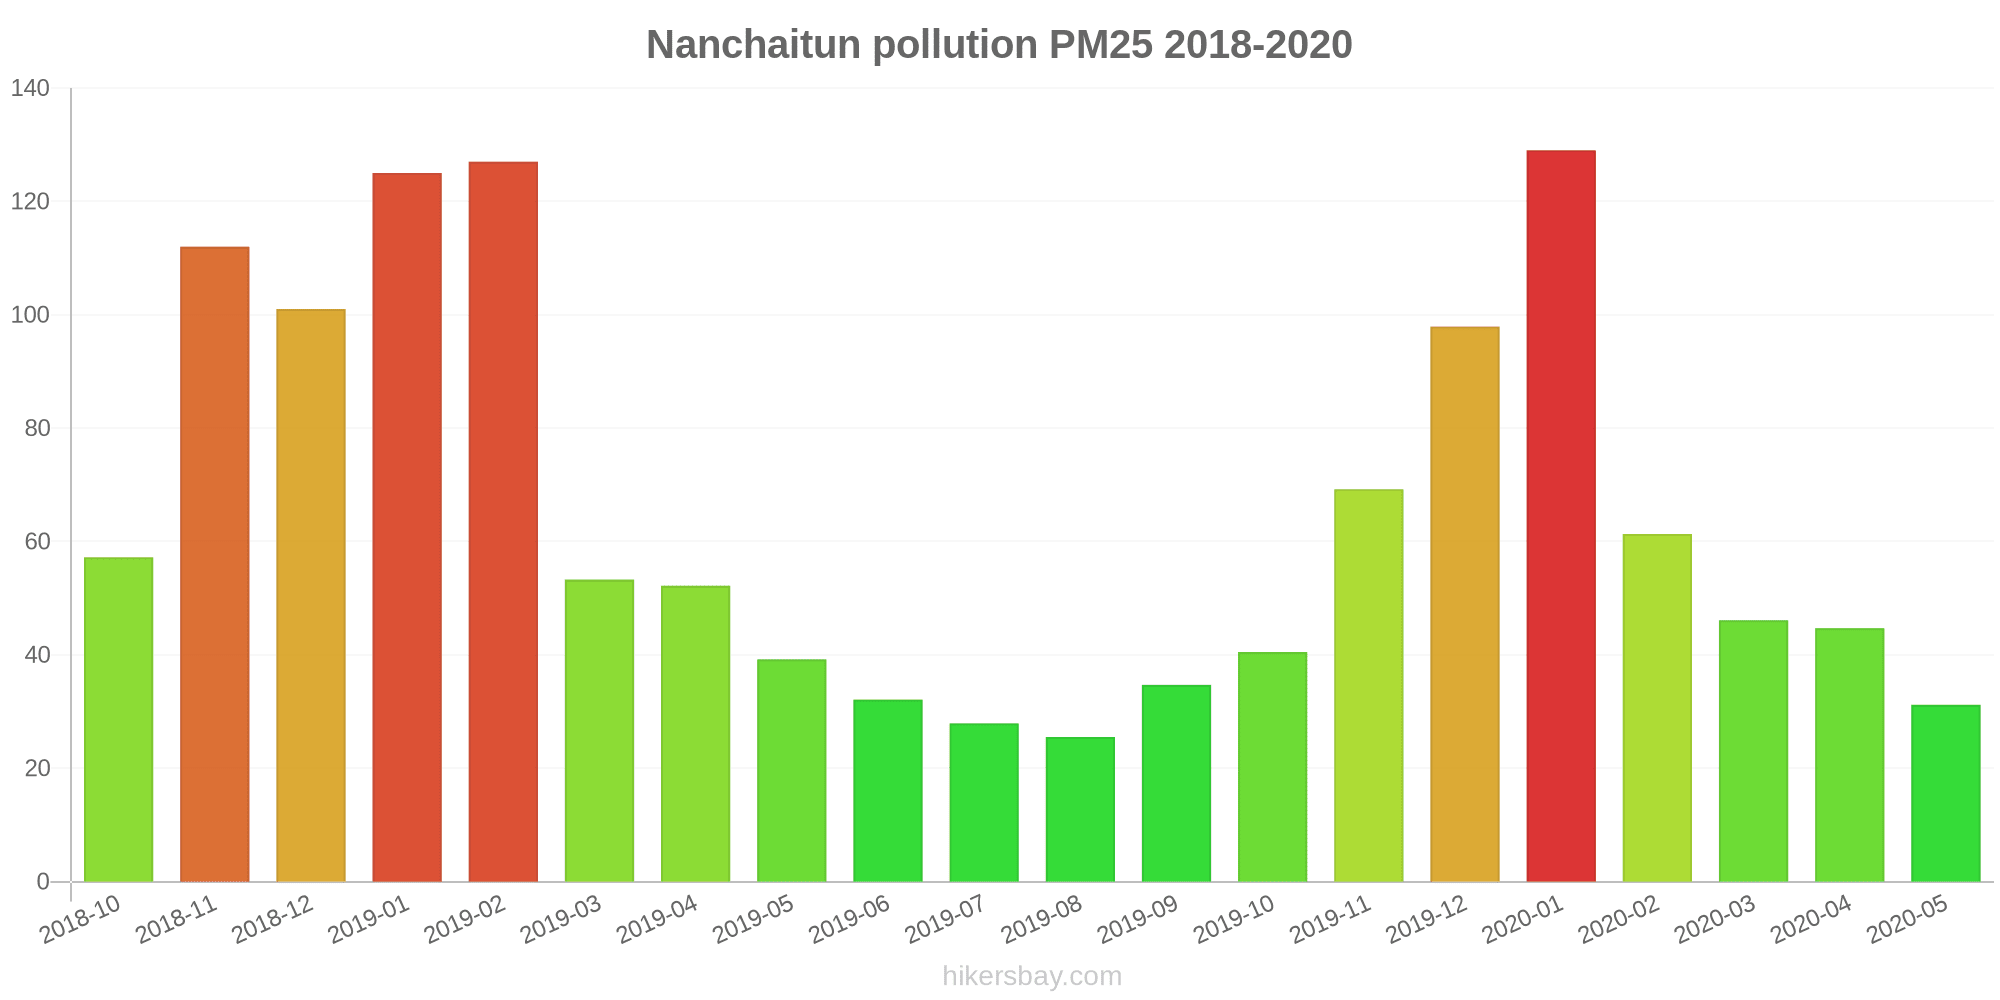
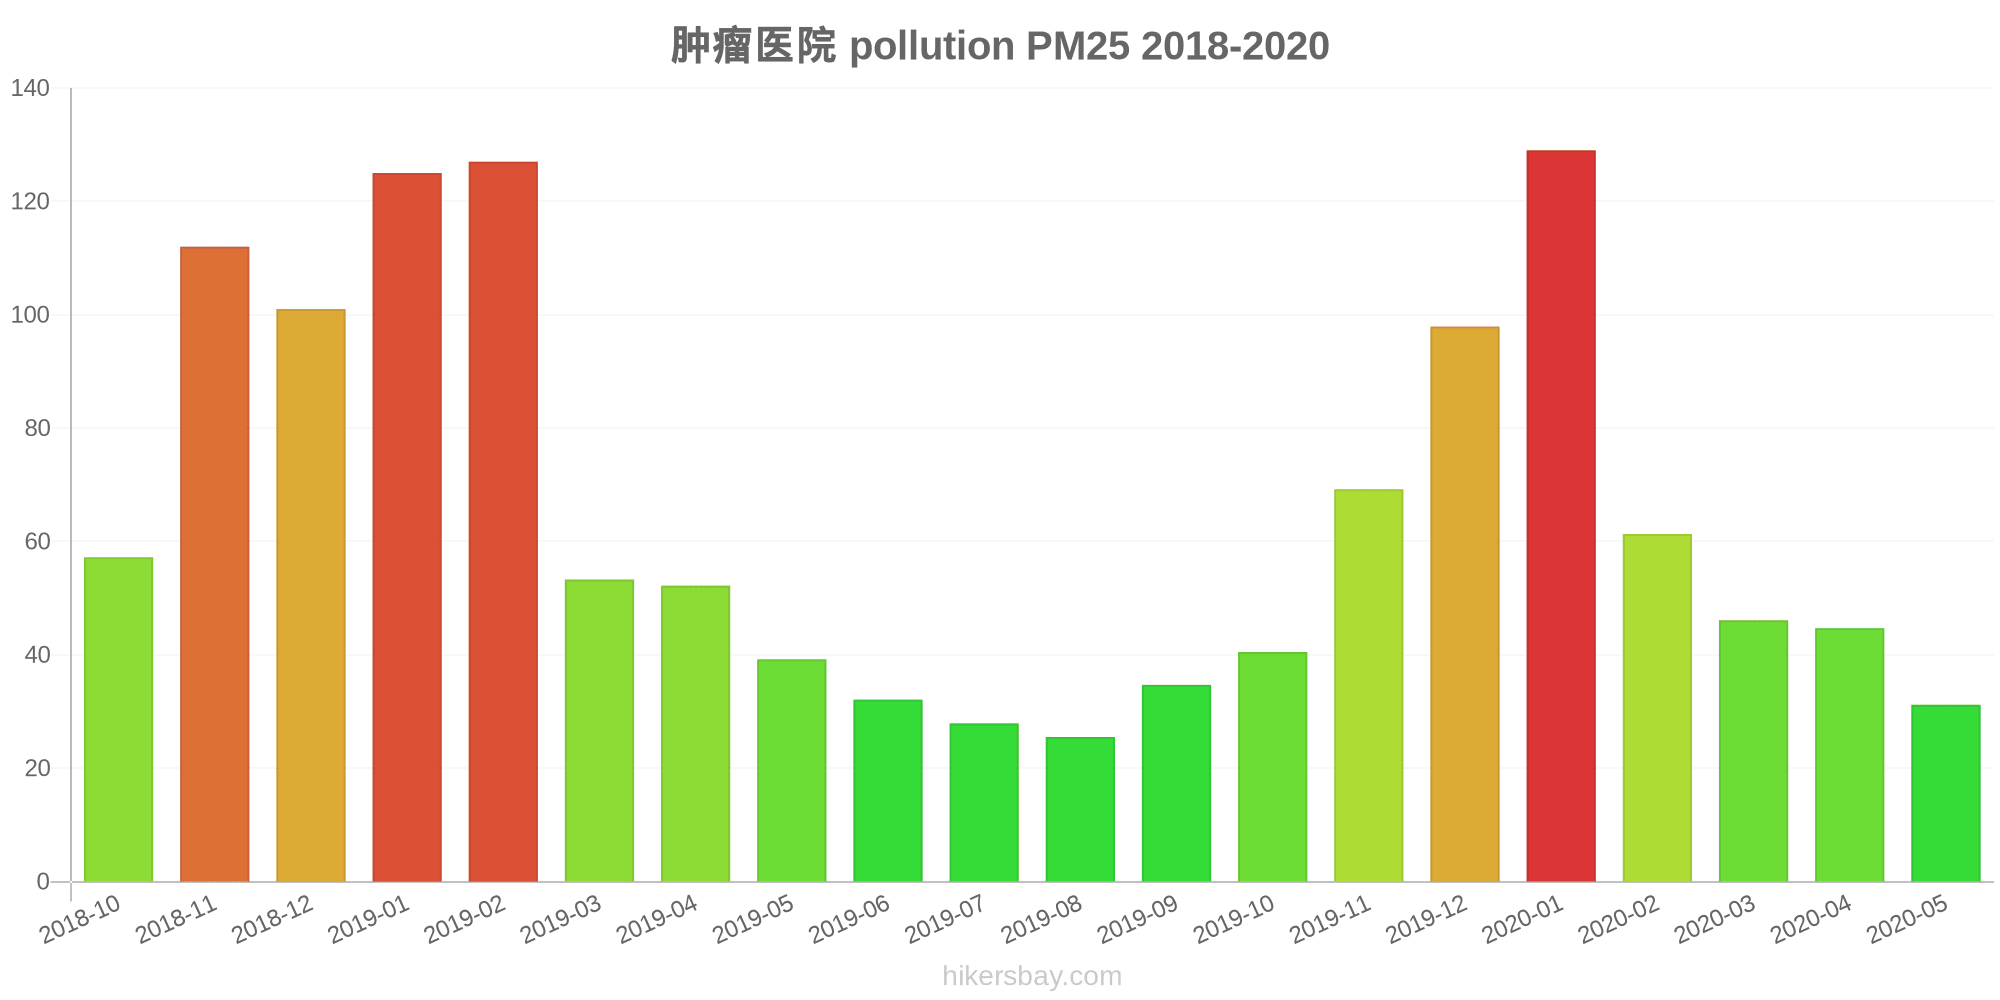
The highest PM2.5 values were recorded: 129 (January 2020).
The lowest level of particulate matter PM2.5 pollution occurs in month: August (26).
How is the O3 level today in Nanchaitun? (ozone (O3))
0 (Good)
How high is the level of NO2? (nitrogen dioxide (NO2))
0 (Good)
What is the level of SO2 pollution? (sulfur dioxide (SO2))
0 (Good)
Current data Friday, May 27, 2022, 12:00 PM
PM10 179 (Very bad Hazardous)
PM2,5 35 (Unhealthy for Sensitive Groups)
O3 0 (Good)
NO2 0 (Good)
SO2 0 (Good)
Data on air pollution from recent days in Nanchaitun
index
2022-05-27
pm10
56
Unhealthy for Sensitive Groups
pm25
56
Unhealthy
o3
0
Good
no2
0
Good
so2
0
Good
data source »
Air pollution in Nanchaitun from October 2018 to May 2020

index
2020-05
2020-04
2020-03
2020-02
2020-01
2019-12
2019-11
2019-10
2019-09
2019-08
2019-07
2019-06
2019-05
2019-04
2019-03
2019-02
2019-01
2018-12
2018-11
2018-10
pm25
31 (Moderate)
45 (Unhealthy for Sensitive Groups)
46 (Unhealthy for Sensitive Groups)
61 (Unhealthy)
129 (Very bad Hazardous)
98 (Very Unhealthy)
69 (Unhealthy)
41 (Unhealthy for Sensitive Groups)
35 (Moderate)
26 (Moderate)
28 (Moderate)
32 (Moderate)
39 (Unhealthy for Sensitive Groups)
52 (Unhealthy for Sensitive Groups)
53 (Unhealthy for Sensitive Groups)
127 (Very bad Hazardous)
125 (Very bad Hazardous)
101 (Very Unhealthy)
112 (Very bad Hazardous)
57 (Unhealthy)
co
701 (Good)
613 (Good)
652 (Good)
823 (Good)
1 (Good)
1 (Good)
981 (Good)
870 (Good)
891 (Good)
815 (Good)
815 (Good)
834 (Good)
666 (Good)
893 (Good)
881 (Good)
1 (Good)
1 (Good)
1 (Good)
1 (Good)
892 (Good)
no2
21 (Good)
27 (Good)
26 (Good)
15 (Good)
34 (Good)
48 (Moderate)
47 (Moderate)
40 (Moderate)
29 (Good)
20 (Good)
19 (Good)
20 (Good)
19 (Good)
21 (Good)
28 (Good)
34 (Good)
52 (Moderate)
54 (Moderate)
46 (Moderate)
47 (Moderate)
o3
149 (Unhealthy for Sensitive Groups)
131 (Unhealthy for Sensitive Groups)
108 (Moderate)
85 (Moderate)
75 (Moderate)
56 (Good)
86 (Moderate)
109 (Moderate)
159 (Unhealthy)
150 (Unhealthy)
182 (Very Unhealthy)
201 (Very Unhealthy)
168 (Unhealthy)
143 (Unhealthy for Sensitive Groups)
126 (Unhealthy for Sensitive Groups)
92 (Moderate)
62 (Good)
47 (Good)
90 (Moderate)
117 (Moderate)
pm10
95 (Unhealthy)
92 (Unhealthy)
93 (Unhealthy)
76 (Unhealthy for Sensitive Groups)
134 (Very Unhealthy)
117 (Very Unhealthy)
126 (Very Unhealthy)
93 (Unhealthy)
77 (Unhealthy for Sensitive Groups)
54 (Unhealthy for Sensitive Groups)
61 (Unhealthy for Sensitive Groups)
81 (Unhealthy)
110 (Very Unhealthy)
106 (Unhealthy)
105 (Unhealthy)
160 (Very bad Hazardous)
162 (Very bad Hazardous)
165 (Very bad Hazardous)
160 (Very bad Hazardous)
110 (Very Unhealthy)
so2
5 (Good)
8.5 (Good)
9.7 (Good)
6.2 (Good)
8.7 (Good)
8.6 (Good)
12 (Good)
9.9 (Good)
7.1 (Good)
6.8 (Good)
5.2 (Good)
6.8 (Good)
10 (Good)
11 (Good)
10 (Good)
14 (Good)
18 (Good)
20 (Good)
16 (Good)
30 (Good)
data source »
肿瘤医院
Friday, May 27, 2022, 12:00 PM
PM10 179 (Very bad Hazardous)
particulate matter (PM10) suspended dust
PM2,5 35 (Unhealthy for Sensitive Groups)
particulate matter (PM2.5) dust
O3 0.04 (Good)
ozone (O3)
NO2 0 (Good)
nitrogen dioxide (NO2)
SO2 0 (Good)
sulfur dioxide (SO2)
肿瘤医院
index
2022-05-27
pm10
56
pm25
56
o3
0.03
no2
0
so2
0
肿瘤医院
2018-10 2020-05
index
2020-05
2020-04
2020-03
2020-02
2020-01
2019-12
2019-11
2019-10
2019-09
2019-08
2019-07
2019-06
2019-05
2019-04
2019-03
2019-02
2019-01
2018-12
2018-11
2018-10
pm25
31
45
46
61
129
98
69
41
35
26
28
32
39
52
53
127
125
101
112
57
co
701
613
652
823
1
1
981
870
891
815
815
834
666
893
881
1
1
1
1
892
no2
21
27
26
15
34
48
47
40
29
20
19
20
19
21
28
34
52
54
46
47
o3
149
131
108
85
75
56
86
109
159
150
182
201
168
143
126
92
62
47
90
117
pm10
95
92
93
76
134
117
126
93
77
54
61
81
110
106
105
160
162
165
160
110
so2
5
8.5
9.7
6.2
8.7
8.6
12
9.9
7.1
6.8
5.2
6.8
10
11
10
14
18
20
16
30
* Pollution data source:
https://openaq.org
(ChinaAQIData)
The data is licensed under CC-By 4.0
PM10 179 (Very bad Hazardous)
PM2,5 35 (Unhealthy for Sensitive Groups)
O3 0 (Good)
NO2 0 (Good)
SO2 0 (Good)
Data on air pollution from recent days in Nanchaitun
| index | 2022-05-27 |
|---|---|
| pm10 | 56 Unhealthy for Sensitive Groups |
| pm25 | 56 Unhealthy |
| o3 | 0 Good |
| no2 | 0 Good |
| so2 | 0 Good |
| index | 2020-05 | 2020-04 | 2020-03 | 2020-02 | 2020-01 | 2019-12 | 2019-11 | 2019-10 | 2019-09 | 2019-08 | 2019-07 | 2019-06 | 2019-05 | 2019-04 | 2019-03 | 2019-02 | 2019-01 | 2018-12 | 2018-11 | 2018-10 |
|---|---|---|---|---|---|---|---|---|---|---|---|---|---|---|---|---|---|---|---|---|
| pm25 | 31 (Moderate) | 45 (Unhealthy for Sensitive Groups) | 46 (Unhealthy for Sensitive Groups) | 61 (Unhealthy) | 129 (Very bad Hazardous) | 98 (Very Unhealthy) | 69 (Unhealthy) | 41 (Unhealthy for Sensitive Groups) | 35 (Moderate) | 26 (Moderate) | 28 (Moderate) | 32 (Moderate) | 39 (Unhealthy for Sensitive Groups) | 52 (Unhealthy for Sensitive Groups) | 53 (Unhealthy for Sensitive Groups) | 127 (Very bad Hazardous) | 125 (Very bad Hazardous) | 101 (Very Unhealthy) | 112 (Very bad Hazardous) | 57 (Unhealthy) |
| co | 701 (Good) | 613 (Good) | 652 (Good) | 823 (Good) | 1 (Good) | 1 (Good) | 981 (Good) | 870 (Good) | 891 (Good) | 815 (Good) | 815 (Good) | 834 (Good) | 666 (Good) | 893 (Good) | 881 (Good) | 1 (Good) | 1 (Good) | 1 (Good) | 1 (Good) | 892 (Good) |
| no2 | 21 (Good) | 27 (Good) | 26 (Good) | 15 (Good) | 34 (Good) | 48 (Moderate) | 47 (Moderate) | 40 (Moderate) | 29 (Good) | 20 (Good) | 19 (Good) | 20 (Good) | 19 (Good) | 21 (Good) | 28 (Good) | 34 (Good) | 52 (Moderate) | 54 (Moderate) | 46 (Moderate) | 47 (Moderate) |
| o3 | 149 (Unhealthy for Sensitive Groups) | 131 (Unhealthy for Sensitive Groups) | 108 (Moderate) | 85 (Moderate) | 75 (Moderate) | 56 (Good) | 86 (Moderate) | 109 (Moderate) | 159 (Unhealthy) | 150 (Unhealthy) | 182 (Very Unhealthy) | 201 (Very Unhealthy) | 168 (Unhealthy) | 143 (Unhealthy for Sensitive Groups) | 126 (Unhealthy for Sensitive Groups) | 92 (Moderate) | 62 (Good) | 47 (Good) | 90 (Moderate) | 117 (Moderate) |
| pm10 | 95 (Unhealthy) | 92 (Unhealthy) | 93 (Unhealthy) | 76 (Unhealthy for Sensitive Groups) | 134 (Very Unhealthy) | 117 (Very Unhealthy) | 126 (Very Unhealthy) | 93 (Unhealthy) | 77 (Unhealthy for Sensitive Groups) | 54 (Unhealthy for Sensitive Groups) | 61 (Unhealthy for Sensitive Groups) | 81 (Unhealthy) | 110 (Very Unhealthy) | 106 (Unhealthy) | 105 (Unhealthy) | 160 (Very bad Hazardous) | 162 (Very bad Hazardous) | 165 (Very bad Hazardous) | 160 (Very bad Hazardous) | 110 (Very Unhealthy) |
| so2 | 5 (Good) | 8.5 (Good) | 9.7 (Good) | 6.2 (Good) | 8.7 (Good) | 8.6 (Good) | 12 (Good) | 9.9 (Good) | 7.1 (Good) | 6.8 (Good) | 5.2 (Good) | 6.8 (Good) | 10 (Good) | 11 (Good) | 10 (Good) | 14 (Good) | 18 (Good) | 20 (Good) | 16 (Good) | 30 (Good) |
PM10 179 (Very bad Hazardous)
particulate matter (PM10) suspended dustPM2,5 35 (Unhealthy for Sensitive Groups)
particulate matter (PM2.5) dustO3 0.04 (Good)
ozone (O3)NO2 0 (Good)
nitrogen dioxide (NO2)SO2 0 (Good)
sulfur dioxide (SO2)肿瘤医院
| index | 2022-05-27 |
|---|---|
| pm10 | 56 |
| pm25 | 56 |
| o3 | 0.03 |
| no2 | 0 |
| so2 | 0 |
肿瘤医院
| index | 2020-05 | 2020-04 | 2020-03 | 2020-02 | 2020-01 | 2019-12 | 2019-11 | 2019-10 | 2019-09 | 2019-08 | 2019-07 | 2019-06 | 2019-05 | 2019-04 | 2019-03 | 2019-02 | 2019-01 | 2018-12 | 2018-11 | 2018-10 |
|---|---|---|---|---|---|---|---|---|---|---|---|---|---|---|---|---|---|---|---|---|
| pm25 | 31 | 45 | 46 | 61 | 129 | 98 | 69 | 41 | 35 | 26 | 28 | 32 | 39 | 52 | 53 | 127 | 125 | 101 | 112 | 57 |
| co | 701 | 613 | 652 | 823 | 1 | 1 | 981 | 870 | 891 | 815 | 815 | 834 | 666 | 893 | 881 | 1 | 1 | 1 | 1 | 892 |
| no2 | 21 | 27 | 26 | 15 | 34 | 48 | 47 | 40 | 29 | 20 | 19 | 20 | 19 | 21 | 28 | 34 | 52 | 54 | 46 | 47 |
| o3 | 149 | 131 | 108 | 85 | 75 | 56 | 86 | 109 | 159 | 150 | 182 | 201 | 168 | 143 | 126 | 92 | 62 | 47 | 90 | 117 |
| pm10 | 95 | 92 | 93 | 76 | 134 | 117 | 126 | 93 | 77 | 54 | 61 | 81 | 110 | 106 | 105 | 160 | 162 | 165 | 160 | 110 |
| so2 | 5 | 8.5 | 9.7 | 6.2 | 8.7 | 8.6 | 12 | 9.9 | 7.1 | 6.8 | 5.2 | 6.8 | 10 | 11 | 10 | 14 | 18 | 20 | 16 | 30 |