Air Pollution in Xicaitun: Real-time Air Quality Index and smog alert.
Pollution and air quality forecast for Xicaitun. Today is Tuesday, June 2, 2026. The following air pollution values have been recorded for Xicaitun:- particulate matter (PM10) suspended dust - 179 (Very bad Hazardous)
- particulate matter (PM2.5) dust - 35 (Unhealthy for Sensitive Groups)
- ozone (O3) - 0 (Good)
- nitrogen dioxide (NO2) - 0 (Good)
- sulfur dioxide (SO2) - 0 (Good)

What is the air quality in Xicaitun today? Is the air polluted in Xicaitun?. Is there smog?
What is the level of PM10 today in Xicaitun? (particulate matter (PM10) suspended dust)
The current level of particulate matter PM10 in Xicaitun is:
179 (Very bad Hazardous)
The highest PM10 values usually occur in month: 159 (December 2018).
The lowest value of particulate matter PM10 pollution in Xicaitun is usually recorded in: August (52).
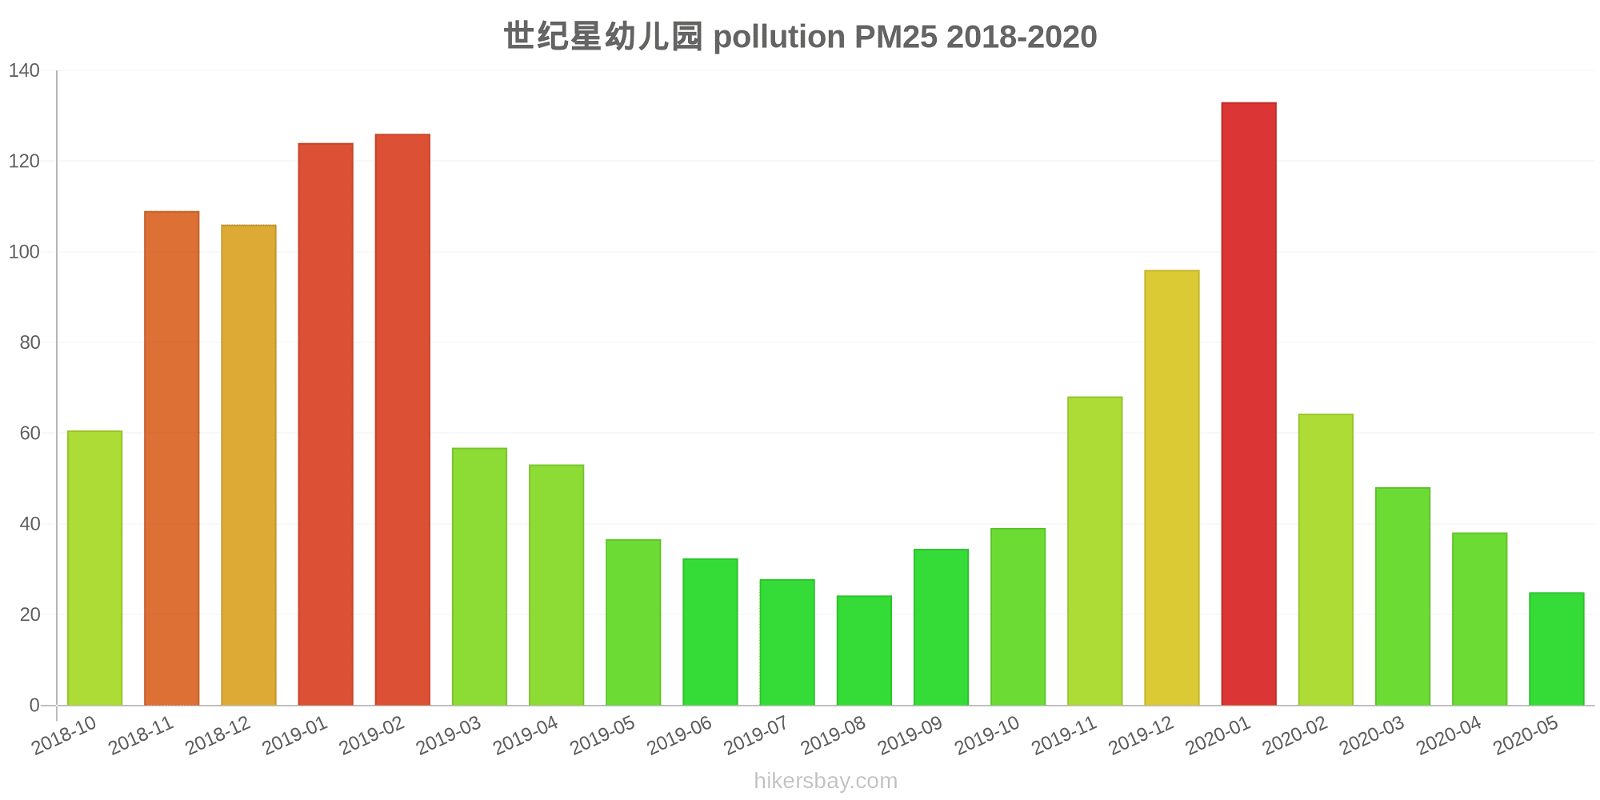
What is the current level of PM2.5 in Xicaitun? (particulate matter (PM2.5) dust)
Today's PM2.5 level is:
35 (Unhealthy for Sensitive Groups)
For comparison, the highest level of PM2.5 in Xicaitun in the last 7 days was: 56 (Friday, May 27, 2022) and the lowest: 56 (Friday, May 27, 2022).
The highest PM2.5 values were recorded: 133 (January 2020).
The lowest level of particulate matter PM2.5 pollution occurs in month: August (24).
How is the O3 level today in Xicaitun? (ozone (O3))
0 (Good)
How high is the level of NO2? (nitrogen dioxide (NO2))
0 (Good)
What is the level of SO2 pollution? (sulfur dioxide (SO2))
0 (Good)
Current data Friday, May 27, 2022, 12:00 PM
PM10 179 (Very bad Hazardous)
PM2,5 35 (Unhealthy for Sensitive Groups)
O3 0 (Good)
NO2 0 (Good)
SO2 0 (Good)
Data on air pollution from recent days in Xicaitun
index
2022-05-27
pm10
56
Unhealthy for Sensitive Groups
pm25
56
Unhealthy
o3
0
Good
no2
0
Good
so2
0
Good
data source »
Air pollution in Xicaitun from October 2018 to May 2020

index
2020-05
2020-04
2020-03
2020-02
2020-01
2019-12
2019-11
2019-10
2019-09
2019-08
2019-07
2019-06
2019-05
2019-04
2019-03
2019-02
2019-01
2018-12
2018-11
2018-10
pm25
25 (Moderate)
38 (Unhealthy for Sensitive Groups)
48 (Unhealthy for Sensitive Groups)
64 (Unhealthy)
133 (Very bad Hazardous)
96 (Very Unhealthy)
68 (Unhealthy)
39 (Unhealthy for Sensitive Groups)
35 (Moderate)
24 (Moderate)
28 (Moderate)
32 (Moderate)
37 (Unhealthy for Sensitive Groups)
53 (Unhealthy for Sensitive Groups)
57 (Unhealthy)
126 (Very bad Hazardous)
124 (Very bad Hazardous)
106 (Very Unhealthy)
109 (Very Unhealthy)
61 (Unhealthy)
co
615 (Good)
611 (Good)
640 (Good)
940 (Good)
1 (Good)
1 (Good)
822 (Good)
751 (Good)
739 (Good)
761 (Good)
739 (Good)
762 (Good)
598 (Good)
896 (Good)
847 (Good)
1 (Good)
1 (Good)
1 (Good)
1 (Good)
941 (Good)
no2
19 (Good)
29 (Good)
29 (Good)
17 (Good)
38 (Good)
49 (Moderate)
46 (Moderate)
38 (Good)
28 (Good)
20 (Good)
17 (Good)
18 (Good)
23 (Good)
27 (Good)
32 (Good)
36 (Good)
53 (Moderate)
57 (Moderate)
49 (Moderate)
47 (Moderate)
o3
151 (Unhealthy)
134 (Unhealthy for Sensitive Groups)
109 (Moderate)
85 (Moderate)
73 (Moderate)
56 (Good)
87 (Moderate)
109 (Moderate)
160 (Unhealthy)
152 (Unhealthy)
185 (Very Unhealthy)
203 (Very Unhealthy)
181 (Very Unhealthy)
151 (Unhealthy)
128 (Unhealthy for Sensitive Groups)
99 (Moderate)
63 (Good)
50 (Good)
90 (Moderate)
116 (Moderate)
pm10
76 (Unhealthy for Sensitive Groups)
83 (Unhealthy)
87 (Unhealthy)
71 (Unhealthy for Sensitive Groups)
124 (Very Unhealthy)
107 (Unhealthy)
120 (Very Unhealthy)
90 (Unhealthy)
74 (Unhealthy for Sensitive Groups)
52 (Unhealthy for Sensitive Groups)
62 (Unhealthy for Sensitive Groups)
77 (Unhealthy for Sensitive Groups)
93 (Unhealthy)
99 (Unhealthy)
102 (Unhealthy)
151 (Very bad Hazardous)
149 (Very Unhealthy)
159 (Very bad Hazardous)
154 (Very bad Hazardous)
105 (Unhealthy)
so2
5.9 (Good)
9.2 (Good)
8.7 (Good)
6.5 (Good)
11 (Good)
8.9 (Good)
11 (Good)
9.7 (Good)
6.9 (Good)
4.7 (Good)
3.8 (Good)
7.8 (Good)
11 (Good)
12 (Good)
12 (Good)
14 (Good)
18 (Good)
19 (Good)
19 (Good)
25 (Good)
data source »
世纪星幼儿园
Friday, May 27, 2022, 12:00 PM
PM10 179 (Very bad Hazardous)
particulate matter (PM10) suspended dust
PM2,5 35 (Unhealthy for Sensitive Groups)
particulate matter (PM2.5) dust
O3 0.04 (Good)
ozone (O3)
NO2 0 (Good)
nitrogen dioxide (NO2)
SO2 0 (Good)
sulfur dioxide (SO2)
世纪星幼儿园
index
2022-05-27
pm10
56
pm25
56
o3
0.03
no2
0
so2
0
世纪星幼儿园
2018-10 2020-05
index
2020-05
2020-04
2020-03
2020-02
2020-01
2019-12
2019-11
2019-10
2019-09
2019-08
2019-07
2019-06
2019-05
2019-04
2019-03
2019-02
2019-01
2018-12
2018-11
2018-10
pm25
25
38
48
64
133
96
68
39
35
24
28
32
37
53
57
126
124
106
109
61
co
615
611
640
940
1
1
822
751
739
761
739
762
598
896
847
1
1
1
1
941
no2
19
29
29
17
38
49
46
38
28
20
17
18
23
27
32
36
53
57
49
47
o3
151
134
109
85
73
56
87
109
160
152
185
203
181
151
128
99
63
50
90
116
pm10
76
83
87
71
124
107
120
90
74
52
62
77
93
99
102
151
149
159
154
105
so2
5.9
9.2
8.7
6.5
11
8.9
11
9.7
6.9
4.7
3.8
7.8
11
12
12
14
18
19
19
25
* Pollution data source:
https://openaq.org
(ChinaAQIData)
The data is licensed under CC-By 4.0
PM10 179 (Very bad Hazardous)
PM2,5 35 (Unhealthy for Sensitive Groups)
O3 0 (Good)
NO2 0 (Good)
SO2 0 (Good)
Data on air pollution from recent days in Xicaitun
| index | 2022-05-27 |
|---|---|
| pm10 | 56 Unhealthy for Sensitive Groups |
| pm25 | 56 Unhealthy |
| o3 | 0 Good |
| no2 | 0 Good |
| so2 | 0 Good |

| index | 2020-05 | 2020-04 | 2020-03 | 2020-02 | 2020-01 | 2019-12 | 2019-11 | 2019-10 | 2019-09 | 2019-08 | 2019-07 | 2019-06 | 2019-05 | 2019-04 | 2019-03 | 2019-02 | 2019-01 | 2018-12 | 2018-11 | 2018-10 |
|---|---|---|---|---|---|---|---|---|---|---|---|---|---|---|---|---|---|---|---|---|
| pm25 | 25 (Moderate) | 38 (Unhealthy for Sensitive Groups) | 48 (Unhealthy for Sensitive Groups) | 64 (Unhealthy) | 133 (Very bad Hazardous) | 96 (Very Unhealthy) | 68 (Unhealthy) | 39 (Unhealthy for Sensitive Groups) | 35 (Moderate) | 24 (Moderate) | 28 (Moderate) | 32 (Moderate) | 37 (Unhealthy for Sensitive Groups) | 53 (Unhealthy for Sensitive Groups) | 57 (Unhealthy) | 126 (Very bad Hazardous) | 124 (Very bad Hazardous) | 106 (Very Unhealthy) | 109 (Very Unhealthy) | 61 (Unhealthy) |
| co | 615 (Good) | 611 (Good) | 640 (Good) | 940 (Good) | 1 (Good) | 1 (Good) | 822 (Good) | 751 (Good) | 739 (Good) | 761 (Good) | 739 (Good) | 762 (Good) | 598 (Good) | 896 (Good) | 847 (Good) | 1 (Good) | 1 (Good) | 1 (Good) | 1 (Good) | 941 (Good) |
| no2 | 19 (Good) | 29 (Good) | 29 (Good) | 17 (Good) | 38 (Good) | 49 (Moderate) | 46 (Moderate) | 38 (Good) | 28 (Good) | 20 (Good) | 17 (Good) | 18 (Good) | 23 (Good) | 27 (Good) | 32 (Good) | 36 (Good) | 53 (Moderate) | 57 (Moderate) | 49 (Moderate) | 47 (Moderate) |
| o3 | 151 (Unhealthy) | 134 (Unhealthy for Sensitive Groups) | 109 (Moderate) | 85 (Moderate) | 73 (Moderate) | 56 (Good) | 87 (Moderate) | 109 (Moderate) | 160 (Unhealthy) | 152 (Unhealthy) | 185 (Very Unhealthy) | 203 (Very Unhealthy) | 181 (Very Unhealthy) | 151 (Unhealthy) | 128 (Unhealthy for Sensitive Groups) | 99 (Moderate) | 63 (Good) | 50 (Good) | 90 (Moderate) | 116 (Moderate) |
| pm10 | 76 (Unhealthy for Sensitive Groups) | 83 (Unhealthy) | 87 (Unhealthy) | 71 (Unhealthy for Sensitive Groups) | 124 (Very Unhealthy) | 107 (Unhealthy) | 120 (Very Unhealthy) | 90 (Unhealthy) | 74 (Unhealthy for Sensitive Groups) | 52 (Unhealthy for Sensitive Groups) | 62 (Unhealthy for Sensitive Groups) | 77 (Unhealthy for Sensitive Groups) | 93 (Unhealthy) | 99 (Unhealthy) | 102 (Unhealthy) | 151 (Very bad Hazardous) | 149 (Very Unhealthy) | 159 (Very bad Hazardous) | 154 (Very bad Hazardous) | 105 (Unhealthy) |
| so2 | 5.9 (Good) | 9.2 (Good) | 8.7 (Good) | 6.5 (Good) | 11 (Good) | 8.9 (Good) | 11 (Good) | 9.7 (Good) | 6.9 (Good) | 4.7 (Good) | 3.8 (Good) | 7.8 (Good) | 11 (Good) | 12 (Good) | 12 (Good) | 14 (Good) | 18 (Good) | 19 (Good) | 19 (Good) | 25 (Good) |
PM10 179 (Very bad Hazardous)
particulate matter (PM10) suspended dustPM2,5 35 (Unhealthy for Sensitive Groups)
particulate matter (PM2.5) dustO3 0.04 (Good)
ozone (O3)NO2 0 (Good)
nitrogen dioxide (NO2)SO2 0 (Good)
sulfur dioxide (SO2)世纪星幼儿园
| index | 2022-05-27 |
|---|---|
| pm10 | 56 |
| pm25 | 56 |
| o3 | 0.03 |
| no2 | 0 |
| so2 | 0 |
世纪星幼儿园

| index | 2020-05 | 2020-04 | 2020-03 | 2020-02 | 2020-01 | 2019-12 | 2019-11 | 2019-10 | 2019-09 | 2019-08 | 2019-07 | 2019-06 | 2019-05 | 2019-04 | 2019-03 | 2019-02 | 2019-01 | 2018-12 | 2018-11 | 2018-10 |
|---|---|---|---|---|---|---|---|---|---|---|---|---|---|---|---|---|---|---|---|---|
| pm25 | 25 | 38 | 48 | 64 | 133 | 96 | 68 | 39 | 35 | 24 | 28 | 32 | 37 | 53 | 57 | 126 | 124 | 106 | 109 | 61 |
| co | 615 | 611 | 640 | 940 | 1 | 1 | 822 | 751 | 739 | 761 | 739 | 762 | 598 | 896 | 847 | 1 | 1 | 1 | 1 | 941 |
| no2 | 19 | 29 | 29 | 17 | 38 | 49 | 46 | 38 | 28 | 20 | 17 | 18 | 23 | 27 | 32 | 36 | 53 | 57 | 49 | 47 |
| o3 | 151 | 134 | 109 | 85 | 73 | 56 | 87 | 109 | 160 | 152 | 185 | 203 | 181 | 151 | 128 | 99 | 63 | 50 | 90 | 116 |
| pm10 | 76 | 83 | 87 | 71 | 124 | 107 | 120 | 90 | 74 | 52 | 62 | 77 | 93 | 99 | 102 | 151 | 149 | 159 | 154 | 105 |
| so2 | 5.9 | 9.2 | 8.7 | 6.5 | 11 | 8.9 | 11 | 9.7 | 6.9 | 4.7 | 3.8 | 7.8 | 11 | 12 | 12 | 14 | 18 | 19 | 19 | 25 |