Air Pollution in Caochongcun: Real-time Air Quality Index and smog alert.
Pollution and air quality forecast for Caochongcun. Today is Tuesday, June 16, 2026. The following air pollution values have been recorded for Caochongcun:- particulate matter (PM10) suspended dust - 7 (Good)
- particulate matter (PM2.5) dust - 2 (Good)
- carbon monoxide (CO) - 100 (Good)
- nitrogen dioxide (NO2) - 8 (Good)
- ozone (O3) - 0 (Good)
- sulfur dioxide (SO2) - 9 (Good)

What is the air quality in Caochongcun today? Is the air polluted in Caochongcun?. Is there smog?
What is the level of PM10 today in Caochongcun? (particulate matter (PM10) suspended dust)
The current level of particulate matter PM10 in Caochongcun is:
7 (Good)
The highest PM10 values usually occur in month: 106 (January 2019).
The lowest value of particulate matter PM10 pollution in Caochongcun is usually recorded in: February (43).
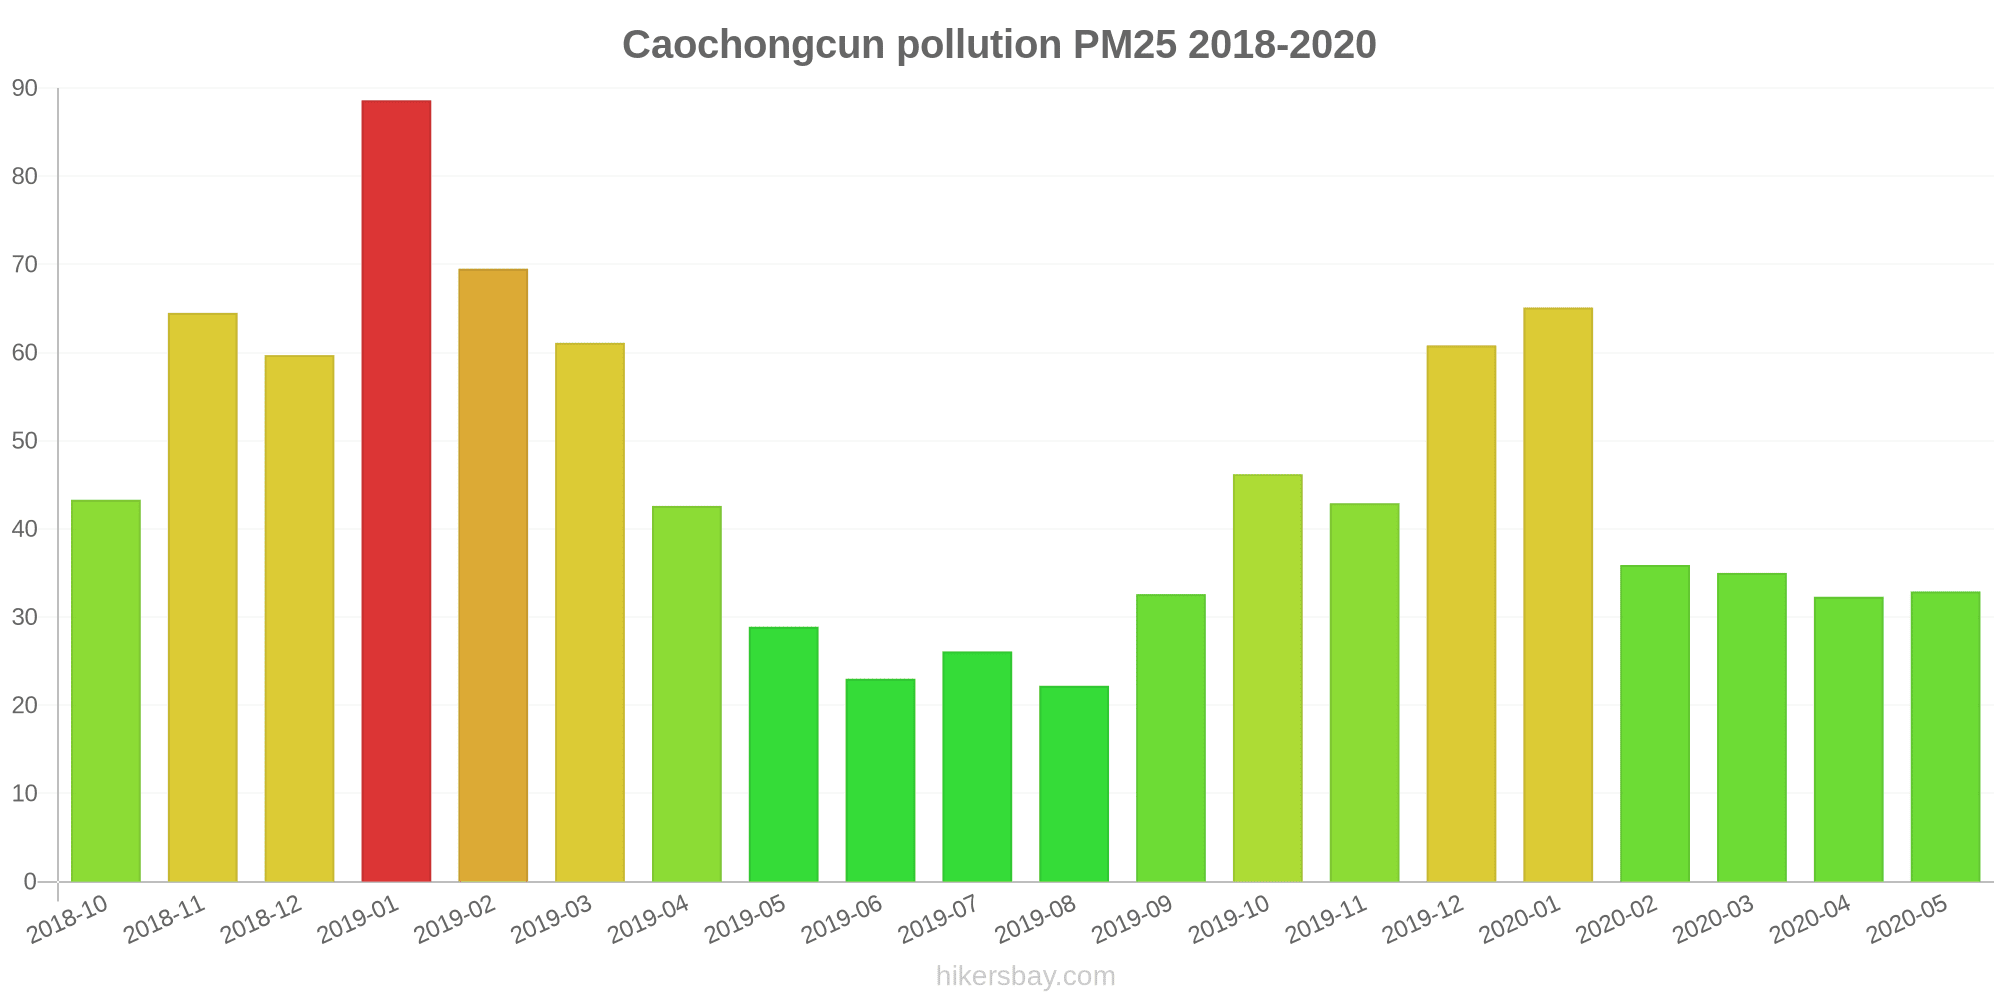
What is the current level of PM2.5 in Caochongcun? (particulate matter (PM2.5) dust)
Today's PM2.5 level is:
2 (Good)
For comparison, the highest level of PM2.5 in Caochongcun in the last 7 days was: 24 (Friday, May 27, 2022) and the lowest: 24 (Friday, May 27, 2022).
The highest PM2.5 values were recorded: 89 (January 2019).
The lowest level of particulate matter PM2.5 pollution occurs in month: August (22).
How high is the CO level? (carbon monoxide (CO))
100 (Good)
How high is the level of NO2? (nitrogen dioxide (NO2))
8 (Good)
How is the O3 level today in Caochongcun? (ozone (O3))
0 (Good)
What is the level of SO2 pollution? (sulfur dioxide (SO2))
9 (Good)
Current data Friday, May 27, 2022, 12:00 PM
PM10 7 (Good)
PM2,5 2 (Good)
CO 100 (Good)
NO2 8 (Good)
O3 0 (Good)
SO2 9 (Good)
Data on air pollution from recent days in Caochongcun
index
2022-05-27
pm10
32
Moderate
pm25
24
Moderate
co
468
Good
no2
21
Good
o3
32
Good
so2
5
Good
data source »
Air pollution in Caochongcun from October 2018 to May 2020

index
2020-05
2020-04
2020-03
2020-02
2020-01
2019-12
2019-11
2019-10
2019-09
2019-08
2019-07
2019-06
2019-05
2019-04
2019-03
2019-02
2019-01
2018-12
2018-11
2018-10
pm25
33 (Moderate)
32 (Moderate)
35 (Unhealthy for Sensitive Groups)
36 (Unhealthy for Sensitive Groups)
65 (Unhealthy)
61 (Unhealthy)
43 (Unhealthy for Sensitive Groups)
46 (Unhealthy for Sensitive Groups)
33 (Moderate)
22 (Moderate)
26 (Moderate)
23 (Moderate)
29 (Moderate)
43 (Unhealthy for Sensitive Groups)
61 (Unhealthy)
70 (Unhealthy)
89 (Very Unhealthy)
60 (Unhealthy)
65 (Unhealthy)
43 (Unhealthy for Sensitive Groups)
co
543 (Good)
664 (Good)
674 (Good)
735 (Good)
916 (Good)
955 (Good)
650 (Good)
860 (Good)
772 (Good)
685 (Good)
625 (Good)
808 (Good)
749 (Good)
827 (Good)
852 (Good)
1 (Good)
1 (Good)
858 (Good)
1 (Good)
655 (Good)
no2
29 (Good)
44 (Moderate)
33 (Good)
18 (Good)
35 (Good)
57 (Moderate)
51 (Moderate)
49 (Moderate)
37 (Good)
24 (Good)
25 (Good)
28 (Good)
40 (Good)
39 (Good)
52 (Moderate)
35 (Good)
57 (Moderate)
47 (Moderate)
56 (Moderate)
56 (Moderate)
o3
147 (Unhealthy for Sensitive Groups)
132 (Unhealthy for Sensitive Groups)
104 (Moderate)
88 (Moderate)
57 (Good)
58 (Good)
99 (Moderate)
118 (Moderate)
160 (Unhealthy)
161 (Unhealthy)
152 (Unhealthy)
166 (Unhealthy)
154 (Unhealthy)
125 (Unhealthy for Sensitive Groups)
113 (Moderate)
81 (Moderate)
59 (Good)
55 (Good)
92 (Moderate)
108 (Moderate)
pm10
66 (Unhealthy for Sensitive Groups)
81 (Unhealthy)
63 (Unhealthy for Sensitive Groups)
43 (Moderate)
58 (Unhealthy for Sensitive Groups)
76 (Unhealthy for Sensitive Groups)
89 (Unhealthy)
90 (Unhealthy)
65 (Unhealthy for Sensitive Groups)
45 (Moderate)
51 (Unhealthy for Sensitive Groups)
55 (Unhealthy for Sensitive Groups)
77 (Unhealthy for Sensitive Groups)
78 (Unhealthy for Sensitive Groups)
100 (Unhealthy)
85 (Unhealthy)
106 (Unhealthy)
78 (Unhealthy for Sensitive Groups)
85 (Unhealthy)
81 (Unhealthy)
so2
3.7 (Good)
9.1 (Good)
7 (Good)
6 (Good)
6.3 (Good)
6.2 (Good)
7.6 (Good)
7.5 (Good)
6 (Good)
5.4 (Good)
5.3 (Good)
3.7 (Good)
4.6 (Good)
6.4 (Good)
8.7 (Good)
3.9 (Good)
6.7 (Good)
5.1 (Good)
6.3 (Good)
6.3 (Good)
data source »
Hefei Yao Hai Qu
Friday, May 27, 2022, 12:00 PM
PM10 6.7 (Good)
particulate matter (PM10) suspended dust
PM2,5 1.7 (Good)
particulate matter (PM2.5) dust
CO 100 (Good)
carbon monoxide (CO)
NO2 7.6 (Good)
nitrogen dioxide (NO2)
O3 0.02 (Good)
ozone (O3)
SO2 8.6 (Good)
sulfur dioxide (SO2)
Hefei Yao Hai Qu
index
2022-05-27
pm10
32
pm25
24
co
468
no2
21
o3
32
so2
4.6
瑶海区
2018-10 2020-05

index
2020-05
2020-04
2020-03
2020-02
2020-01
2019-12
2019-11
2019-10
2019-09
2019-08
2019-07
2019-06
2019-05
2019-04
2019-03
2019-02
2019-01
2018-12
2018-11
2018-10
pm25
33
32
35
36
65
61
43
46
33
22
26
23
29
43
61
70
89
60
65
43
co
543
664
674
735
916
955
650
860
772
685
625
808
749
827
852
1
1
858
1
655
no2
29
44
33
18
35
57
51
49
37
24
25
28
40
39
52
35
57
47
56
56
o3
147
132
104
88
57
58
99
118
160
161
152
166
154
125
113
81
59
55
92
108
pm10
66
81
63
43
58
76
89
90
65
45
51
55
77
78
100
85
106
78
85
81
so2
3.7
9.1
7
6
6.3
6.2
7.6
7.5
6
5.4
5.3
3.7
4.6
6.4
8.7
3.9
6.7
5.1
6.3
6.3
* Pollution data source:
https://openaq.org
(ChinaAQIData)
The data is licensed under CC-By 4.0
PM10 7 (Good)
PM2,5 2 (Good)
CO 100 (Good)
NO2 8 (Good)
O3 0 (Good)
SO2 9 (Good)
Data on air pollution from recent days in Caochongcun
| index | 2022-05-27 |
|---|---|
| pm10 | 32 Moderate |
| pm25 | 24 Moderate |
| co | 468 Good |
| no2 | 21 Good |
| o3 | 32 Good |
| so2 | 5 Good |
| index | 2020-05 | 2020-04 | 2020-03 | 2020-02 | 2020-01 | 2019-12 | 2019-11 | 2019-10 | 2019-09 | 2019-08 | 2019-07 | 2019-06 | 2019-05 | 2019-04 | 2019-03 | 2019-02 | 2019-01 | 2018-12 | 2018-11 | 2018-10 |
|---|---|---|---|---|---|---|---|---|---|---|---|---|---|---|---|---|---|---|---|---|
| pm25 | 33 (Moderate) | 32 (Moderate) | 35 (Unhealthy for Sensitive Groups) | 36 (Unhealthy for Sensitive Groups) | 65 (Unhealthy) | 61 (Unhealthy) | 43 (Unhealthy for Sensitive Groups) | 46 (Unhealthy for Sensitive Groups) | 33 (Moderate) | 22 (Moderate) | 26 (Moderate) | 23 (Moderate) | 29 (Moderate) | 43 (Unhealthy for Sensitive Groups) | 61 (Unhealthy) | 70 (Unhealthy) | 89 (Very Unhealthy) | 60 (Unhealthy) | 65 (Unhealthy) | 43 (Unhealthy for Sensitive Groups) |
| co | 543 (Good) | 664 (Good) | 674 (Good) | 735 (Good) | 916 (Good) | 955 (Good) | 650 (Good) | 860 (Good) | 772 (Good) | 685 (Good) | 625 (Good) | 808 (Good) | 749 (Good) | 827 (Good) | 852 (Good) | 1 (Good) | 1 (Good) | 858 (Good) | 1 (Good) | 655 (Good) |
| no2 | 29 (Good) | 44 (Moderate) | 33 (Good) | 18 (Good) | 35 (Good) | 57 (Moderate) | 51 (Moderate) | 49 (Moderate) | 37 (Good) | 24 (Good) | 25 (Good) | 28 (Good) | 40 (Good) | 39 (Good) | 52 (Moderate) | 35 (Good) | 57 (Moderate) | 47 (Moderate) | 56 (Moderate) | 56 (Moderate) |
| o3 | 147 (Unhealthy for Sensitive Groups) | 132 (Unhealthy for Sensitive Groups) | 104 (Moderate) | 88 (Moderate) | 57 (Good) | 58 (Good) | 99 (Moderate) | 118 (Moderate) | 160 (Unhealthy) | 161 (Unhealthy) | 152 (Unhealthy) | 166 (Unhealthy) | 154 (Unhealthy) | 125 (Unhealthy for Sensitive Groups) | 113 (Moderate) | 81 (Moderate) | 59 (Good) | 55 (Good) | 92 (Moderate) | 108 (Moderate) |
| pm10 | 66 (Unhealthy for Sensitive Groups) | 81 (Unhealthy) | 63 (Unhealthy for Sensitive Groups) | 43 (Moderate) | 58 (Unhealthy for Sensitive Groups) | 76 (Unhealthy for Sensitive Groups) | 89 (Unhealthy) | 90 (Unhealthy) | 65 (Unhealthy for Sensitive Groups) | 45 (Moderate) | 51 (Unhealthy for Sensitive Groups) | 55 (Unhealthy for Sensitive Groups) | 77 (Unhealthy for Sensitive Groups) | 78 (Unhealthy for Sensitive Groups) | 100 (Unhealthy) | 85 (Unhealthy) | 106 (Unhealthy) | 78 (Unhealthy for Sensitive Groups) | 85 (Unhealthy) | 81 (Unhealthy) |
| so2 | 3.7 (Good) | 9.1 (Good) | 7 (Good) | 6 (Good) | 6.3 (Good) | 6.2 (Good) | 7.6 (Good) | 7.5 (Good) | 6 (Good) | 5.4 (Good) | 5.3 (Good) | 3.7 (Good) | 4.6 (Good) | 6.4 (Good) | 8.7 (Good) | 3.9 (Good) | 6.7 (Good) | 5.1 (Good) | 6.3 (Good) | 6.3 (Good) |
PM10 6.7 (Good)
particulate matter (PM10) suspended dustPM2,5 1.7 (Good)
particulate matter (PM2.5) dustCO 100 (Good)
carbon monoxide (CO)NO2 7.6 (Good)
nitrogen dioxide (NO2)O3 0.02 (Good)
ozone (O3)SO2 8.6 (Good)
sulfur dioxide (SO2)Hefei Yao Hai Qu
| index | 2022-05-27 |
|---|---|
| pm10 | 32 |
| pm25 | 24 |
| co | 468 |
| no2 | 21 |
| o3 | 32 |
| so2 | 4.6 |
瑶海区

| index | 2020-05 | 2020-04 | 2020-03 | 2020-02 | 2020-01 | 2019-12 | 2019-11 | 2019-10 | 2019-09 | 2019-08 | 2019-07 | 2019-06 | 2019-05 | 2019-04 | 2019-03 | 2019-02 | 2019-01 | 2018-12 | 2018-11 | 2018-10 |
|---|---|---|---|---|---|---|---|---|---|---|---|---|---|---|---|---|---|---|---|---|
| pm25 | 33 | 32 | 35 | 36 | 65 | 61 | 43 | 46 | 33 | 22 | 26 | 23 | 29 | 43 | 61 | 70 | 89 | 60 | 65 | 43 |
| co | 543 | 664 | 674 | 735 | 916 | 955 | 650 | 860 | 772 | 685 | 625 | 808 | 749 | 827 | 852 | 1 | 1 | 858 | 1 | 655 |
| no2 | 29 | 44 | 33 | 18 | 35 | 57 | 51 | 49 | 37 | 24 | 25 | 28 | 40 | 39 | 52 | 35 | 57 | 47 | 56 | 56 |
| o3 | 147 | 132 | 104 | 88 | 57 | 58 | 99 | 118 | 160 | 161 | 152 | 166 | 154 | 125 | 113 | 81 | 59 | 55 | 92 | 108 |
| pm10 | 66 | 81 | 63 | 43 | 58 | 76 | 89 | 90 | 65 | 45 | 51 | 55 | 77 | 78 | 100 | 85 | 106 | 78 | 85 | 81 |
| so2 | 3.7 | 9.1 | 7 | 6 | 6.3 | 6.2 | 7.6 | 7.5 | 6 | 5.4 | 5.3 | 3.7 | 4.6 | 6.4 | 8.7 | 3.9 | 6.7 | 5.1 | 6.3 | 6.3 |