Air Pollution in Wuliduncun: Real-time Air Quality Index and smog alert.
Pollution and air quality forecast for Wuliduncun. Today is Tuesday, June 16, 2026. The following air pollution values have been recorded for Wuliduncun:- particulate matter (PM10) suspended dust - 7 (Good)
- particulate matter (PM2.5) dust - 2 (Good)
- carbon monoxide (CO) - 100 (Good)
- nitrogen dioxide (NO2) - 8 (Good)
- ozone (O3) - 0 (Good)
- sulfur dioxide (SO2) - 9 (Good)

What is the air quality in Wuliduncun today? Is the air polluted in Wuliduncun?. Is there smog?
What is the level of PM10 today in Wuliduncun? (particulate matter (PM10) suspended dust)
The current level of particulate matter PM10 in Wuliduncun is:
7 (Good)
The highest PM10 values usually occur in month: 135 (January 2019).
The lowest value of particulate matter PM10 pollution in Wuliduncun is usually recorded in: July (41).
What is the current level of PM2.5 in Wuliduncun? (particulate matter (PM2.5) dust)
Today's PM2.5 level is:
2 (Good)
For comparison, the highest level of PM2.5 in Wuliduncun in the last 7 days was: 24 (Friday, May 27, 2022) and the lowest: 24 (Friday, May 27, 2022).
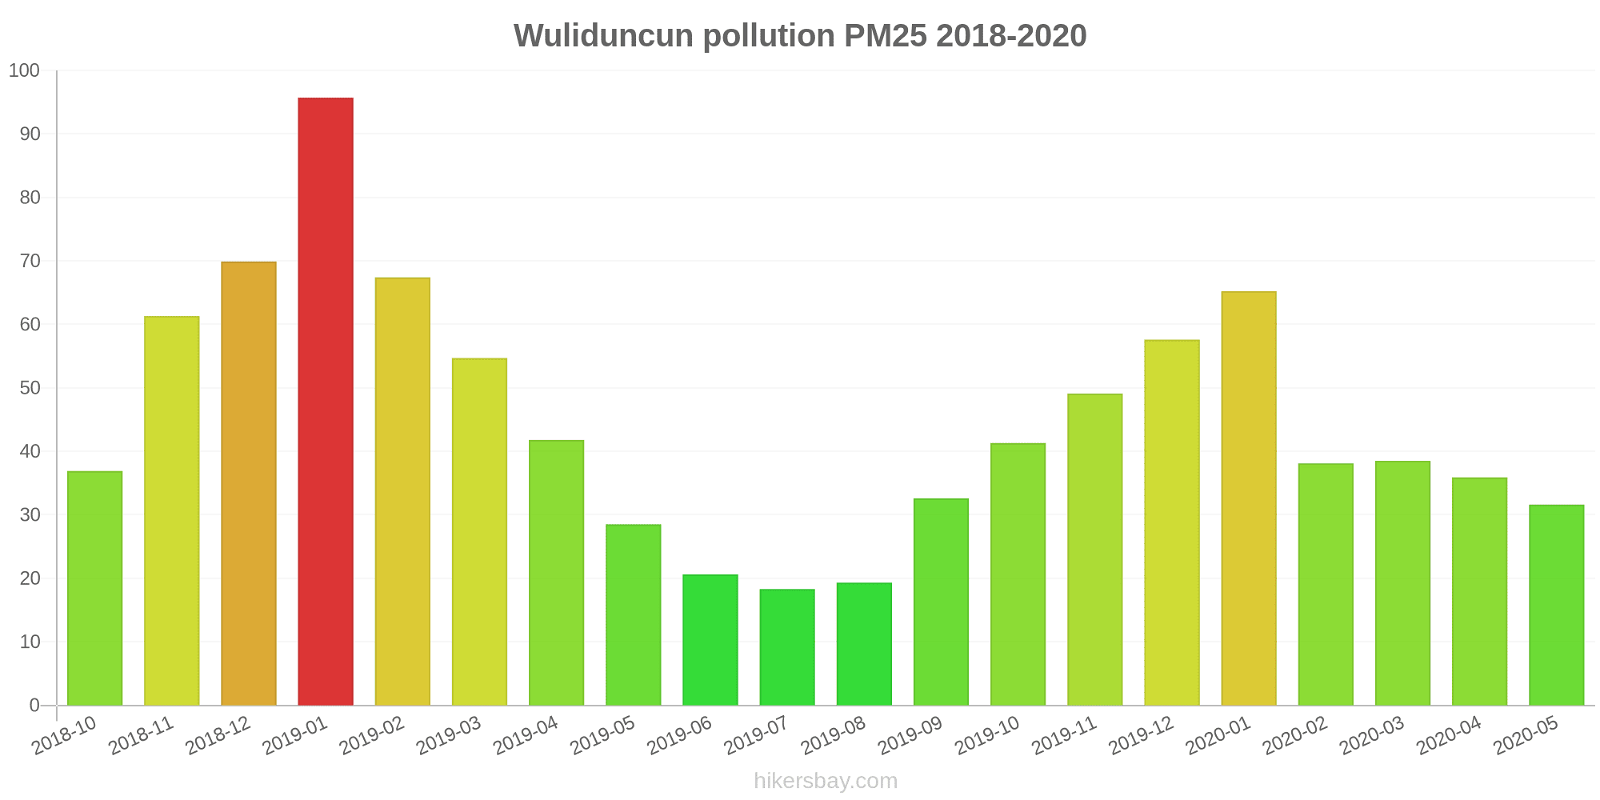
The highest PM2.5 values were recorded: 96 (January 2019).
The lowest level of particulate matter PM2.5 pollution occurs in month: July (18).
How high is the CO level? (carbon monoxide (CO))
100 (Good)
How high is the level of NO2? (nitrogen dioxide (NO2))
8 (Good)
How is the O3 level today in Wuliduncun? (ozone (O3))
0 (Good)
What is the level of SO2 pollution? (sulfur dioxide (SO2))
9 (Good)
Current data Friday, May 27, 2022, 12:00 PM
PM10 7 (Good)
PM2,5 2 (Good)
CO 100 (Good)
NO2 8 (Good)
O3 0 (Good)
SO2 9 (Good)
Data on air pollution from recent days in Wuliduncun
index
2022-05-27
pm10
32
Moderate
pm25
24
Moderate
co
468
Good
no2
21
Good
o3
32
Good
so2
5
Good
data source »
Air pollution in Wuliduncun from October 2018 to May 2020
index
2020-05
2020-04
2020-03
2020-02
2020-01
2019-12
2019-11
2019-10
2019-09
2019-08
2019-07
2019-06
2019-05
2019-04
2019-03
2019-02
2019-01
2018-12
2018-11
2018-10
pm25
32 (Moderate)
36 (Unhealthy for Sensitive Groups)
39 (Unhealthy for Sensitive Groups)
38 (Unhealthy for Sensitive Groups)
65 (Unhealthy)
58 (Unhealthy)
49 (Unhealthy for Sensitive Groups)
41 (Unhealthy for Sensitive Groups)
33 (Moderate)
19 (Moderate)
18 (Moderate)
21 (Moderate)
29 (Moderate)
42 (Unhealthy for Sensitive Groups)
55 (Unhealthy for Sensitive Groups)
67 (Unhealthy)
96 (Very Unhealthy)
70 (Unhealthy)
61 (Unhealthy)
37 (Unhealthy for Sensitive Groups)
co
652 (Good)
639 (Good)
691 (Good)
704 (Good)
970 (Good)
867 (Good)
734 (Good)
704 (Good)
736 (Good)
637 (Good)
632 (Good)
734 (Good)
600 (Good)
576 (Good)
754 (Good)
798 (Good)
882 (Good)
827 (Good)
808 (Good)
596 (Good)
no2
25 (Good)
32 (Good)
28 (Good)
17 (Good)
31 (Good)
45 (Moderate)
44 (Moderate)
37 (Good)
30 (Good)
19 (Good)
17 (Good)
19 (Good)
30 (Good)
32 (Good)
42 (Moderate)
28 (Good)
50 (Moderate)
47 (Moderate)
46 (Moderate)
39 (Good)
o3
153 (Unhealthy)
150 (Unhealthy)
114 (Moderate)
100 (Moderate)
75 (Moderate)
82 (Moderate)
113 (Moderate)
132 (Unhealthy for Sensitive Groups)
173 (Unhealthy)
160 (Unhealthy)
143 (Unhealthy for Sensitive Groups)
170 (Unhealthy)
155 (Unhealthy)
133 (Unhealthy for Sensitive Groups)
116 (Moderate)
105 (Moderate)
92 (Moderate)
65 (Good)
99 (Moderate)
113 (Moderate)
pm10
55 (Unhealthy for Sensitive Groups)
71 (Unhealthy for Sensitive Groups)
70 (Unhealthy for Sensitive Groups)
51 (Unhealthy for Sensitive Groups)
81 (Unhealthy)
87 (Unhealthy)
94 (Unhealthy)
81 (Unhealthy)
66 (Unhealthy for Sensitive Groups)
43 (Moderate)
41 (Moderate)
46 (Moderate)
70 (Unhealthy for Sensitive Groups)
75 (Unhealthy for Sensitive Groups)
99 (Unhealthy)
90 (Unhealthy)
135 (Very Unhealthy)
110 (Very Unhealthy)
103 (Unhealthy)
76 (Unhealthy for Sensitive Groups)
so2
5 (Good)
5.8 (Good)
4.8 (Good)
4.1 (Good)
3.3 (Good)
6.5 (Good)
7.1 (Good)
7.7 (Good)
5.1 (Good)
6 (Good)
3.4 (Good)
7.4 (Good)
9.9 (Good)
11 (Good)
9.6 (Good)
5 (Good)
7 (Good)
8.2 (Good)
5.3 (Good)
6.4 (Good)
data source »
朝阳厂
Friday, May 27, 2022, 12:00 PM
PM10 6.7 (Good)
particulate matter (PM10) suspended dust
PM2,5 1.7 (Good)
particulate matter (PM2.5) dust
CO 100 (Good)
carbon monoxide (CO)
NO2 7.6 (Good)
nitrogen dioxide (NO2)
O3 0.02 (Good)
ozone (O3)
SO2 8.6 (Good)
sulfur dioxide (SO2)
朝阳厂
index
2022-05-27
pm10
32
pm25
24
co
468
no2
21
o3
32
so2
4.6
朝阳厂
2018-10 2020-05
index
2020-05
2020-04
2020-03
2020-02
2020-01
2019-12
2019-11
2019-10
2019-09
2019-08
2019-07
2019-06
2019-05
2019-04
2019-03
2019-02
2019-01
2018-12
2018-11
2018-10
pm25
32
36
39
38
65
58
49
41
33
19
18
21
29
42
55
67
96
70
61
37
co
652
639
691
704
970
867
734
704
736
637
632
734
600
576
754
798
882
827
808
596
no2
25
32
28
17
31
45
44
37
30
19
17
19
30
32
42
28
50
47
46
39
o3
153
150
114
100
75
82
113
132
173
160
143
170
155
133
116
105
92
65
99
113
pm10
55
71
70
51
81
87
94
81
66
43
41
46
70
75
99
90
135
110
103
76
so2
5
5.8
4.8
4.1
3.3
6.5
7.1
7.7
5.1
6
3.4
7.4
9.9
11
9.6
5
7
8.2
5.3
6.4
* Pollution data source:
https://openaq.org
(ChinaAQIData)
The data is licensed under CC-By 4.0
PM10 7 (Good)
PM2,5 2 (Good)
CO 100 (Good)
NO2 8 (Good)
O3 0 (Good)
SO2 9 (Good)
Data on air pollution from recent days in Wuliduncun
| index | 2022-05-27 |
|---|---|
| pm10 | 32 Moderate |
| pm25 | 24 Moderate |
| co | 468 Good |
| no2 | 21 Good |
| o3 | 32 Good |
| so2 | 5 Good |

| index | 2020-05 | 2020-04 | 2020-03 | 2020-02 | 2020-01 | 2019-12 | 2019-11 | 2019-10 | 2019-09 | 2019-08 | 2019-07 | 2019-06 | 2019-05 | 2019-04 | 2019-03 | 2019-02 | 2019-01 | 2018-12 | 2018-11 | 2018-10 |
|---|---|---|---|---|---|---|---|---|---|---|---|---|---|---|---|---|---|---|---|---|
| pm25 | 32 (Moderate) | 36 (Unhealthy for Sensitive Groups) | 39 (Unhealthy for Sensitive Groups) | 38 (Unhealthy for Sensitive Groups) | 65 (Unhealthy) | 58 (Unhealthy) | 49 (Unhealthy for Sensitive Groups) | 41 (Unhealthy for Sensitive Groups) | 33 (Moderate) | 19 (Moderate) | 18 (Moderate) | 21 (Moderate) | 29 (Moderate) | 42 (Unhealthy for Sensitive Groups) | 55 (Unhealthy for Sensitive Groups) | 67 (Unhealthy) | 96 (Very Unhealthy) | 70 (Unhealthy) | 61 (Unhealthy) | 37 (Unhealthy for Sensitive Groups) |
| co | 652 (Good) | 639 (Good) | 691 (Good) | 704 (Good) | 970 (Good) | 867 (Good) | 734 (Good) | 704 (Good) | 736 (Good) | 637 (Good) | 632 (Good) | 734 (Good) | 600 (Good) | 576 (Good) | 754 (Good) | 798 (Good) | 882 (Good) | 827 (Good) | 808 (Good) | 596 (Good) |
| no2 | 25 (Good) | 32 (Good) | 28 (Good) | 17 (Good) | 31 (Good) | 45 (Moderate) | 44 (Moderate) | 37 (Good) | 30 (Good) | 19 (Good) | 17 (Good) | 19 (Good) | 30 (Good) | 32 (Good) | 42 (Moderate) | 28 (Good) | 50 (Moderate) | 47 (Moderate) | 46 (Moderate) | 39 (Good) |
| o3 | 153 (Unhealthy) | 150 (Unhealthy) | 114 (Moderate) | 100 (Moderate) | 75 (Moderate) | 82 (Moderate) | 113 (Moderate) | 132 (Unhealthy for Sensitive Groups) | 173 (Unhealthy) | 160 (Unhealthy) | 143 (Unhealthy for Sensitive Groups) | 170 (Unhealthy) | 155 (Unhealthy) | 133 (Unhealthy for Sensitive Groups) | 116 (Moderate) | 105 (Moderate) | 92 (Moderate) | 65 (Good) | 99 (Moderate) | 113 (Moderate) |
| pm10 | 55 (Unhealthy for Sensitive Groups) | 71 (Unhealthy for Sensitive Groups) | 70 (Unhealthy for Sensitive Groups) | 51 (Unhealthy for Sensitive Groups) | 81 (Unhealthy) | 87 (Unhealthy) | 94 (Unhealthy) | 81 (Unhealthy) | 66 (Unhealthy for Sensitive Groups) | 43 (Moderate) | 41 (Moderate) | 46 (Moderate) | 70 (Unhealthy for Sensitive Groups) | 75 (Unhealthy for Sensitive Groups) | 99 (Unhealthy) | 90 (Unhealthy) | 135 (Very Unhealthy) | 110 (Very Unhealthy) | 103 (Unhealthy) | 76 (Unhealthy for Sensitive Groups) |
| so2 | 5 (Good) | 5.8 (Good) | 4.8 (Good) | 4.1 (Good) | 3.3 (Good) | 6.5 (Good) | 7.1 (Good) | 7.7 (Good) | 5.1 (Good) | 6 (Good) | 3.4 (Good) | 7.4 (Good) | 9.9 (Good) | 11 (Good) | 9.6 (Good) | 5 (Good) | 7 (Good) | 8.2 (Good) | 5.3 (Good) | 6.4 (Good) |
PM10 6.7 (Good)
particulate matter (PM10) suspended dustPM2,5 1.7 (Good)
particulate matter (PM2.5) dustCO 100 (Good)
carbon monoxide (CO)NO2 7.6 (Good)
nitrogen dioxide (NO2)O3 0.02 (Good)
ozone (O3)SO2 8.6 (Good)
sulfur dioxide (SO2)朝阳厂
| index | 2022-05-27 |
|---|---|
| pm10 | 32 |
| pm25 | 24 |
| co | 468 |
| no2 | 21 |
| o3 | 32 |
| so2 | 4.6 |
朝阳厂

| index | 2020-05 | 2020-04 | 2020-03 | 2020-02 | 2020-01 | 2019-12 | 2019-11 | 2019-10 | 2019-09 | 2019-08 | 2019-07 | 2019-06 | 2019-05 | 2019-04 | 2019-03 | 2019-02 | 2019-01 | 2018-12 | 2018-11 | 2018-10 |
|---|---|---|---|---|---|---|---|---|---|---|---|---|---|---|---|---|---|---|---|---|
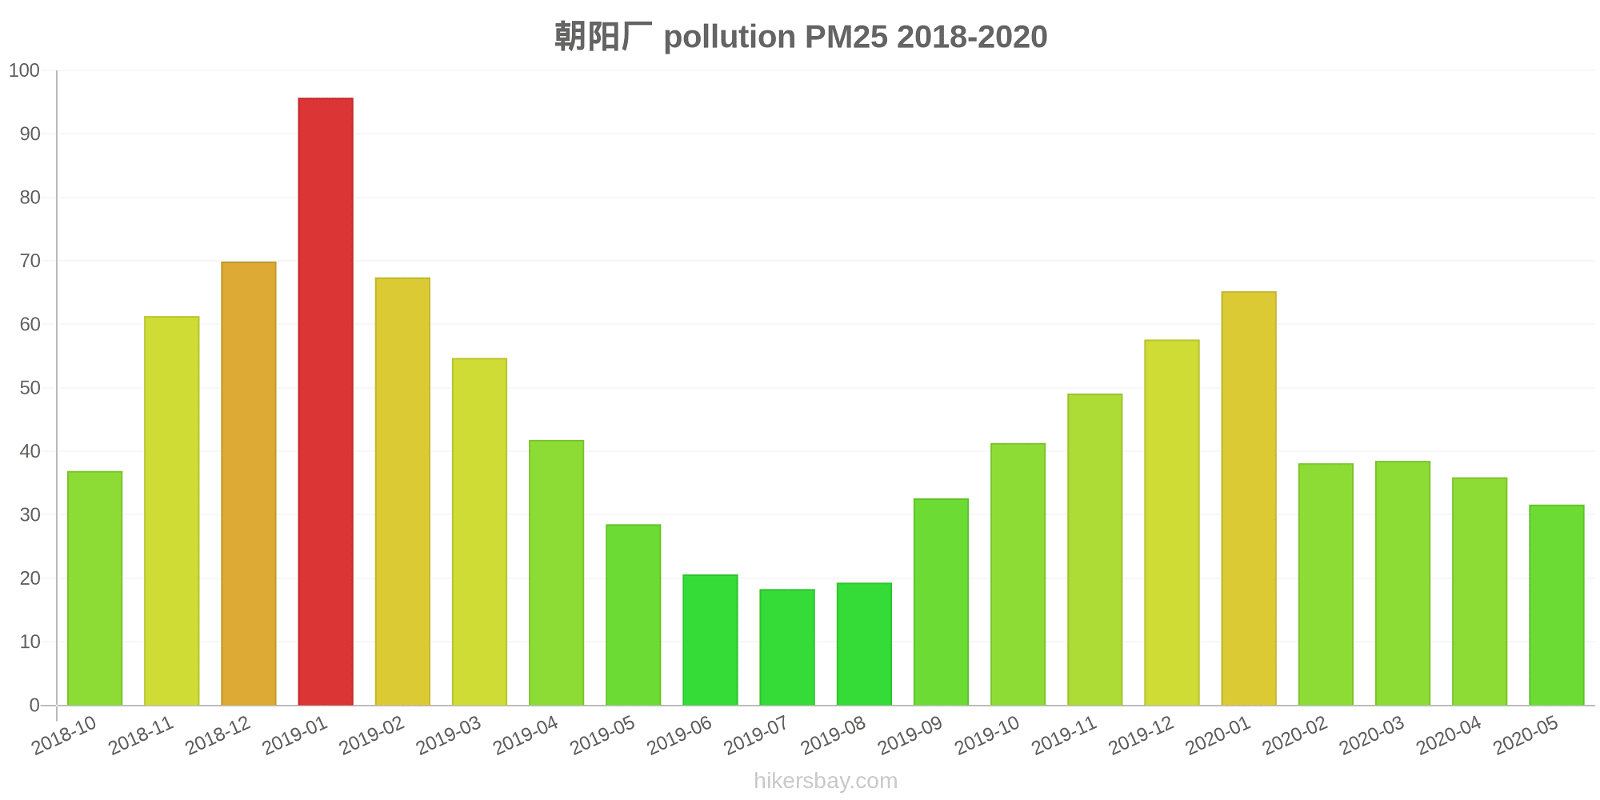
| pm25 | 32 | 36 | 39 | 38 | 65 | 58 | 49 | 41 | 33 | 19 | 18 | 21 | 29 | 42 | 55 | 67 | 96 | 70 | 61 | 37 |
| co | 652 | 639 | 691 | 704 | 970 | 867 | 734 | 704 | 736 | 637 | 632 | 734 | 600 | 576 | 754 | 798 | 882 | 827 | 808 | 596 |
| no2 | 25 | 32 | 28 | 17 | 31 | 45 | 44 | 37 | 30 | 19 | 17 | 19 | 30 | 32 | 42 | 28 | 50 | 47 | 46 | 39 |
| o3 | 153 | 150 | 114 | 100 | 75 | 82 | 113 | 132 | 173 | 160 | 143 | 170 | 155 | 133 | 116 | 105 | 92 | 65 | 99 | 113 |
| pm10 | 55 | 71 | 70 | 51 | 81 | 87 | 94 | 81 | 66 | 43 | 41 | 46 | 70 | 75 | 99 | 90 | 135 | 110 | 103 | 76 |
| so2 | 5 | 5.8 | 4.8 | 4.1 | 3.3 | 6.5 | 7.1 | 7.7 | 5.1 | 6 | 3.4 | 7.4 | 9.9 | 11 | 9.6 | 5 | 7 | 8.2 | 5.3 | 6.4 |