Air Pollution in Jinzhuang: Real-time Air Quality Index and smog alert.
Pollution and air quality forecast for Jinzhuang. Today is Tuesday, June 2, 2026. The following air pollution values have been recorded for Jinzhuang:- particulate matter (PM10) suspended dust - 7 (Good)
- particulate matter (PM2.5) dust - 2 (Good)
- carbon monoxide (CO) - 100 (Good)
- nitrogen dioxide (NO2) - 8 (Good)
- ozone (O3) - 0 (Good)
- sulfur dioxide (SO2) - 9 (Good)

What is the air quality in Jinzhuang today? Is the air polluted in Jinzhuang?. Is there smog?
What is the level of PM10 today in Jinzhuang? (particulate matter (PM10) suspended dust)
The current level of particulate matter PM10 in Jinzhuang is:
7 (Good)
The highest PM10 values usually occur in month: 121 (December 2018).
The lowest value of particulate matter PM10 pollution in Jinzhuang is usually recorded in: July (27).
What is the current level of PM2.5 in Jinzhuang? (particulate matter (PM2.5) dust)
Today's PM2.5 level is:
2 (Good)
For comparison, the highest level of PM2.5 in Jinzhuang in the last 7 days was: 24 (Friday, May 27, 2022) and the lowest: 24 (Friday, May 27, 2022).
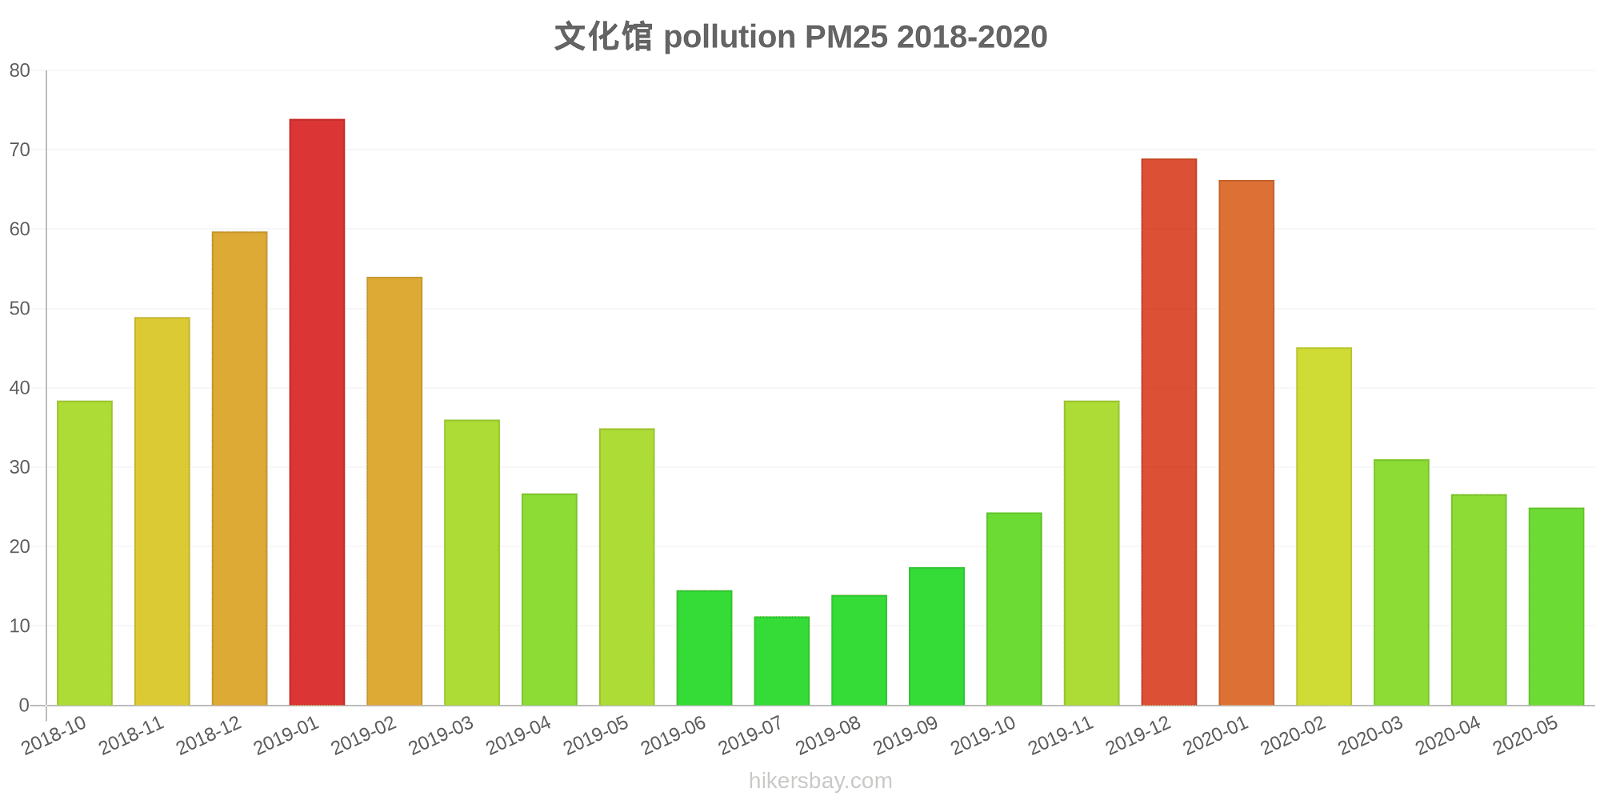
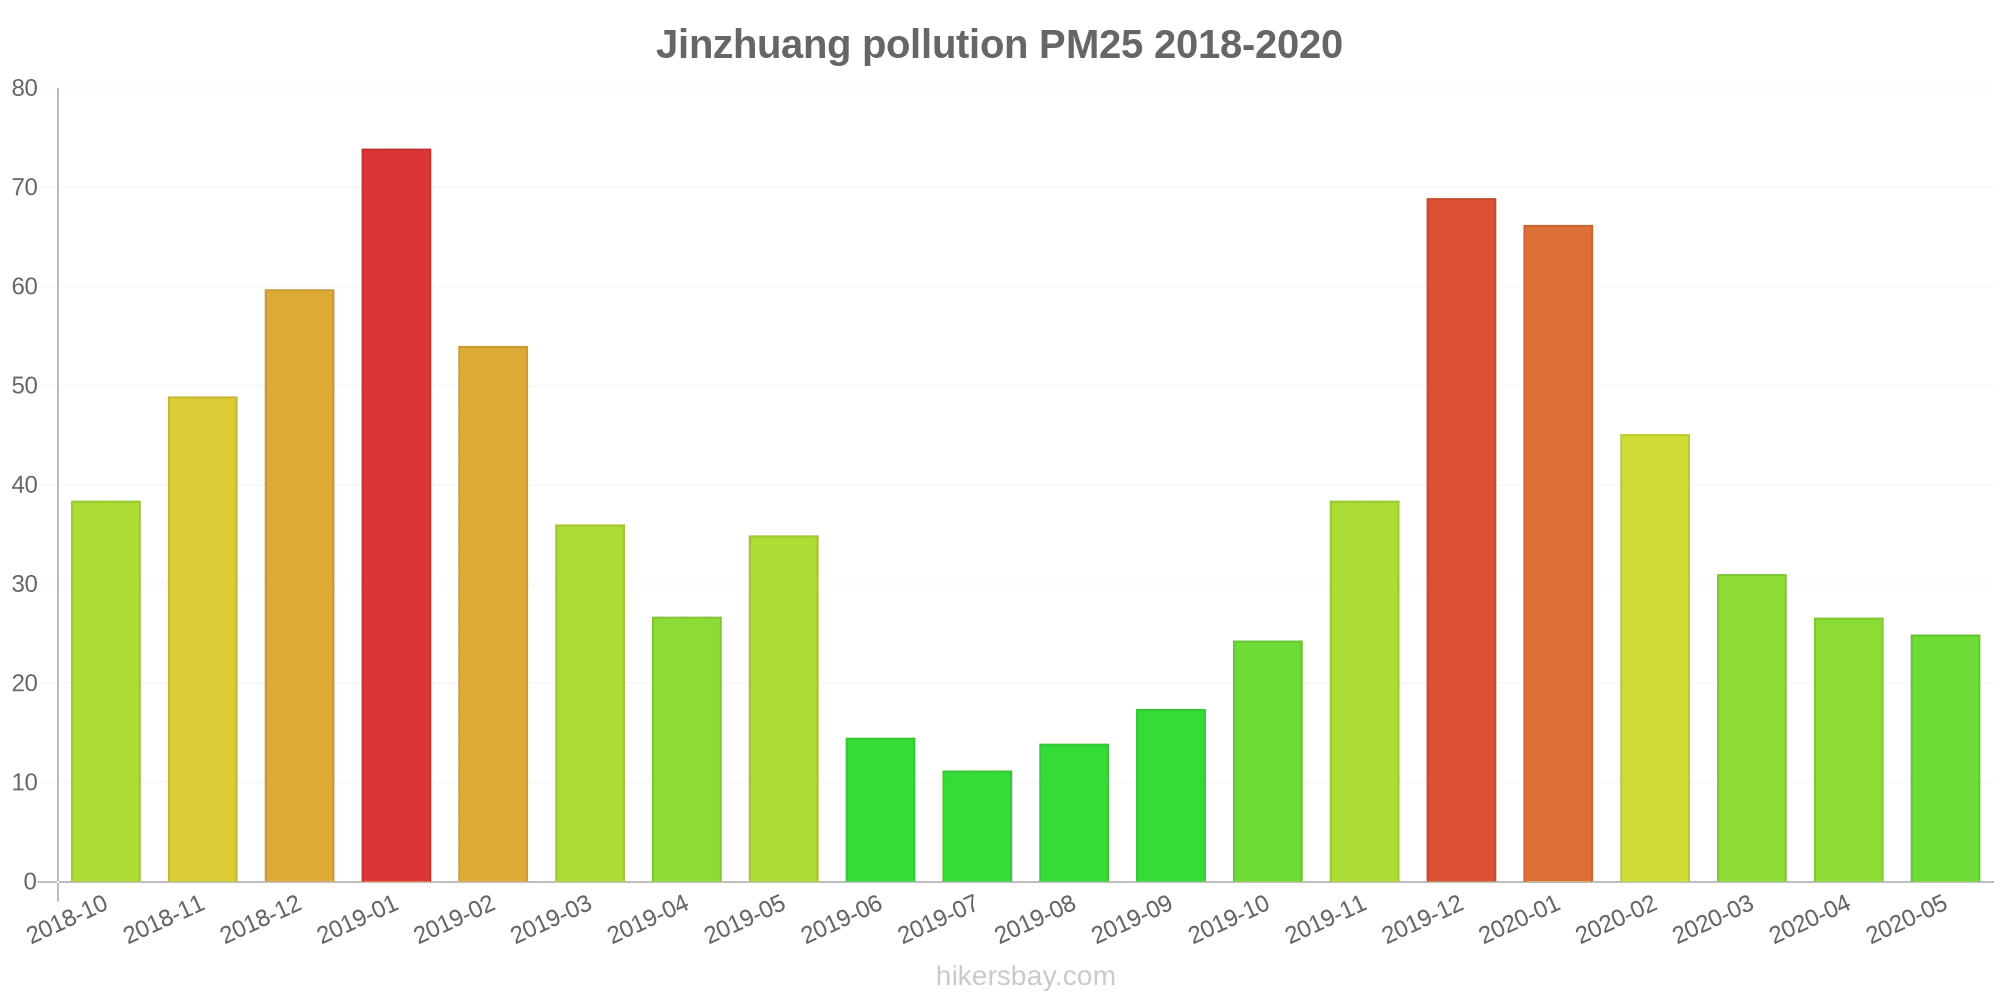
The highest PM2.5 values were recorded: 74 (January 2019).
The lowest level of particulate matter PM2.5 pollution occurs in month: July (11).
How high is the CO level? (carbon monoxide (CO))
100 (Good)
How high is the level of NO2? (nitrogen dioxide (NO2))
8 (Good)
How is the O3 level today in Jinzhuang? (ozone (O3))
0 (Good)
What is the level of SO2 pollution? (sulfur dioxide (SO2))
9 (Good)
Current data Friday, May 27, 2022, 12:00 PM
PM10 7 (Good)
PM2,5 2 (Good)
CO 100 (Good)
NO2 8 (Good)
O3 0 (Good)
SO2 9 (Good)
Data on air pollution from recent days in Jinzhuang
index
2022-05-27
pm10
32
Moderate
pm25
24
Moderate
co
468
Good
no2
21
Good
o3
32
Good
so2
5
Good
data source »
Air pollution in Jinzhuang from October 2018 to May 2020

index
2020-05
2020-04
2020-03
2020-02
2020-01
2019-12
2019-11
2019-10
2019-09
2019-08
2019-07
2019-06
2019-05
2019-04
2019-03
2019-02
2019-01
2018-12
2018-11
2018-10
pm25
25 (Moderate)
27 (Moderate)
31 (Moderate)
45 (Unhealthy for Sensitive Groups)
66 (Unhealthy)
69 (Unhealthy)
38 (Unhealthy for Sensitive Groups)
24 (Moderate)
17 (Moderate)
14 (Moderate)
11 (Good)
15 (Moderate)
35 (Moderate)
27 (Moderate)
36 (Unhealthy for Sensitive Groups)
54 (Unhealthy for Sensitive Groups)
74 (Unhealthy)
60 (Unhealthy)
49 (Unhealthy for Sensitive Groups)
38 (Unhealthy for Sensitive Groups)
co
406 (Good)
352 (Good)
525 (Good)
1 (Good)
1 (Good)
1 (Good)
922 (Good)
678 (Good)
510 (Good)
500 (Good)
439 (Good)
497 (Good)
462 (Good)
543 (Good)
727 (Good)
1 (Good)
1 (Good)
965 (Good)
917 (Good)
615 (Good)
no2
24 (Good)
34 (Good)
30 (Good)
20 (Good)
40 (Good)
52 (Moderate)
38 (Good)
28 (Good)
25 (Good)
21 (Good)
19 (Good)
20 (Good)
21 (Good)
24 (Good)
30 (Good)
30 (Good)
46 (Moderate)
46 (Moderate)
41 (Moderate)
39 (Good)
o3
137 (Unhealthy for Sensitive Groups)
120 (Unhealthy for Sensitive Groups)
98 (Moderate)
92 (Moderate)
76 (Moderate)
57 (Good)
59 (Good)
74 (Moderate)
102 (Moderate)
120 (Unhealthy for Sensitive Groups)
137 (Unhealthy for Sensitive Groups)
118 (Moderate)
123 (Unhealthy for Sensitive Groups)
125 (Unhealthy for Sensitive Groups)
108 (Moderate)
84 (Moderate)
70 (Moderate)
48 (Good)
73 (Moderate)
101 (Moderate)
pm10
69 (Unhealthy for Sensitive Groups)
66 (Unhealthy for Sensitive Groups)
82 (Unhealthy)
70 (Unhealthy for Sensitive Groups)
86 (Unhealthy)
106 (Unhealthy)
71 (Unhealthy for Sensitive Groups)
47 (Moderate)
33 (Moderate)
29 (Moderate)
27 (Moderate)
31 (Moderate)
92 (Unhealthy)
68 (Unhealthy for Sensitive Groups)
82 (Unhealthy)
85 (Unhealthy)
110 (Very Unhealthy)
121 (Very Unhealthy)
105 (Unhealthy)
94 (Unhealthy)
so2
7.5 (Good)
8.2 (Good)
16 (Good)
15 (Good)
20 (Good)
17 (Good)
13 (Good)
8 (Good)
8.1 (Good)
7.2 (Good)
7 (Good)
6.1 (Good)
5.1 (Good)
7 (Good)
12 (Good)
18 (Good)
17 (Good)
22 (Good)
19 (Good)
12 (Good)
data source »
文化馆
Friday, May 27, 2022, 12:00 PM
PM10 6.7 (Good)
particulate matter (PM10) suspended dust
PM2,5 1.7 (Good)
particulate matter (PM2.5) dust
CO 100 (Good)
carbon monoxide (CO)
NO2 7.6 (Good)
nitrogen dioxide (NO2)
O3 0.02 (Good)
ozone (O3)
SO2 8.6 (Good)
sulfur dioxide (SO2)
文化馆
index
2022-05-27
pm10
32
pm25
24
co
468
no2
21
o3
32
so2
4.6
文化馆
2018-10 2020-05
index
2020-05
2020-04
2020-03
2020-02
2020-01
2019-12
2019-11
2019-10
2019-09
2019-08
2019-07
2019-06
2019-05
2019-04
2019-03
2019-02
2019-01
2018-12
2018-11
2018-10
pm25
25
27
31
45
66
69
38
24
17
14
11
15
35
27
36
54
74
60
49
38
co
406
352
525
1
1
1
922
678
510
500
439
497
462
543
727
1
1
965
917
615
no2
24
34
30
20
40
52
38
28
25
21
19
20
21
24
30
30
46
46
41
39
o3
137
120
98
92
76
57
59
74
102
120
137
118
123
125
108
84
70
48
73
101
pm10
69
66
82
70
86
106
71
47
33
29
27
31
92
68
82
85
110
121
105
94
so2
7.5
8.2
16
15
20
17
13
8
8.1
7.2
7
6.1
5.1
7
12
18
17
22
19
12
* Pollution data source:
https://openaq.org
(ChinaAQIData)
The data is licensed under CC-By 4.0
PM10 7 (Good)
PM2,5 2 (Good)
CO 100 (Good)
NO2 8 (Good)
O3 0 (Good)
SO2 9 (Good)
Data on air pollution from recent days in Jinzhuang
| index | 2022-05-27 |
|---|---|
| pm10 | 32 Moderate |
| pm25 | 24 Moderate |
| co | 468 Good |
| no2 | 21 Good |
| o3 | 32 Good |
| so2 | 5 Good |
| index | 2020-05 | 2020-04 | 2020-03 | 2020-02 | 2020-01 | 2019-12 | 2019-11 | 2019-10 | 2019-09 | 2019-08 | 2019-07 | 2019-06 | 2019-05 | 2019-04 | 2019-03 | 2019-02 | 2019-01 | 2018-12 | 2018-11 | 2018-10 |
|---|---|---|---|---|---|---|---|---|---|---|---|---|---|---|---|---|---|---|---|---|
| pm25 | 25 (Moderate) | 27 (Moderate) | 31 (Moderate) | 45 (Unhealthy for Sensitive Groups) | 66 (Unhealthy) | 69 (Unhealthy) | 38 (Unhealthy for Sensitive Groups) | 24 (Moderate) | 17 (Moderate) | 14 (Moderate) | 11 (Good) | 15 (Moderate) | 35 (Moderate) | 27 (Moderate) | 36 (Unhealthy for Sensitive Groups) | 54 (Unhealthy for Sensitive Groups) | 74 (Unhealthy) | 60 (Unhealthy) | 49 (Unhealthy for Sensitive Groups) | 38 (Unhealthy for Sensitive Groups) |
| co | 406 (Good) | 352 (Good) | 525 (Good) | 1 (Good) | 1 (Good) | 1 (Good) | 922 (Good) | 678 (Good) | 510 (Good) | 500 (Good) | 439 (Good) | 497 (Good) | 462 (Good) | 543 (Good) | 727 (Good) | 1 (Good) | 1 (Good) | 965 (Good) | 917 (Good) | 615 (Good) |
| no2 | 24 (Good) | 34 (Good) | 30 (Good) | 20 (Good) | 40 (Good) | 52 (Moderate) | 38 (Good) | 28 (Good) | 25 (Good) | 21 (Good) | 19 (Good) | 20 (Good) | 21 (Good) | 24 (Good) | 30 (Good) | 30 (Good) | 46 (Moderate) | 46 (Moderate) | 41 (Moderate) | 39 (Good) |
| o3 | 137 (Unhealthy for Sensitive Groups) | 120 (Unhealthy for Sensitive Groups) | 98 (Moderate) | 92 (Moderate) | 76 (Moderate) | 57 (Good) | 59 (Good) | 74 (Moderate) | 102 (Moderate) | 120 (Unhealthy for Sensitive Groups) | 137 (Unhealthy for Sensitive Groups) | 118 (Moderate) | 123 (Unhealthy for Sensitive Groups) | 125 (Unhealthy for Sensitive Groups) | 108 (Moderate) | 84 (Moderate) | 70 (Moderate) | 48 (Good) | 73 (Moderate) | 101 (Moderate) |
| pm10 | 69 (Unhealthy for Sensitive Groups) | 66 (Unhealthy for Sensitive Groups) | 82 (Unhealthy) | 70 (Unhealthy for Sensitive Groups) | 86 (Unhealthy) | 106 (Unhealthy) | 71 (Unhealthy for Sensitive Groups) | 47 (Moderate) | 33 (Moderate) | 29 (Moderate) | 27 (Moderate) | 31 (Moderate) | 92 (Unhealthy) | 68 (Unhealthy for Sensitive Groups) | 82 (Unhealthy) | 85 (Unhealthy) | 110 (Very Unhealthy) | 121 (Very Unhealthy) | 105 (Unhealthy) | 94 (Unhealthy) |
| so2 | 7.5 (Good) | 8.2 (Good) | 16 (Good) | 15 (Good) | 20 (Good) | 17 (Good) | 13 (Good) | 8 (Good) | 8.1 (Good) | 7.2 (Good) | 7 (Good) | 6.1 (Good) | 5.1 (Good) | 7 (Good) | 12 (Good) | 18 (Good) | 17 (Good) | 22 (Good) | 19 (Good) | 12 (Good) |
PM10 6.7 (Good)
particulate matter (PM10) suspended dustPM2,5 1.7 (Good)
particulate matter (PM2.5) dustCO 100 (Good)
carbon monoxide (CO)NO2 7.6 (Good)
nitrogen dioxide (NO2)O3 0.02 (Good)
ozone (O3)SO2 8.6 (Good)
sulfur dioxide (SO2)文化馆
| index | 2022-05-27 |
|---|---|
| pm10 | 32 |
| pm25 | 24 |
| co | 468 |
| no2 | 21 |
| o3 | 32 |
| so2 | 4.6 |
文化馆

| index | 2020-05 | 2020-04 | 2020-03 | 2020-02 | 2020-01 | 2019-12 | 2019-11 | 2019-10 | 2019-09 | 2019-08 | 2019-07 | 2019-06 | 2019-05 | 2019-04 | 2019-03 | 2019-02 | 2019-01 | 2018-12 | 2018-11 | 2018-10 |
|---|---|---|---|---|---|---|---|---|---|---|---|---|---|---|---|---|---|---|---|---|
| pm25 | 25 | 27 | 31 | 45 | 66 | 69 | 38 | 24 | 17 | 14 | 11 | 15 | 35 | 27 | 36 | 54 | 74 | 60 | 49 | 38 |
| co | 406 | 352 | 525 | 1 | 1 | 1 | 922 | 678 | 510 | 500 | 439 | 497 | 462 | 543 | 727 | 1 | 1 | 965 | 917 | 615 |
| no2 | 24 | 34 | 30 | 20 | 40 | 52 | 38 | 28 | 25 | 21 | 19 | 20 | 21 | 24 | 30 | 30 | 46 | 46 | 41 | 39 |
| o3 | 137 | 120 | 98 | 92 | 76 | 57 | 59 | 74 | 102 | 120 | 137 | 118 | 123 | 125 | 108 | 84 | 70 | 48 | 73 | 101 |
| pm10 | 69 | 66 | 82 | 70 | 86 | 106 | 71 | 47 | 33 | 29 | 27 | 31 | 92 | 68 | 82 | 85 | 110 | 121 | 105 | 94 |
| so2 | 7.5 | 8.2 | 16 | 15 | 20 | 17 | 13 | 8 | 8.1 | 7.2 | 7 | 6.1 | 5.1 | 7 | 12 | 18 | 17 | 22 | 19 | 12 |