Air Pollution in Pingxicun: Real-time Air Quality Index and smog alert.
Pollution and air quality forecast for Pingxicun. Today is Tuesday, June 2, 2026. The following air pollution values have been recorded for Pingxicun:- particulate matter (PM10) suspended dust - 179 (Very bad Hazardous)
- particulate matter (PM2.5) dust - 35 (Unhealthy for Sensitive Groups)
- ozone (O3) - 0 (Good)
- nitrogen dioxide (NO2) - 0 (Good)
- sulfur dioxide (SO2) - 0 (Good)

What is the air quality in Pingxicun today? Is the air polluted in Pingxicun?. Is there smog?
What is the level of PM10 today in Pingxicun? (particulate matter (PM10) suspended dust)
The current level of particulate matter PM10 in Pingxicun is:
179 (Very bad Hazardous)
The highest PM10 values usually occur in month: 158 (December 2018).
The lowest value of particulate matter PM10 pollution in Pingxicun is usually recorded in: July (40).
What is the current level of PM2.5 in Pingxicun? (particulate matter (PM2.5) dust)
Today's PM2.5 level is:
35 (Unhealthy for Sensitive Groups)
For comparison, the highest level of PM2.5 in Pingxicun in the last 7 days was: 56 (Friday, May 27, 2022) and the lowest: 56 (Friday, May 27, 2022).
The highest PM2.5 values were recorded: 118 (January 2019).
The lowest level of particulate matter PM2.5 pollution occurs in month: July (23).
How is the O3 level today in Pingxicun? (ozone (O3))
0 (Good)
How high is the level of NO2? (nitrogen dioxide (NO2))
0 (Good)
What is the level of SO2 pollution? (sulfur dioxide (SO2))
0 (Good)
Current data Friday, May 27, 2022, 12:00 PM
PM10 179 (Very bad Hazardous)
PM2,5 35 (Unhealthy for Sensitive Groups)
O3 0 (Good)
NO2 0 (Good)
SO2 0 (Good)
Data on air pollution from recent days in Pingxicun
index
2022-05-27
pm10
56
Unhealthy for Sensitive Groups
pm25
56
Unhealthy
o3
0
Good
no2
0
Good
so2
0
Good
data source »
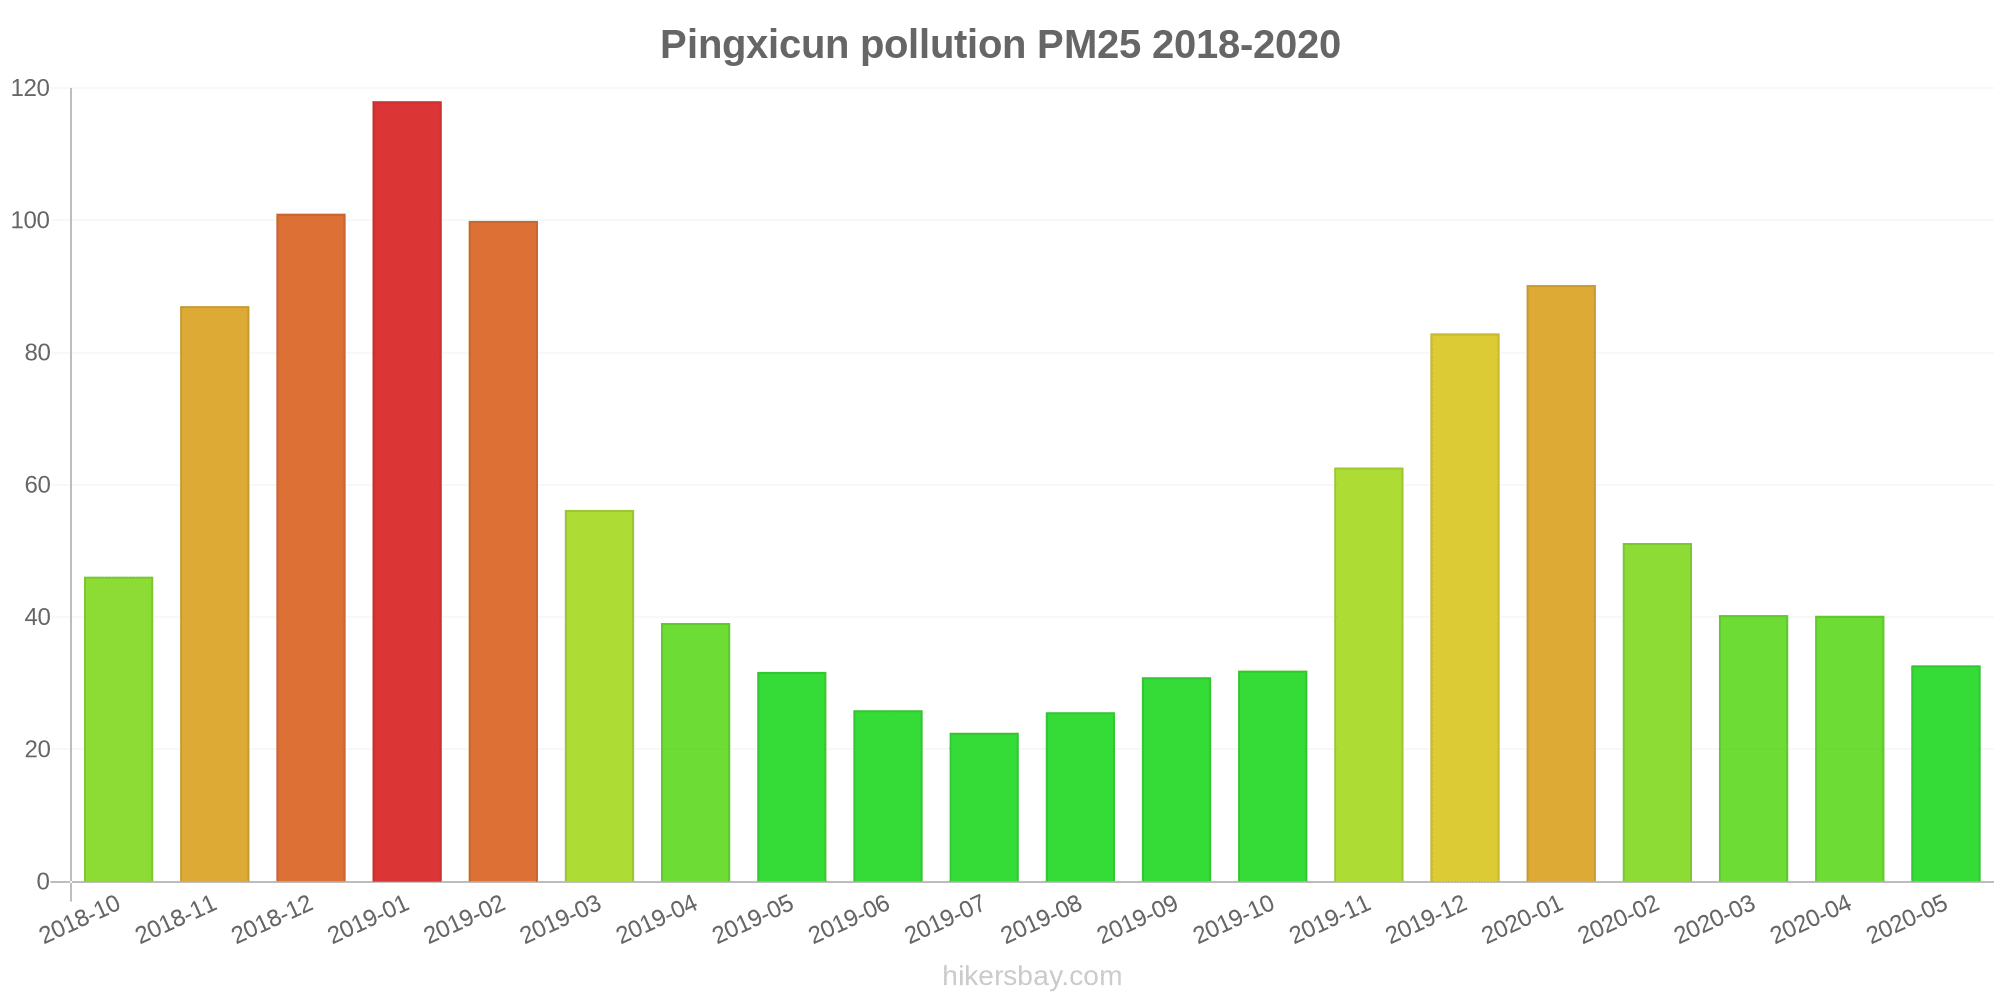
Air pollution in Pingxicun from October 2018 to May 2020

index
2020-05
2020-04
2020-03
2020-02
2020-01
2019-12
2019-11
2019-10
2019-09
2019-08
2019-07
2019-06
2019-05
2019-04
2019-03
2019-02
2019-01
2018-12
2018-11
2018-10
pm25
33 (Moderate)
40 (Unhealthy for Sensitive Groups)
40 (Unhealthy for Sensitive Groups)
51 (Unhealthy for Sensitive Groups)
90 (Very Unhealthy)
83 (Very Unhealthy)
63 (Unhealthy)
32 (Moderate)
31 (Moderate)
26 (Moderate)
23 (Moderate)
26 (Moderate)
32 (Moderate)
39 (Unhealthy for Sensitive Groups)
56 (Unhealthy)
100 (Very Unhealthy)
118 (Very bad Hazardous)
101 (Very Unhealthy)
87 (Very Unhealthy)
46 (Unhealthy for Sensitive Groups)
co
642 (Good)
662 (Good)
745 (Good)
801 (Good)
1 (Good)
988 (Good)
639 (Good)
393 (Good)
349 (Good)
336 (Good)
308 (Good)
579 (Good)
533 (Good)
628 (Good)
675 (Good)
850 (Good)
1 (Good)
1 (Good)
968 (Good)
585 (Good)
no2
17 (Good)
24 (Good)
22 (Good)
14 (Good)
34 (Good)
42 (Moderate)
39 (Good)
28 (Good)
22 (Good)
14 (Good)
13 (Good)
13 (Good)
14 (Good)
21 (Good)
25 (Good)
23 (Good)
40 (Moderate)
40 (Moderate)
37 (Good)
26 (Good)
o3
135 (Unhealthy for Sensitive Groups)
143 (Unhealthy for Sensitive Groups)
114 (Moderate)
94 (Moderate)
75 (Moderate)
69 (Good)
106 (Moderate)
119 (Moderate)
170 (Unhealthy)
158 (Unhealthy)
146 (Unhealthy for Sensitive Groups)
165 (Unhealthy)
146 (Unhealthy for Sensitive Groups)
133 (Unhealthy for Sensitive Groups)
127 (Unhealthy for Sensitive Groups)
86 (Moderate)
69 (Good)
53 (Good)
99 (Moderate)
128 (Unhealthy for Sensitive Groups)
pm10
52 (Unhealthy for Sensitive Groups)
71 (Unhealthy for Sensitive Groups)
78 (Unhealthy for Sensitive Groups)
72 (Unhealthy for Sensitive Groups)
119 (Very Unhealthy)
120 (Very Unhealthy)
110 (Very Unhealthy)
64 (Unhealthy for Sensitive Groups)
60 (Unhealthy for Sensitive Groups)
45 (Moderate)
40 (Moderate)
60 (Unhealthy for Sensitive Groups)
82 (Unhealthy)
90 (Unhealthy)
101 (Unhealthy)
123 (Very Unhealthy)
155 (Very bad Hazardous)
158 (Very bad Hazardous)
139 (Very Unhealthy)
75 (Unhealthy for Sensitive Groups)
so2
6.3 (Good)
6.9 (Good)
6.8 (Good)
6.1 (Good)
6.2 (Good)
7.6 (Good)
7.6 (Good)
5.9 (Good)
7.9 (Good)
7.9 (Good)
5.4 (Good)
4.7 (Good)
5.9 (Good)
6.7 (Good)
7.1 (Good)
5.9 (Good)
7.7 (Good)
8.3 (Good)
6.9 (Good)
6.9 (Good)
data source »
平桥分局
Friday, May 27, 2022, 12:00 PM
PM10 179 (Very bad Hazardous)
particulate matter (PM10) suspended dust
PM2,5 35 (Unhealthy for Sensitive Groups)
particulate matter (PM2.5) dust
O3 0.04 (Good)
ozone (O3)
NO2 0 (Good)
nitrogen dioxide (NO2)
SO2 0 (Good)
sulfur dioxide (SO2)
平桥分局
index
2022-05-27
pm10
56
pm25
56
o3
0.03
no2
0
so2
0
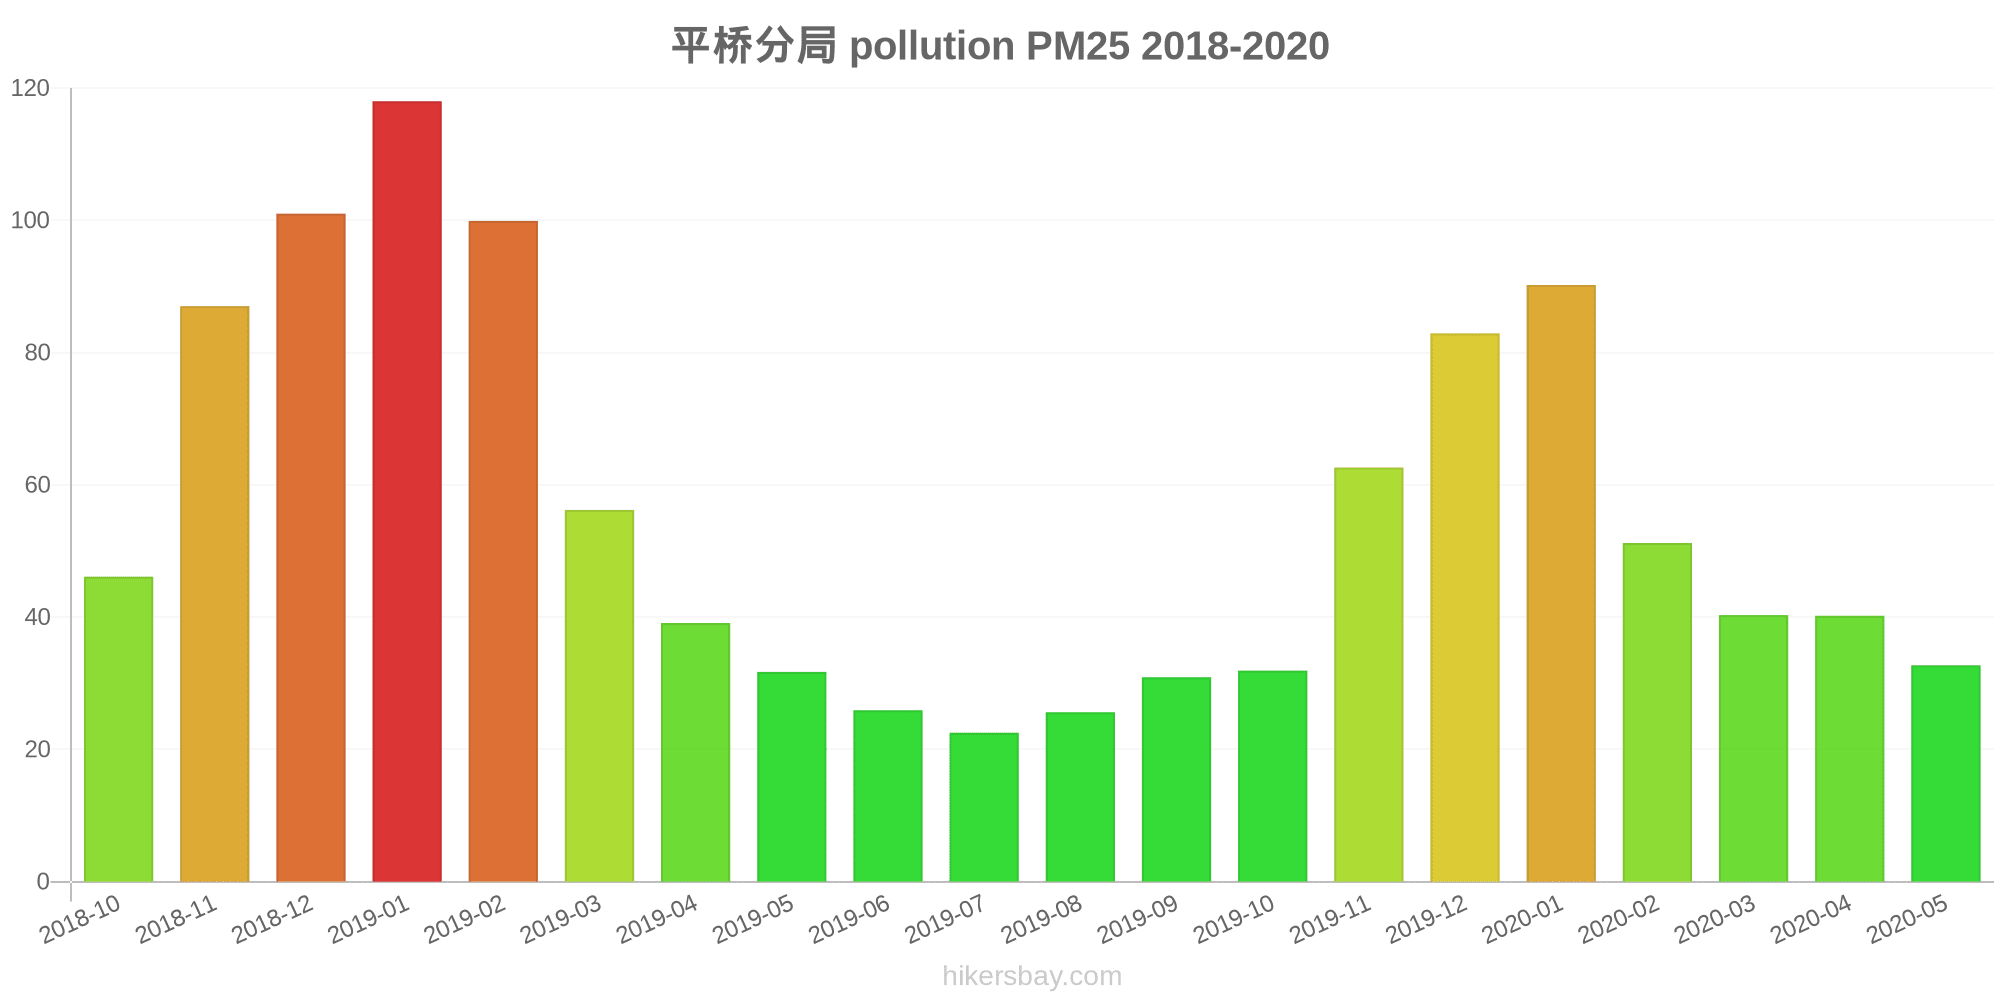
平桥分局
2018-10 2020-05

index
2020-05
2020-04
2020-03
2020-02
2020-01
2019-12
2019-11
2019-10
2019-09
2019-08
2019-07
2019-06
2019-05
2019-04
2019-03
2019-02
2019-01
2018-12
2018-11
2018-10
pm25
33
40
40
51
90
83
63
32
31
26
23
26
32
39
56
100
118
101
87
46
co
642
662
745
801
1
988
639
393
349
336
308
579
533
628
675
850
1
1
968
585
no2
17
24
22
14
34
42
39
28
22
14
13
13
14
21
25
23
40
40
37
26
o3
135
143
114
94
75
69
106
119
170
158
146
165
146
133
127
86
69
53
99
128
pm10
52
71
78
72
119
120
110
64
60
45
40
60
82
90
101
123
155
158
139
75
so2
6.3
6.9
6.8
6.1
6.2
7.6
7.6
5.9
7.9
7.9
5.4
4.7
5.9
6.7
7.1
5.9
7.7
8.3
6.9
6.9
* Pollution data source:
https://openaq.org
(ChinaAQIData)
The data is licensed under CC-By 4.0
PM10 179 (Very bad Hazardous)
PM2,5 35 (Unhealthy for Sensitive Groups)
O3 0 (Good)
NO2 0 (Good)
SO2 0 (Good)
Data on air pollution from recent days in Pingxicun
| index | 2022-05-27 |
|---|---|
| pm10 | 56 Unhealthy for Sensitive Groups |
| pm25 | 56 Unhealthy |
| o3 | 0 Good |
| no2 | 0 Good |
| so2 | 0 Good |
| index | 2020-05 | 2020-04 | 2020-03 | 2020-02 | 2020-01 | 2019-12 | 2019-11 | 2019-10 | 2019-09 | 2019-08 | 2019-07 | 2019-06 | 2019-05 | 2019-04 | 2019-03 | 2019-02 | 2019-01 | 2018-12 | 2018-11 | 2018-10 |
|---|---|---|---|---|---|---|---|---|---|---|---|---|---|---|---|---|---|---|---|---|
| pm25 | 33 (Moderate) | 40 (Unhealthy for Sensitive Groups) | 40 (Unhealthy for Sensitive Groups) | 51 (Unhealthy for Sensitive Groups) | 90 (Very Unhealthy) | 83 (Very Unhealthy) | 63 (Unhealthy) | 32 (Moderate) | 31 (Moderate) | 26 (Moderate) | 23 (Moderate) | 26 (Moderate) | 32 (Moderate) | 39 (Unhealthy for Sensitive Groups) | 56 (Unhealthy) | 100 (Very Unhealthy) | 118 (Very bad Hazardous) | 101 (Very Unhealthy) | 87 (Very Unhealthy) | 46 (Unhealthy for Sensitive Groups) |
| co | 642 (Good) | 662 (Good) | 745 (Good) | 801 (Good) | 1 (Good) | 988 (Good) | 639 (Good) | 393 (Good) | 349 (Good) | 336 (Good) | 308 (Good) | 579 (Good) | 533 (Good) | 628 (Good) | 675 (Good) | 850 (Good) | 1 (Good) | 1 (Good) | 968 (Good) | 585 (Good) |
| no2 | 17 (Good) | 24 (Good) | 22 (Good) | 14 (Good) | 34 (Good) | 42 (Moderate) | 39 (Good) | 28 (Good) | 22 (Good) | 14 (Good) | 13 (Good) | 13 (Good) | 14 (Good) | 21 (Good) | 25 (Good) | 23 (Good) | 40 (Moderate) | 40 (Moderate) | 37 (Good) | 26 (Good) |
| o3 | 135 (Unhealthy for Sensitive Groups) | 143 (Unhealthy for Sensitive Groups) | 114 (Moderate) | 94 (Moderate) | 75 (Moderate) | 69 (Good) | 106 (Moderate) | 119 (Moderate) | 170 (Unhealthy) | 158 (Unhealthy) | 146 (Unhealthy for Sensitive Groups) | 165 (Unhealthy) | 146 (Unhealthy for Sensitive Groups) | 133 (Unhealthy for Sensitive Groups) | 127 (Unhealthy for Sensitive Groups) | 86 (Moderate) | 69 (Good) | 53 (Good) | 99 (Moderate) | 128 (Unhealthy for Sensitive Groups) |
| pm10 | 52 (Unhealthy for Sensitive Groups) | 71 (Unhealthy for Sensitive Groups) | 78 (Unhealthy for Sensitive Groups) | 72 (Unhealthy for Sensitive Groups) | 119 (Very Unhealthy) | 120 (Very Unhealthy) | 110 (Very Unhealthy) | 64 (Unhealthy for Sensitive Groups) | 60 (Unhealthy for Sensitive Groups) | 45 (Moderate) | 40 (Moderate) | 60 (Unhealthy for Sensitive Groups) | 82 (Unhealthy) | 90 (Unhealthy) | 101 (Unhealthy) | 123 (Very Unhealthy) | 155 (Very bad Hazardous) | 158 (Very bad Hazardous) | 139 (Very Unhealthy) | 75 (Unhealthy for Sensitive Groups) |
| so2 | 6.3 (Good) | 6.9 (Good) | 6.8 (Good) | 6.1 (Good) | 6.2 (Good) | 7.6 (Good) | 7.6 (Good) | 5.9 (Good) | 7.9 (Good) | 7.9 (Good) | 5.4 (Good) | 4.7 (Good) | 5.9 (Good) | 6.7 (Good) | 7.1 (Good) | 5.9 (Good) | 7.7 (Good) | 8.3 (Good) | 6.9 (Good) | 6.9 (Good) |
PM10 179 (Very bad Hazardous)
particulate matter (PM10) suspended dustPM2,5 35 (Unhealthy for Sensitive Groups)
particulate matter (PM2.5) dustO3 0.04 (Good)
ozone (O3)NO2 0 (Good)
nitrogen dioxide (NO2)SO2 0 (Good)
sulfur dioxide (SO2)平桥分局
| index | 2022-05-27 |
|---|---|
| pm10 | 56 |
| pm25 | 56 |
| o3 | 0.03 |
| no2 | 0 |
| so2 | 0 |
平桥分局
| index | 2020-05 | 2020-04 | 2020-03 | 2020-02 | 2020-01 | 2019-12 | 2019-11 | 2019-10 | 2019-09 | 2019-08 | 2019-07 | 2019-06 | 2019-05 | 2019-04 | 2019-03 | 2019-02 | 2019-01 | 2018-12 | 2018-11 | 2018-10 |
|---|---|---|---|---|---|---|---|---|---|---|---|---|---|---|---|---|---|---|---|---|
| pm25 | 33 | 40 | 40 | 51 | 90 | 83 | 63 | 32 | 31 | 26 | 23 | 26 | 32 | 39 | 56 | 100 | 118 | 101 | 87 | 46 |
| co | 642 | 662 | 745 | 801 | 1 | 988 | 639 | 393 | 349 | 336 | 308 | 579 | 533 | 628 | 675 | 850 | 1 | 1 | 968 | 585 |
| no2 | 17 | 24 | 22 | 14 | 34 | 42 | 39 | 28 | 22 | 14 | 13 | 13 | 14 | 21 | 25 | 23 | 40 | 40 | 37 | 26 |
| o3 | 135 | 143 | 114 | 94 | 75 | 69 | 106 | 119 | 170 | 158 | 146 | 165 | 146 | 133 | 127 | 86 | 69 | 53 | 99 | 128 |
| pm10 | 52 | 71 | 78 | 72 | 119 | 120 | 110 | 64 | 60 | 45 | 40 | 60 | 82 | 90 | 101 | 123 | 155 | 158 | 139 | 75 |
| so2 | 6.3 | 6.9 | 6.8 | 6.1 | 6.2 | 7.6 | 7.6 | 5.9 | 7.9 | 7.9 | 5.4 | 4.7 | 5.9 | 6.7 | 7.1 | 5.9 | 7.7 | 8.3 | 6.9 | 6.9 |