Air Pollution in Balipucun: Real-time Air Quality Index and smog alert.
Pollution and air quality forecast for Balipucun. Today is Tuesday, June 16, 2026. The following air pollution values have been recorded for Balipucun:- particulate matter (PM10) suspended dust - 7 (Good)
- particulate matter (PM2.5) dust - 2 (Good)
- carbon monoxide (CO) - 100 (Good)
- nitrogen dioxide (NO2) - 8 (Good)
- ozone (O3) - 0 (Good)
- sulfur dioxide (SO2) - 9 (Good)

What is the air quality in Balipucun today? Is the air polluted in Balipucun?. Is there smog?
What is the level of PM10 today in Balipucun? (particulate matter (PM10) suspended dust)
The current level of particulate matter PM10 in Balipucun is:
7 (Good)
The highest PM10 values usually occur in month: 109 (January 2019).
The lowest value of particulate matter PM10 pollution in Balipucun is usually recorded in: August (36).
What is the current level of PM2.5 in Balipucun? (particulate matter (PM2.5) dust)
Today's PM2.5 level is:
2 (Good)
For comparison, the highest level of PM2.5 in Balipucun in the last 7 days was: 24 (Friday, May 27, 2022) and the lowest: 24 (Friday, May 27, 2022).
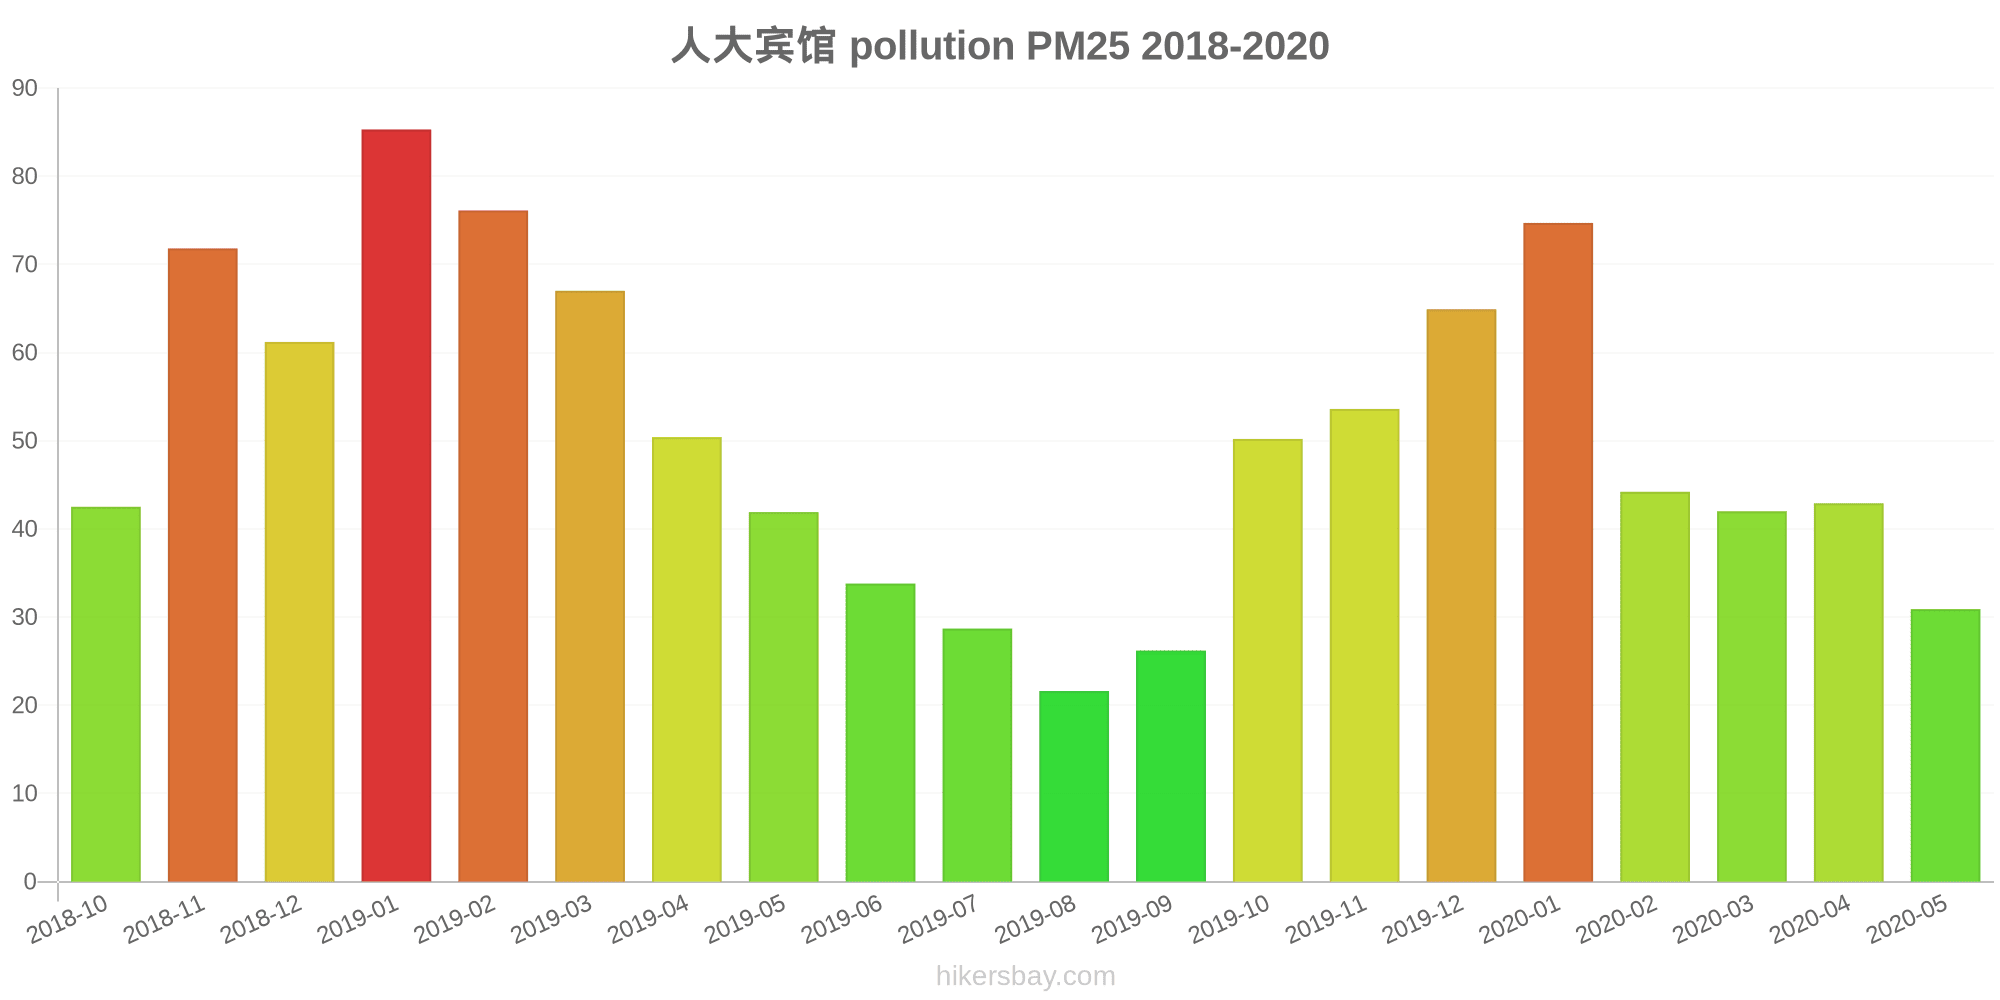
The highest PM2.5 values were recorded: 85 (January 2019).
The lowest level of particulate matter PM2.5 pollution occurs in month: August (22).
How high is the CO level? (carbon monoxide (CO))
100 (Good)
How high is the level of NO2? (nitrogen dioxide (NO2))
8 (Good)
How is the O3 level today in Balipucun? (ozone (O3))
0 (Good)
What is the level of SO2 pollution? (sulfur dioxide (SO2))
9 (Good)
Current data Friday, May 27, 2022, 12:00 PM
PM10 7 (Good)
PM2,5 2 (Good)
CO 100 (Good)
NO2 8 (Good)
O3 0 (Good)
SO2 9 (Good)
Data on air pollution from recent days in Balipucun
index
2022-05-27
pm10
32
Moderate
pm25
24
Moderate
co
468
Good
no2
21
Good
o3
32
Good
so2
5
Good
data source »
Air pollution in Balipucun from October 2018 to May 2020

index
2020-05
2020-04
2020-03
2020-02
2020-01
2019-12
2019-11
2019-10
2019-09
2019-08
2019-07
2019-06
2019-05
2019-04
2019-03
2019-02
2019-01
2018-12
2018-11
2018-10
pm25
31 (Moderate)
43 (Unhealthy for Sensitive Groups)
42 (Unhealthy for Sensitive Groups)
44 (Unhealthy for Sensitive Groups)
75 (Unhealthy)
65 (Unhealthy)
54 (Unhealthy for Sensitive Groups)
50 (Unhealthy for Sensitive Groups)
26 (Moderate)
22 (Moderate)
29 (Moderate)
34 (Moderate)
42 (Unhealthy for Sensitive Groups)
50 (Unhealthy for Sensitive Groups)
67 (Unhealthy)
76 (Very Unhealthy)
85 (Very Unhealthy)
61 (Unhealthy)
72 (Unhealthy)
43 (Unhealthy for Sensitive Groups)
co
657 (Good)
717 (Good)
813 (Good)
872 (Good)
1 (Good)
1 (Good)
870 (Good)
873 (Good)
793 (Good)
725 (Good)
775 (Good)
743 (Good)
815 (Good)
782 (Good)
742 (Good)
840 (Good)
1 (Good)
731 (Good)
898 (Good)
571 (Good)
no2
21 (Good)
33 (Good)
32 (Good)
24 (Good)
42 (Moderate)
55 (Moderate)
55 (Moderate)
40 (Moderate)
25 (Good)
19 (Good)
18 (Good)
28 (Good)
39 (Good)
45 (Moderate)
54 (Moderate)
38 (Good)
48 (Moderate)
47 (Moderate)
57 (Moderate)
44 (Moderate)
o3
137 (Unhealthy for Sensitive Groups)
142 (Unhealthy for Sensitive Groups)
107 (Moderate)
91 (Moderate)
71 (Moderate)
75 (Moderate)
103 (Moderate)
131 (Unhealthy for Sensitive Groups)
155 (Unhealthy)
156 (Unhealthy)
159 (Unhealthy)
194 (Very Unhealthy)
152 (Unhealthy)
130 (Unhealthy for Sensitive Groups)
112 (Moderate)
84 (Moderate)
66 (Good)
56 (Good)
90 (Moderate)
124 (Unhealthy for Sensitive Groups)
pm10
54 (Unhealthy for Sensitive Groups)
75 (Unhealthy for Sensitive Groups)
67 (Unhealthy for Sensitive Groups)
48 (Moderate)
77 (Unhealthy for Sensitive Groups)
84 (Unhealthy)
89 (Unhealthy)
91 (Unhealthy)
45 (Moderate)
36 (Moderate)
45 (Moderate)
49 (Moderate)
62 (Unhealthy for Sensitive Groups)
74 (Unhealthy for Sensitive Groups)
100 (Unhealthy)
90 (Unhealthy)
109 (Unhealthy)
76 (Unhealthy for Sensitive Groups)
84 (Unhealthy)
65 (Unhealthy for Sensitive Groups)
so2
4.1 (Good)
10 (Good)
6 (Good)
4.6 (Good)
5 (Good)
7.6 (Good)
9.7 (Good)
10 (Good)
9.2 (Good)
8.5 (Good)
8.6 (Good)
10 (Good)
11 (Good)
9.7 (Good)
11 (Good)
6.9 (Good)
10 (Good)
9.4 (Good)
8.8 (Good)
9.7 (Good)
data source »
Chuzhou Ren Da Bin Guan
Friday, May 27, 2022, 12:00 PM
PM10 6.7 (Good)
particulate matter (PM10) suspended dust
PM2,5 1.7 (Good)
particulate matter (PM2.5) dust
CO 100 (Good)
carbon monoxide (CO)
NO2 7.6 (Good)
nitrogen dioxide (NO2)
O3 0.02 (Good)
ozone (O3)
SO2 8.6 (Good)
sulfur dioxide (SO2)
市政府原办公楼(190307启用)
Friday, May 27, 2022, 12:00 PM
PM10 6.7 (Good)
particulate matter (PM10) suspended dust
PM2,5 1.7 (Good)
particulate matter (PM2.5) dust
CO 100 (Good)
carbon monoxide (CO)
NO2 7.6 (Good)
nitrogen dioxide (NO2)
O3 0.02 (Good)
ozone (O3)
SO2 8.6 (Good)
sulfur dioxide (SO2)
Chuzhou Ren Da Bin Guan
index
2022-05-27
pm10
32
pm25
24
co
468
no2
21
o3
32
so2
4.6
市政府原办公楼(190307启用)
index
2022-05-27
pm10
32
pm25
24
co
468
no2
21
o3
32
so2
4.6
人大宾馆
2018-10 2020-05

index
2020-05
2020-04
2020-03
2020-02
2020-01
2019-12
2019-11
2019-10
2019-09
2019-08
2019-07
2019-06
2019-05
2019-04
2019-03
2019-02
2019-01
2018-12
2018-11
2018-10
pm25
31
43
42
44
75
65
54
50
26
22
29
34
42
50
67
76
85
61
72
43
co
657
717
813
872
1
1
870
873
793
725
775
743
815
782
742
840
1
731
898
571
no2
21
33
32
24
42
55
55
40
25
19
18
28
39
45
54
38
48
47
57
44
o3
137
142
107
91
71
75
103
131
155
156
159
194
152
130
112
84
66
56
90
124
pm10
54
75
67
48
77
84
89
91
45
36
45
49
62
74
100
90
109
76
84
65
so2
4.1
10
6
4.6
5
7.6
9.7
10
9.2
8.5
8.6
10
11
9.7
11
6.9
10
9.4
8.8
9.7
* Pollution data source:
https://openaq.org
(ChinaAQIData)
The data is licensed under CC-By 4.0
PM10 7 (Good)
PM2,5 2 (Good)
CO 100 (Good)
NO2 8 (Good)
O3 0 (Good)
SO2 9 (Good)
Data on air pollution from recent days in Balipucun
| index | 2022-05-27 |
|---|---|
| pm10 | 32 Moderate |
| pm25 | 24 Moderate |
| co | 468 Good |
| no2 | 21 Good |
| o3 | 32 Good |
| so2 | 5 Good |

| index | 2020-05 | 2020-04 | 2020-03 | 2020-02 | 2020-01 | 2019-12 | 2019-11 | 2019-10 | 2019-09 | 2019-08 | 2019-07 | 2019-06 | 2019-05 | 2019-04 | 2019-03 | 2019-02 | 2019-01 | 2018-12 | 2018-11 | 2018-10 |
|---|---|---|---|---|---|---|---|---|---|---|---|---|---|---|---|---|---|---|---|---|
| pm25 | 31 (Moderate) | 43 (Unhealthy for Sensitive Groups) | 42 (Unhealthy for Sensitive Groups) | 44 (Unhealthy for Sensitive Groups) | 75 (Unhealthy) | 65 (Unhealthy) | 54 (Unhealthy for Sensitive Groups) | 50 (Unhealthy for Sensitive Groups) | 26 (Moderate) | 22 (Moderate) | 29 (Moderate) | 34 (Moderate) | 42 (Unhealthy for Sensitive Groups) | 50 (Unhealthy for Sensitive Groups) | 67 (Unhealthy) | 76 (Very Unhealthy) | 85 (Very Unhealthy) | 61 (Unhealthy) | 72 (Unhealthy) | 43 (Unhealthy for Sensitive Groups) |
| co | 657 (Good) | 717 (Good) | 813 (Good) | 872 (Good) | 1 (Good) | 1 (Good) | 870 (Good) | 873 (Good) | 793 (Good) | 725 (Good) | 775 (Good) | 743 (Good) | 815 (Good) | 782 (Good) | 742 (Good) | 840 (Good) | 1 (Good) | 731 (Good) | 898 (Good) | 571 (Good) |
| no2 | 21 (Good) | 33 (Good) | 32 (Good) | 24 (Good) | 42 (Moderate) | 55 (Moderate) | 55 (Moderate) | 40 (Moderate) | 25 (Good) | 19 (Good) | 18 (Good) | 28 (Good) | 39 (Good) | 45 (Moderate) | 54 (Moderate) | 38 (Good) | 48 (Moderate) | 47 (Moderate) | 57 (Moderate) | 44 (Moderate) |
| o3 | 137 (Unhealthy for Sensitive Groups) | 142 (Unhealthy for Sensitive Groups) | 107 (Moderate) | 91 (Moderate) | 71 (Moderate) | 75 (Moderate) | 103 (Moderate) | 131 (Unhealthy for Sensitive Groups) | 155 (Unhealthy) | 156 (Unhealthy) | 159 (Unhealthy) | 194 (Very Unhealthy) | 152 (Unhealthy) | 130 (Unhealthy for Sensitive Groups) | 112 (Moderate) | 84 (Moderate) | 66 (Good) | 56 (Good) | 90 (Moderate) | 124 (Unhealthy for Sensitive Groups) |
| pm10 | 54 (Unhealthy for Sensitive Groups) | 75 (Unhealthy for Sensitive Groups) | 67 (Unhealthy for Sensitive Groups) | 48 (Moderate) | 77 (Unhealthy for Sensitive Groups) | 84 (Unhealthy) | 89 (Unhealthy) | 91 (Unhealthy) | 45 (Moderate) | 36 (Moderate) | 45 (Moderate) | 49 (Moderate) | 62 (Unhealthy for Sensitive Groups) | 74 (Unhealthy for Sensitive Groups) | 100 (Unhealthy) | 90 (Unhealthy) | 109 (Unhealthy) | 76 (Unhealthy for Sensitive Groups) | 84 (Unhealthy) | 65 (Unhealthy for Sensitive Groups) |
| so2 | 4.1 (Good) | 10 (Good) | 6 (Good) | 4.6 (Good) | 5 (Good) | 7.6 (Good) | 9.7 (Good) | 10 (Good) | 9.2 (Good) | 8.5 (Good) | 8.6 (Good) | 10 (Good) | 11 (Good) | 9.7 (Good) | 11 (Good) | 6.9 (Good) | 10 (Good) | 9.4 (Good) | 8.8 (Good) | 9.7 (Good) |
PM10 6.7 (Good)
particulate matter (PM10) suspended dustPM2,5 1.7 (Good)
particulate matter (PM2.5) dustCO 100 (Good)
carbon monoxide (CO)NO2 7.6 (Good)
nitrogen dioxide (NO2)O3 0.02 (Good)
ozone (O3)SO2 8.6 (Good)
sulfur dioxide (SO2)PM10 6.7 (Good)
particulate matter (PM10) suspended dustPM2,5 1.7 (Good)
particulate matter (PM2.5) dustCO 100 (Good)
carbon monoxide (CO)NO2 7.6 (Good)
nitrogen dioxide (NO2)O3 0.02 (Good)
ozone (O3)SO2 8.6 (Good)
sulfur dioxide (SO2)Chuzhou Ren Da Bin Guan
| index | 2022-05-27 |
|---|---|
| pm10 | 32 |
| pm25 | 24 |
| co | 468 |
| no2 | 21 |
| o3 | 32 |
| so2 | 4.6 |
市政府原办公楼(190307启用)
| index | 2022-05-27 |
|---|---|
| pm10 | 32 |
| pm25 | 24 |
| co | 468 |
| no2 | 21 |
| o3 | 32 |
| so2 | 4.6 |
人大宾馆
| index | 2020-05 | 2020-04 | 2020-03 | 2020-02 | 2020-01 | 2019-12 | 2019-11 | 2019-10 | 2019-09 | 2019-08 | 2019-07 | 2019-06 | 2019-05 | 2019-04 | 2019-03 | 2019-02 | 2019-01 | 2018-12 | 2018-11 | 2018-10 |
|---|---|---|---|---|---|---|---|---|---|---|---|---|---|---|---|---|---|---|---|---|
| pm25 | 31 | 43 | 42 | 44 | 75 | 65 | 54 | 50 | 26 | 22 | 29 | 34 | 42 | 50 | 67 | 76 | 85 | 61 | 72 | 43 |
| co | 657 | 717 | 813 | 872 | 1 | 1 | 870 | 873 | 793 | 725 | 775 | 743 | 815 | 782 | 742 | 840 | 1 | 731 | 898 | 571 |
| no2 | 21 | 33 | 32 | 24 | 42 | 55 | 55 | 40 | 25 | 19 | 18 | 28 | 39 | 45 | 54 | 38 | 48 | 47 | 57 | 44 |
| o3 | 137 | 142 | 107 | 91 | 71 | 75 | 103 | 131 | 155 | 156 | 159 | 194 | 152 | 130 | 112 | 84 | 66 | 56 | 90 | 124 |
| pm10 | 54 | 75 | 67 | 48 | 77 | 84 | 89 | 91 | 45 | 36 | 45 | 49 | 62 | 74 | 100 | 90 | 109 | 76 | 84 | 65 |
| so2 | 4.1 | 10 | 6 | 4.6 | 5 | 7.6 | 9.7 | 10 | 9.2 | 8.5 | 8.6 | 10 | 11 | 9.7 | 11 | 6.9 | 10 | 9.4 | 8.8 | 9.7 |