Air Pollution in Liugangcun: Real-time Air Quality Index and smog alert.
Pollution and air quality forecast for Liugangcun. Today is Tuesday, June 16, 2026. The following air pollution values have been recorded for Liugangcun:- particulate matter (PM10) suspended dust - 7 (Good)
- particulate matter (PM2.5) dust - 2 (Good)
- carbon monoxide (CO) - 100 (Good)
- nitrogen dioxide (NO2) - 8 (Good)
- ozone (O3) - 0 (Good)
- sulfur dioxide (SO2) - 9 (Good)

What is the air quality in Liugangcun today? Is the air polluted in Liugangcun?. Is there smog?
What is the level of PM10 today in Liugangcun? (particulate matter (PM10) suspended dust)
The current level of particulate matter PM10 in Liugangcun is:
7 (Good)
The highest PM10 values usually occur in month: 140 (January 2019).
The lowest value of particulate matter PM10 pollution in Liugangcun is usually recorded in: May (56).
What is the current level of PM2.5 in Liugangcun? (particulate matter (PM2.5) dust)
Today's PM2.5 level is:
2 (Good)
For comparison, the highest level of PM2.5 in Liugangcun in the last 7 days was: 24 (Friday, May 27, 2022) and the lowest: 24 (Friday, May 27, 2022).
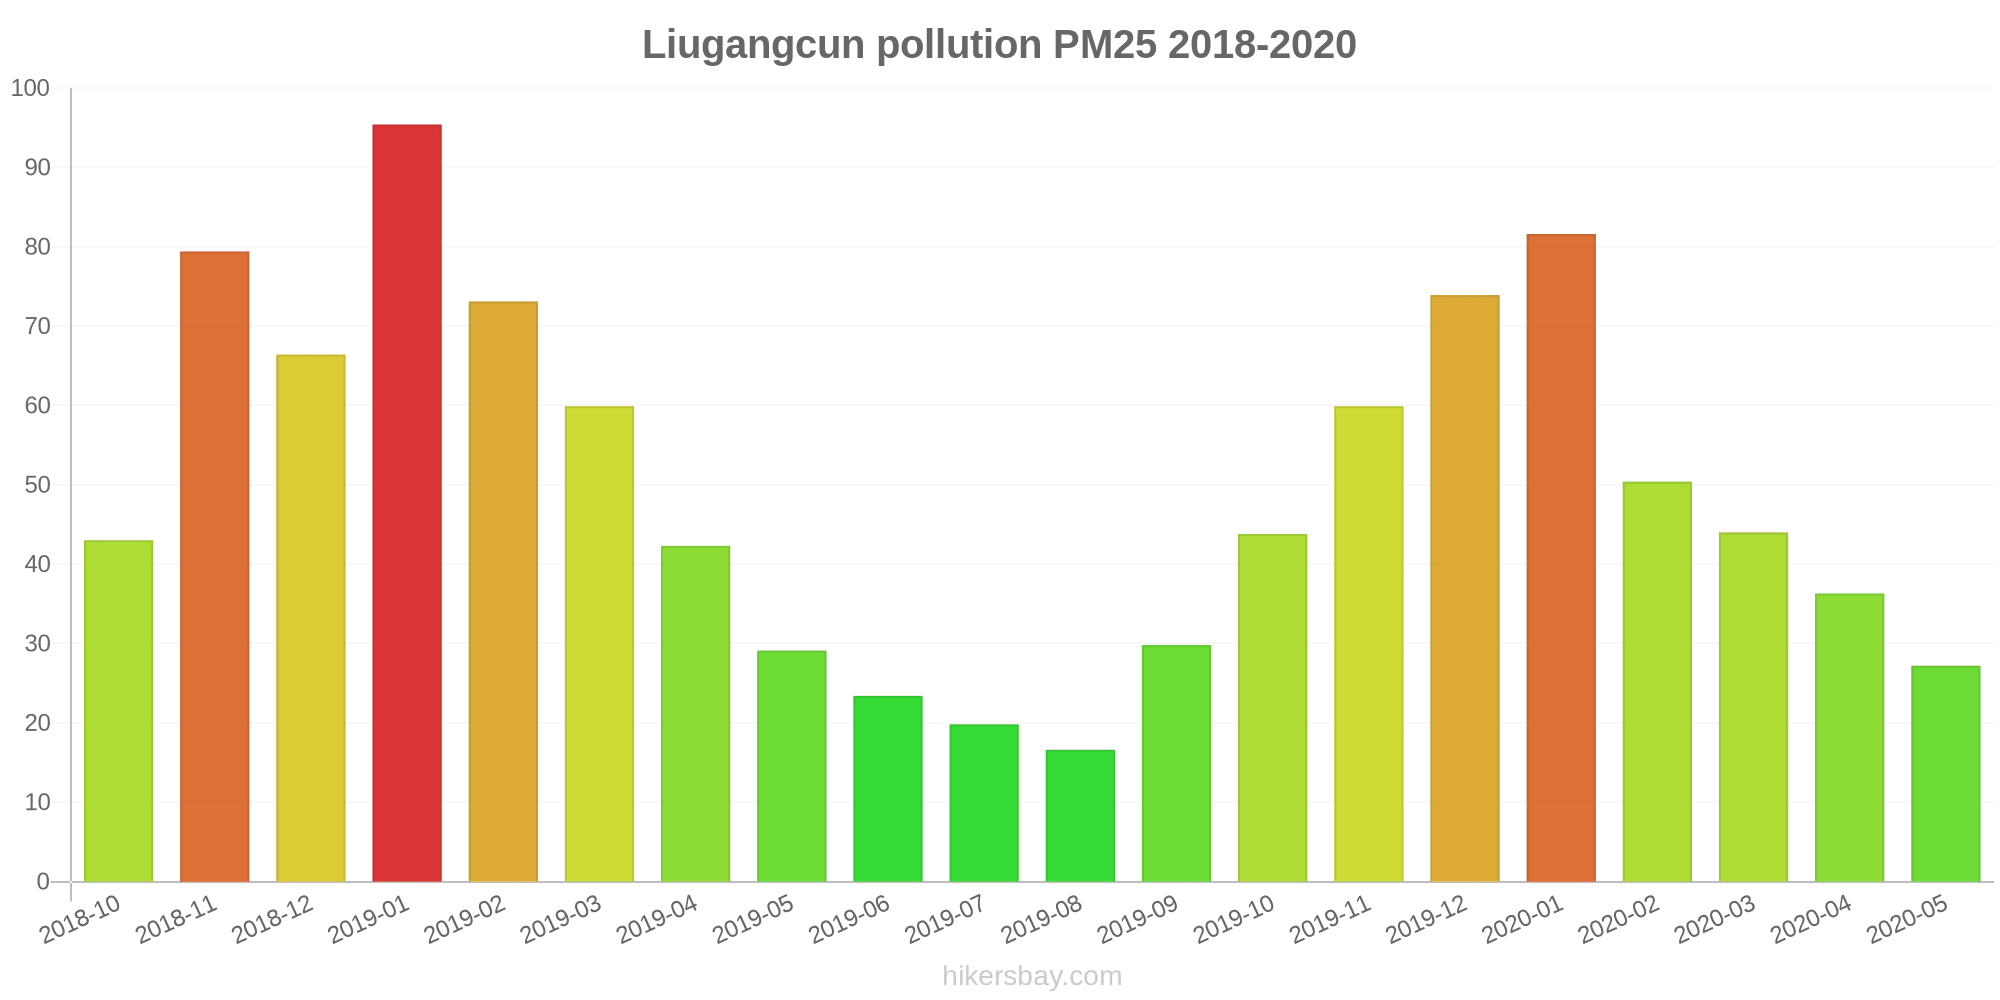
The highest PM2.5 values were recorded: 95 (January 2019).
The lowest level of particulate matter PM2.5 pollution occurs in month: August (17).
How high is the CO level? (carbon monoxide (CO))
100 (Good)
How high is the level of NO2? (nitrogen dioxide (NO2))
8 (Good)
How is the O3 level today in Liugangcun? (ozone (O3))
0 (Good)
What is the level of SO2 pollution? (sulfur dioxide (SO2))
9 (Good)
Current data Friday, May 27, 2022, 12:00 PM
PM10 7 (Good)
PM2,5 2 (Good)
CO 100 (Good)
NO2 8 (Good)
O3 0 (Good)
SO2 9 (Good)
Data on air pollution from recent days in Liugangcun
index
2022-05-27
pm10
32
Moderate
pm25
24
Moderate
co
468
Good
no2
21
Good
o3
32
Good
so2
5
Good
data source »
Air pollution in Liugangcun from October 2018 to May 2020

index
2020-05
2020-04
2020-03
2020-02
2020-01
2019-12
2019-11
2019-10
2019-09
2019-08
2019-07
2019-06
2019-05
2019-04
2019-03
2019-02
2019-01
2018-12
2018-11
2018-10
pm25
27 (Moderate)
36 (Unhealthy for Sensitive Groups)
44 (Unhealthy for Sensitive Groups)
50 (Unhealthy for Sensitive Groups)
82 (Very Unhealthy)
74 (Unhealthy)
60 (Unhealthy)
44 (Unhealthy for Sensitive Groups)
30 (Moderate)
17 (Moderate)
20 (Moderate)
23 (Moderate)
29 (Moderate)
42 (Unhealthy for Sensitive Groups)
60 (Unhealthy)
73 (Unhealthy)
95 (Very Unhealthy)
66 (Unhealthy)
79 (Very Unhealthy)
43 (Unhealthy for Sensitive Groups)
co
552 (Good)
545 (Good)
576 (Good)
604 (Good)
827 (Good)
662 (Good)
537 (Good)
632 (Good)
597 (Good)
513 (Good)
591 (Good)
595 (Good)
451 (Good)
563 (Good)
609 (Good)
719 (Good)
925 (Good)
784 (Good)
768 (Good)
491 (Good)
no2
25 (Good)
40 (Good)
32 (Good)
20 (Good)
36 (Good)
45 (Moderate)
41 (Moderate)
33 (Good)
25 (Good)
17 (Good)
16 (Good)
18 (Good)
27 (Good)
40 (Moderate)
47 (Moderate)
35 (Good)
47 (Moderate)
48 (Moderate)
35 (Good)
33 (Good)
o3
135 (Unhealthy for Sensitive Groups)
136 (Unhealthy for Sensitive Groups)
107 (Moderate)
91 (Moderate)
64 (Good)
68 (Good)
98 (Moderate)
106 (Moderate)
137 (Unhealthy for Sensitive Groups)
151 (Unhealthy)
145 (Unhealthy for Sensitive Groups)
173 (Unhealthy)
145 (Unhealthy for Sensitive Groups)
120 (Unhealthy for Sensitive Groups)
123 (Unhealthy for Sensitive Groups)
85 (Moderate)
69 (Good)
62 (Good)
102 (Moderate)
129 (Unhealthy for Sensitive Groups)
pm10
56 (Unhealthy for Sensitive Groups)
72 (Unhealthy for Sensitive Groups)
75 (Unhealthy for Sensitive Groups)
68 (Unhealthy for Sensitive Groups)
101 (Unhealthy)
106 (Unhealthy)
118 (Very Unhealthy)
98 (Unhealthy)
62 (Unhealthy for Sensitive Groups)
56 (Unhealthy for Sensitive Groups)
58 (Unhealthy for Sensitive Groups)
63 (Unhealthy for Sensitive Groups)
88 (Unhealthy)
107 (Unhealthy)
133 (Very Unhealthy)
121 (Very Unhealthy)
140 (Very Unhealthy)
104 (Unhealthy)
124 (Very Unhealthy)
82 (Unhealthy)
so2
5.9 (Good)
7.8 (Good)
6.8 (Good)
11 (Good)
8.6 (Good)
14 (Good)
14 (Good)
11 (Good)
13 (Good)
6.9 (Good)
7.1 (Good)
10 (Good)
12 (Good)
8 (Good)
8.6 (Good)
8.9 (Good)
15 (Good)
13 (Good)
12 (Good)
11 (Good)
data source »
Huainan Jiao Gang Hu Feng Jing Qu Guan Li Chu
Friday, May 27, 2022, 12:00 PM
PM10 6.7 (Good)
particulate matter (PM10) suspended dust
PM2,5 1.7 (Good)
particulate matter (PM2.5) dust
CO 100 (Good)
carbon monoxide (CO)
NO2 7.6 (Good)
nitrogen dioxide (NO2)
O3 0.02 (Good)
ozone (O3)
SO2 8.6 (Good)
sulfur dioxide (SO2)
Huainan Jiao Gang Hu Feng Jing Qu Guan Li Chu
index
2022-05-27
pm10
32
pm25
24
co
468
no2
21
o3
32
so2
4.6
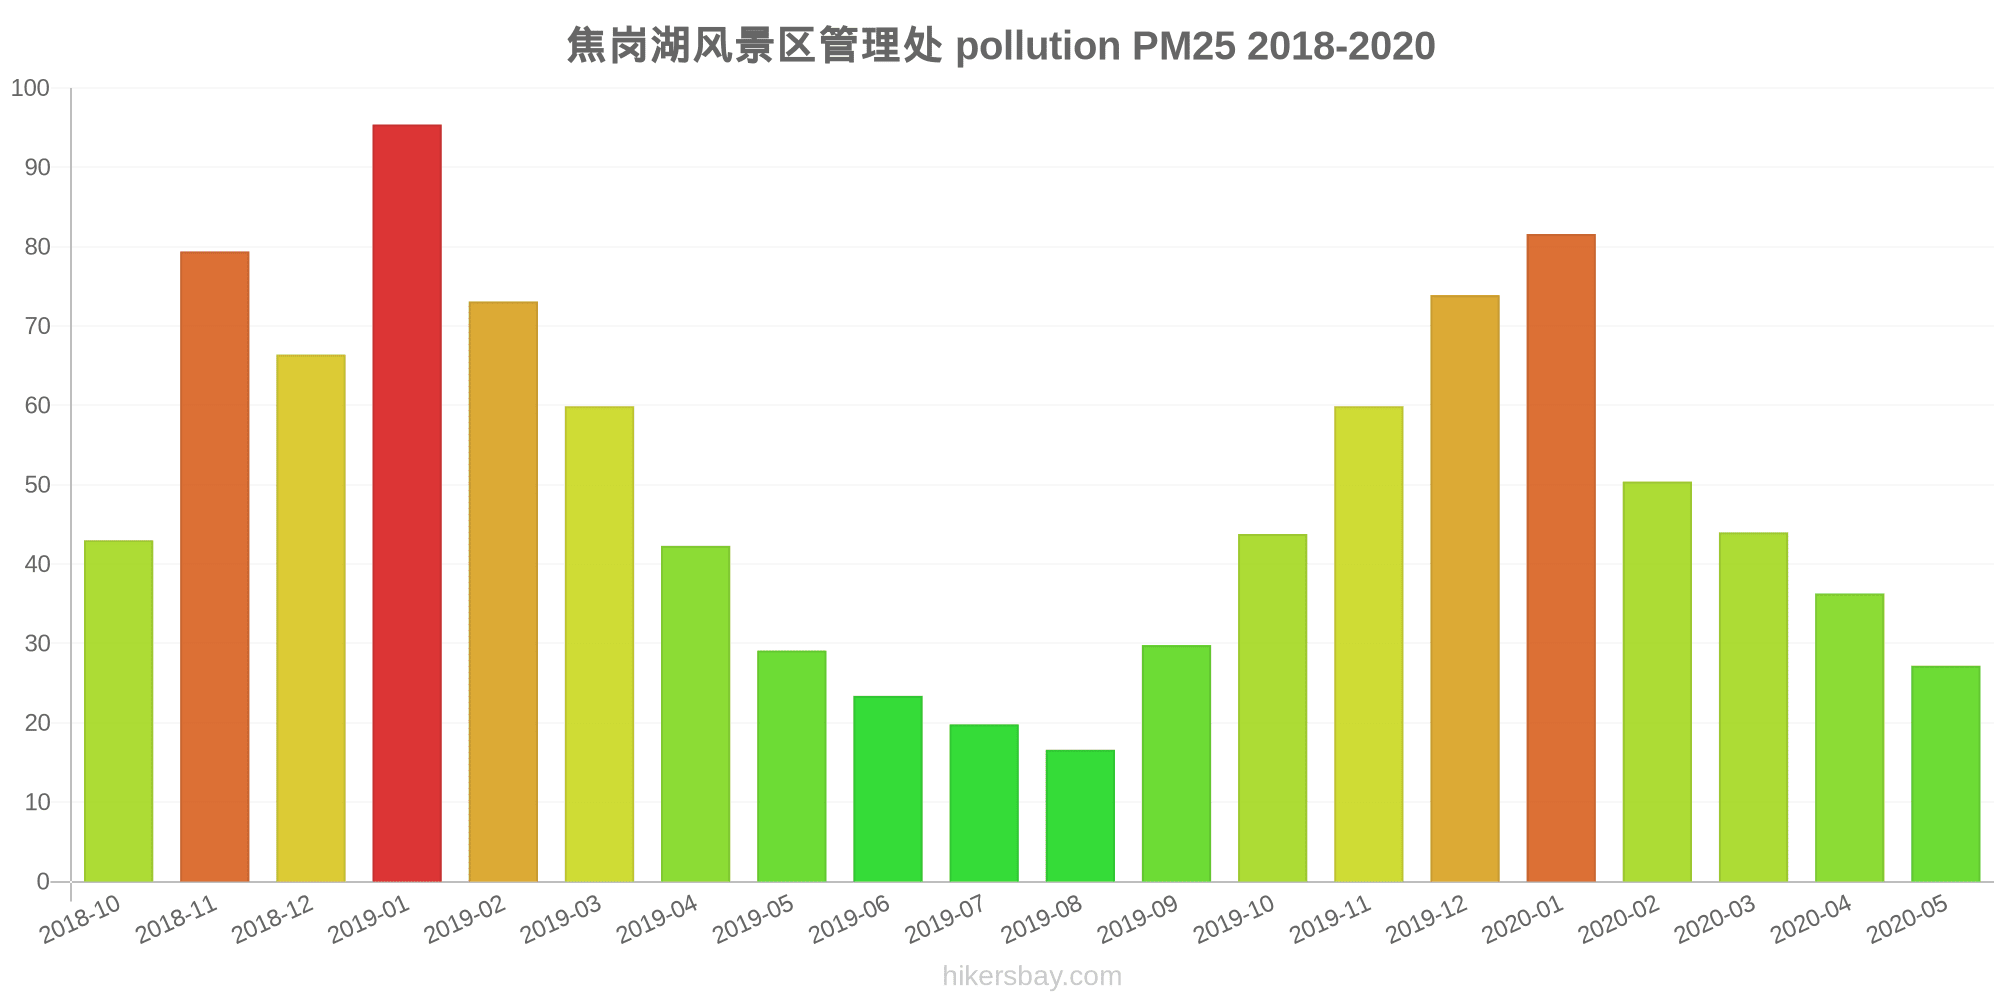
焦岗湖风景区管理处
2018-10 2020-05

index
2020-05
2020-04
2020-03
2020-02
2020-01
2019-12
2019-11
2019-10
2019-09
2019-08
2019-07
2019-06
2019-05
2019-04
2019-03
2019-02
2019-01
2018-12
2018-11
2018-10
pm25
27
36
44
50
82
74
60
44
30
17
20
23
29
42
60
73
95
66
79
43
co
552
545
576
604
827
662
537
632
597
513
591
595
451
563
609
719
925
784
768
491
no2
25
40
32
20
36
45
41
33
25
17
16
18
27
40
47
35
47
48
35
33
o3
135
136
107
91
64
68
98
106
137
151
145
173
145
120
123
85
69
62
102
129
pm10
56
72
75
68
101
106
118
98
62
56
58
63
88
107
133
121
140
104
124
82
so2
5.9
7.8
6.8
11
8.6
14
14
11
13
6.9
7.1
10
12
8
8.6
8.9
15
13
12
11
* Pollution data source:
https://openaq.org
(ChinaAQIData)
The data is licensed under CC-By 4.0
PM10 7 (Good)
PM2,5 2 (Good)
CO 100 (Good)
NO2 8 (Good)
O3 0 (Good)
SO2 9 (Good)
Data on air pollution from recent days in Liugangcun
| index | 2022-05-27 |
|---|---|
| pm10 | 32 Moderate |
| pm25 | 24 Moderate |
| co | 468 Good |
| no2 | 21 Good |
| o3 | 32 Good |
| so2 | 5 Good |
| index | 2020-05 | 2020-04 | 2020-03 | 2020-02 | 2020-01 | 2019-12 | 2019-11 | 2019-10 | 2019-09 | 2019-08 | 2019-07 | 2019-06 | 2019-05 | 2019-04 | 2019-03 | 2019-02 | 2019-01 | 2018-12 | 2018-11 | 2018-10 |
|---|---|---|---|---|---|---|---|---|---|---|---|---|---|---|---|---|---|---|---|---|
| pm25 | 27 (Moderate) | 36 (Unhealthy for Sensitive Groups) | 44 (Unhealthy for Sensitive Groups) | 50 (Unhealthy for Sensitive Groups) | 82 (Very Unhealthy) | 74 (Unhealthy) | 60 (Unhealthy) | 44 (Unhealthy for Sensitive Groups) | 30 (Moderate) | 17 (Moderate) | 20 (Moderate) | 23 (Moderate) | 29 (Moderate) | 42 (Unhealthy for Sensitive Groups) | 60 (Unhealthy) | 73 (Unhealthy) | 95 (Very Unhealthy) | 66 (Unhealthy) | 79 (Very Unhealthy) | 43 (Unhealthy for Sensitive Groups) |
| co | 552 (Good) | 545 (Good) | 576 (Good) | 604 (Good) | 827 (Good) | 662 (Good) | 537 (Good) | 632 (Good) | 597 (Good) | 513 (Good) | 591 (Good) | 595 (Good) | 451 (Good) | 563 (Good) | 609 (Good) | 719 (Good) | 925 (Good) | 784 (Good) | 768 (Good) | 491 (Good) |
| no2 | 25 (Good) | 40 (Good) | 32 (Good) | 20 (Good) | 36 (Good) | 45 (Moderate) | 41 (Moderate) | 33 (Good) | 25 (Good) | 17 (Good) | 16 (Good) | 18 (Good) | 27 (Good) | 40 (Moderate) | 47 (Moderate) | 35 (Good) | 47 (Moderate) | 48 (Moderate) | 35 (Good) | 33 (Good) |
| o3 | 135 (Unhealthy for Sensitive Groups) | 136 (Unhealthy for Sensitive Groups) | 107 (Moderate) | 91 (Moderate) | 64 (Good) | 68 (Good) | 98 (Moderate) | 106 (Moderate) | 137 (Unhealthy for Sensitive Groups) | 151 (Unhealthy) | 145 (Unhealthy for Sensitive Groups) | 173 (Unhealthy) | 145 (Unhealthy for Sensitive Groups) | 120 (Unhealthy for Sensitive Groups) | 123 (Unhealthy for Sensitive Groups) | 85 (Moderate) | 69 (Good) | 62 (Good) | 102 (Moderate) | 129 (Unhealthy for Sensitive Groups) |
| pm10 | 56 (Unhealthy for Sensitive Groups) | 72 (Unhealthy for Sensitive Groups) | 75 (Unhealthy for Sensitive Groups) | 68 (Unhealthy for Sensitive Groups) | 101 (Unhealthy) | 106 (Unhealthy) | 118 (Very Unhealthy) | 98 (Unhealthy) | 62 (Unhealthy for Sensitive Groups) | 56 (Unhealthy for Sensitive Groups) | 58 (Unhealthy for Sensitive Groups) | 63 (Unhealthy for Sensitive Groups) | 88 (Unhealthy) | 107 (Unhealthy) | 133 (Very Unhealthy) | 121 (Very Unhealthy) | 140 (Very Unhealthy) | 104 (Unhealthy) | 124 (Very Unhealthy) | 82 (Unhealthy) |
| so2 | 5.9 (Good) | 7.8 (Good) | 6.8 (Good) | 11 (Good) | 8.6 (Good) | 14 (Good) | 14 (Good) | 11 (Good) | 13 (Good) | 6.9 (Good) | 7.1 (Good) | 10 (Good) | 12 (Good) | 8 (Good) | 8.6 (Good) | 8.9 (Good) | 15 (Good) | 13 (Good) | 12 (Good) | 11 (Good) |
PM10 6.7 (Good)
particulate matter (PM10) suspended dustPM2,5 1.7 (Good)
particulate matter (PM2.5) dustCO 100 (Good)
carbon monoxide (CO)NO2 7.6 (Good)
nitrogen dioxide (NO2)O3 0.02 (Good)
ozone (O3)SO2 8.6 (Good)
sulfur dioxide (SO2)Huainan Jiao Gang Hu Feng Jing Qu Guan Li Chu
| index | 2022-05-27 |
|---|---|
| pm10 | 32 |
| pm25 | 24 |
| co | 468 |
| no2 | 21 |
| o3 | 32 |
| so2 | 4.6 |
焦岗湖风景区管理处
| index | 2020-05 | 2020-04 | 2020-03 | 2020-02 | 2020-01 | 2019-12 | 2019-11 | 2019-10 | 2019-09 | 2019-08 | 2019-07 | 2019-06 | 2019-05 | 2019-04 | 2019-03 | 2019-02 | 2019-01 | 2018-12 | 2018-11 | 2018-10 |
|---|---|---|---|---|---|---|---|---|---|---|---|---|---|---|---|---|---|---|---|---|
| pm25 | 27 | 36 | 44 | 50 | 82 | 74 | 60 | 44 | 30 | 17 | 20 | 23 | 29 | 42 | 60 | 73 | 95 | 66 | 79 | 43 |
| co | 552 | 545 | 576 | 604 | 827 | 662 | 537 | 632 | 597 | 513 | 591 | 595 | 451 | 563 | 609 | 719 | 925 | 784 | 768 | 491 |
| no2 | 25 | 40 | 32 | 20 | 36 | 45 | 41 | 33 | 25 | 17 | 16 | 18 | 27 | 40 | 47 | 35 | 47 | 48 | 35 | 33 |
| o3 | 135 | 136 | 107 | 91 | 64 | 68 | 98 | 106 | 137 | 151 | 145 | 173 | 145 | 120 | 123 | 85 | 69 | 62 | 102 | 129 |
| pm10 | 56 | 72 | 75 | 68 | 101 | 106 | 118 | 98 | 62 | 56 | 58 | 63 | 88 | 107 | 133 | 121 | 140 | 104 | 124 | 82 |
| so2 | 5.9 | 7.8 | 6.8 | 11 | 8.6 | 14 | 14 | 11 | 13 | 6.9 | 7.1 | 10 | 12 | 8 | 8.6 | 8.9 | 15 | 13 | 12 | 11 |