Air Pollution in Wawuli: Real-time Air Quality Index and smog alert.
Pollution and air quality forecast for Wawuli. Today is Tuesday, June 2, 2026. The following air pollution values have been recorded for Wawuli:- particulate matter (PM10) suspended dust - 179 (Very bad Hazardous)
- particulate matter (PM2.5) dust - 35 (Unhealthy for Sensitive Groups)
- ozone (O3) - 0 (Good)
- nitrogen dioxide (NO2) - 0 (Good)
- sulfur dioxide (SO2) - 0 (Good)

What is the air quality in Wawuli today? Is the air polluted in Wawuli?. Is there smog?
What is the level of PM10 today in Wawuli? (particulate matter (PM10) suspended dust)
The current level of particulate matter PM10 in Wawuli is:
179 (Very bad Hazardous)
The highest PM10 values usually occur in month: 161 (January 2019).
The lowest value of particulate matter PM10 pollution in Wawuli is usually recorded in: August (55).
What is the current level of PM2.5 in Wawuli? (particulate matter (PM2.5) dust)
Today's PM2.5 level is:
35 (Unhealthy for Sensitive Groups)
For comparison, the highest level of PM2.5 in Wawuli in the last 7 days was: 56 (Friday, May 27, 2022) and the lowest: 56 (Friday, May 27, 2022).
The highest PM2.5 values were recorded: 125 (February 2019).
The lowest level of particulate matter PM2.5 pollution occurs in month: August (25).
How is the O3 level today in Wawuli? (ozone (O3))
0 (Good)
How high is the level of NO2? (nitrogen dioxide (NO2))
0 (Good)
What is the level of SO2 pollution? (sulfur dioxide (SO2))
0 (Good)
Current data Friday, May 27, 2022, 12:00 PM
PM10 179 (Very bad Hazardous)
PM2,5 35 (Unhealthy for Sensitive Groups)
O3 0 (Good)
NO2 0 (Good)
SO2 0 (Good)
Data on air pollution from recent days in Wawuli
index
2022-05-27
pm10
56
Unhealthy for Sensitive Groups
pm25
56
Unhealthy
o3
0
Good
no2
0
Good
so2
0
Good
data source »
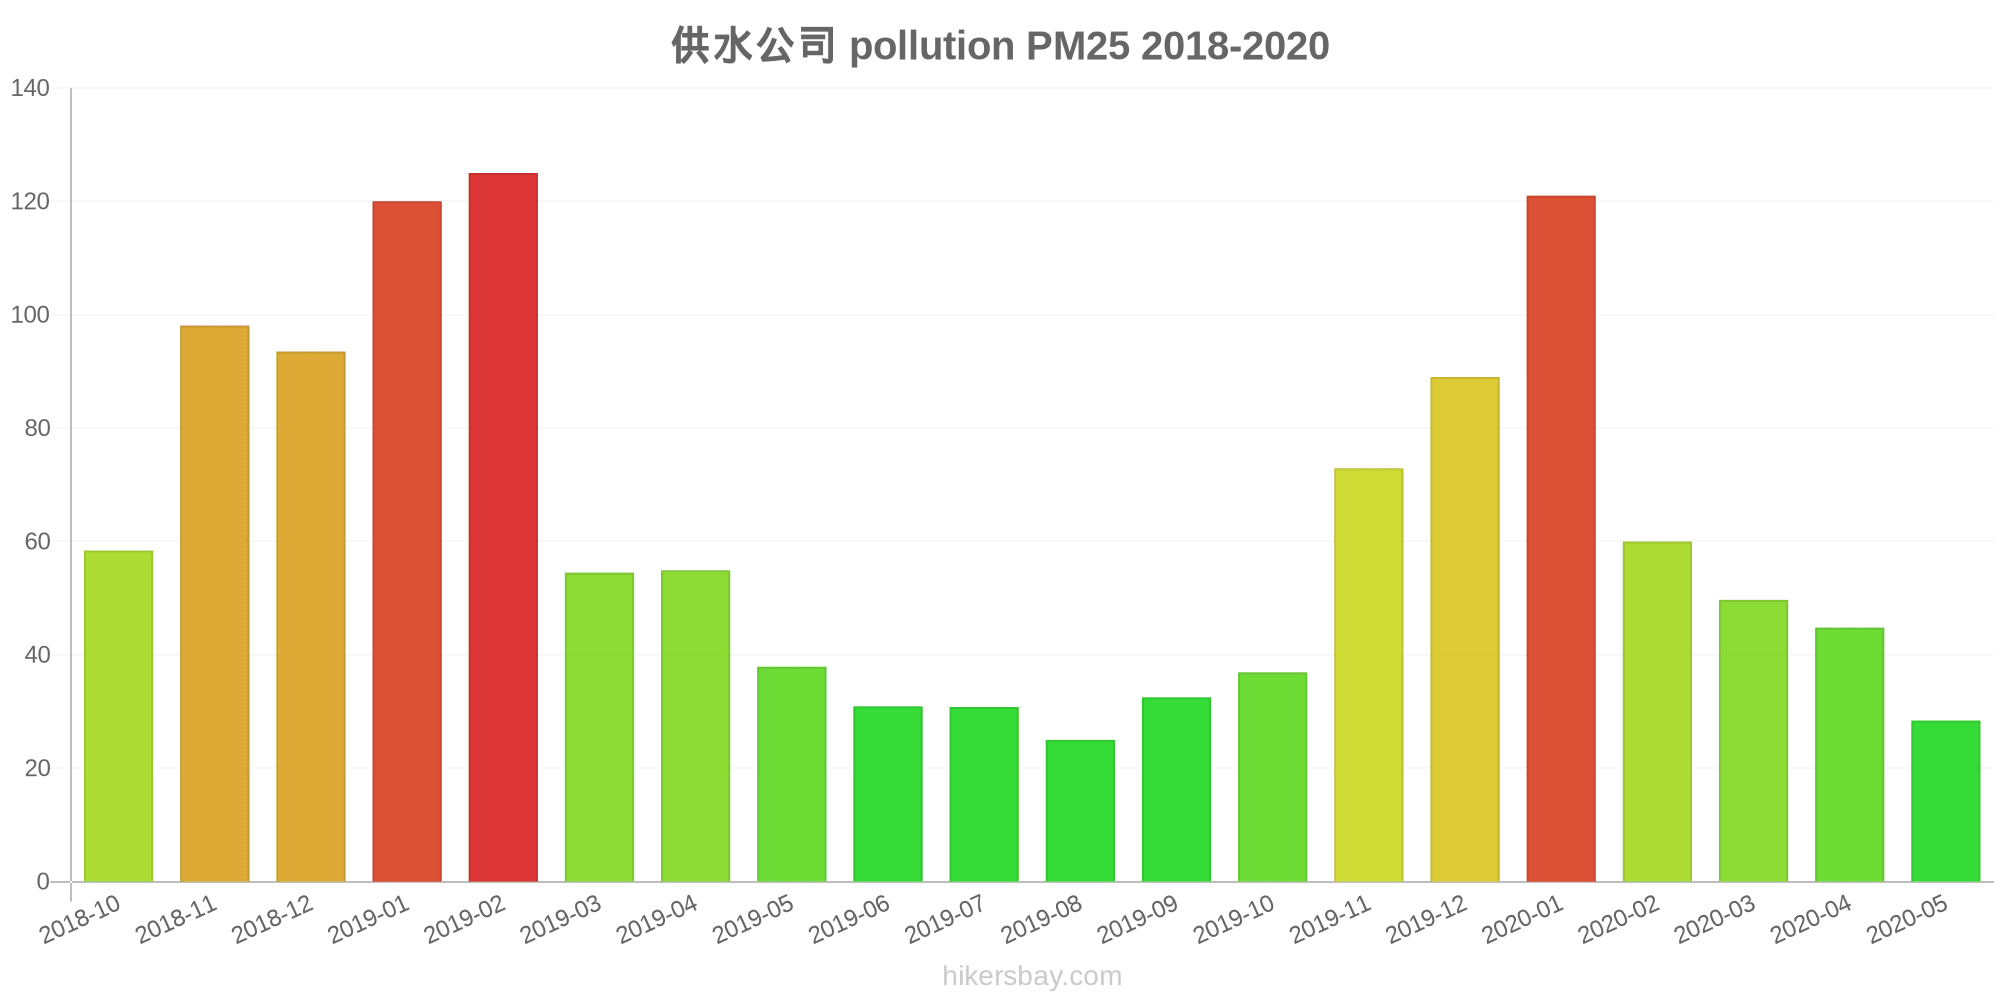
Air pollution in Wawuli from October 2018 to May 2020

index
2020-05
2020-04
2020-03
2020-02
2020-01
2019-12
2019-11
2019-10
2019-09
2019-08
2019-07
2019-06
2019-05
2019-04
2019-03
2019-02
2019-01
2018-12
2018-11
2018-10
pm25
28 (Moderate)
45 (Unhealthy for Sensitive Groups)
50 (Unhealthy for Sensitive Groups)
60 (Unhealthy)
121 (Very bad Hazardous)
89 (Very Unhealthy)
73 (Unhealthy)
37 (Unhealthy for Sensitive Groups)
33 (Moderate)
25 (Moderate)
31 (Moderate)
31 (Moderate)
38 (Unhealthy for Sensitive Groups)
55 (Unhealthy for Sensitive Groups)
55 (Unhealthy for Sensitive Groups)
125 (Very bad Hazardous)
120 (Very bad Hazardous)
94 (Very Unhealthy)
98 (Very Unhealthy)
58 (Unhealthy)
co
513 (Good)
644 (Good)
795 (Good)
886 (Good)
1 (Good)
1 (Good)
1 (Good)
964 (Good)
835 (Good)
628 (Good)
662 (Good)
573 (Good)
600 (Good)
864 (Good)
833 (Good)
1 (Good)
1 (Good)
1 (Good)
1 (Good)
999 (Good)
no2
27 (Good)
46 (Moderate)
40 (Moderate)
20 (Good)
47 (Moderate)
47 (Moderate)
53 (Moderate)
47 (Moderate)
37 (Good)
35 (Good)
36 (Good)
36 (Good)
39 (Good)
44 (Moderate)
48 (Moderate)
40 (Moderate)
65 (Moderate)
61 (Moderate)
65 (Moderate)
69 (Moderate)
o3
160 (Unhealthy)
145 (Unhealthy for Sensitive Groups)
111 (Moderate)
92 (Moderate)
70 (Good)
65 (Good)
87 (Moderate)
123 (Unhealthy for Sensitive Groups)
185 (Very Unhealthy)
172 (Unhealthy)
219 (Very Unhealthy)
211 (Very Unhealthy)
173 (Unhealthy)
138 (Unhealthy for Sensitive Groups)
116 (Moderate)
90 (Moderate)
53 (Good)
41 (Good)
72 (Moderate)
101 (Moderate)
pm10
79 (Unhealthy for Sensitive Groups)
97 (Unhealthy)
101 (Unhealthy)
77 (Unhealthy for Sensitive Groups)
134 (Very Unhealthy)
112 (Very Unhealthy)
128 (Very Unhealthy)
91 (Unhealthy)
69 (Unhealthy for Sensitive Groups)
55 (Unhealthy for Sensitive Groups)
72 (Unhealthy for Sensitive Groups)
89 (Unhealthy)
112 (Very Unhealthy)
118 (Very Unhealthy)
115 (Very Unhealthy)
147 (Very Unhealthy)
161 (Very bad Hazardous)
150 (Very bad Hazardous)
156 (Very bad Hazardous)
110 (Very Unhealthy)
so2
5.9 (Good)
10 (Good)
9.6 (Good)
7 (Good)
10 (Good)
13 (Good)
12 (Good)
8.4 (Good)
8.2 (Good)
5.7 (Good)
3.6 (Good)
5.5 (Good)
9.2 (Good)
8.2 (Good)
9.5 (Good)
12 (Good)
17 (Good)
20 (Good)
17 (Good)
19 (Good)
data source »
供水公司
Friday, May 27, 2022, 12:00 PM
PM10 179 (Very bad Hazardous)
particulate matter (PM10) suspended dust
PM2,5 35 (Unhealthy for Sensitive Groups)
particulate matter (PM2.5) dust
O3 0.04 (Good)
ozone (O3)
NO2 0 (Good)
nitrogen dioxide (NO2)
SO2 0 (Good)
sulfur dioxide (SO2)
供水公司
index
2022-05-27
pm10
56
pm25
56
o3
0.03
no2
0
so2
0
供水公司
2018-10 2020-05

index
2020-05
2020-04
2020-03
2020-02
2020-01
2019-12
2019-11
2019-10
2019-09
2019-08
2019-07
2019-06
2019-05
2019-04
2019-03
2019-02
2019-01
2018-12
2018-11
2018-10
pm25
28
45
50
60
121
89
73
37
33
25
31
31
38
55
55
125
120
94
98
58
co
513
644
795
886
1
1
1
964
835
628
662
573
600
864
833
1
1
1
1
999
no2
27
46
40
20
47
47
53
47
37
35
36
36
39
44
48
40
65
61
65
69
o3
160
145
111
92
70
65
87
123
185
172
219
211
173
138
116
90
53
41
72
101
pm10
79
97
101
77
134
112
128
91
69
55
72
89
112
118
115
147
161
150
156
110
so2
5.9
10
9.6
7
10
13
12
8.4
8.2
5.7
3.6
5.5
9.2
8.2
9.5
12
17
20
17
19
* Pollution data source:
https://openaq.org
(ChinaAQIData)
The data is licensed under CC-By 4.0
PM10 179 (Very bad Hazardous)
PM2,5 35 (Unhealthy for Sensitive Groups)
O3 0 (Good)
NO2 0 (Good)
SO2 0 (Good)
Data on air pollution from recent days in Wawuli
| index | 2022-05-27 |
|---|---|
| pm10 | 56 Unhealthy for Sensitive Groups |
| pm25 | 56 Unhealthy |
| o3 | 0 Good |
| no2 | 0 Good |
| so2 | 0 Good |

| index | 2020-05 | 2020-04 | 2020-03 | 2020-02 | 2020-01 | 2019-12 | 2019-11 | 2019-10 | 2019-09 | 2019-08 | 2019-07 | 2019-06 | 2019-05 | 2019-04 | 2019-03 | 2019-02 | 2019-01 | 2018-12 | 2018-11 | 2018-10 |
|---|---|---|---|---|---|---|---|---|---|---|---|---|---|---|---|---|---|---|---|---|
| pm25 | 28 (Moderate) | 45 (Unhealthy for Sensitive Groups) | 50 (Unhealthy for Sensitive Groups) | 60 (Unhealthy) | 121 (Very bad Hazardous) | 89 (Very Unhealthy) | 73 (Unhealthy) | 37 (Unhealthy for Sensitive Groups) | 33 (Moderate) | 25 (Moderate) | 31 (Moderate) | 31 (Moderate) | 38 (Unhealthy for Sensitive Groups) | 55 (Unhealthy for Sensitive Groups) | 55 (Unhealthy for Sensitive Groups) | 125 (Very bad Hazardous) | 120 (Very bad Hazardous) | 94 (Very Unhealthy) | 98 (Very Unhealthy) | 58 (Unhealthy) |
| co | 513 (Good) | 644 (Good) | 795 (Good) | 886 (Good) | 1 (Good) | 1 (Good) | 1 (Good) | 964 (Good) | 835 (Good) | 628 (Good) | 662 (Good) | 573 (Good) | 600 (Good) | 864 (Good) | 833 (Good) | 1 (Good) | 1 (Good) | 1 (Good) | 1 (Good) | 999 (Good) |
| no2 | 27 (Good) | 46 (Moderate) | 40 (Moderate) | 20 (Good) | 47 (Moderate) | 47 (Moderate) | 53 (Moderate) | 47 (Moderate) | 37 (Good) | 35 (Good) | 36 (Good) | 36 (Good) | 39 (Good) | 44 (Moderate) | 48 (Moderate) | 40 (Moderate) | 65 (Moderate) | 61 (Moderate) | 65 (Moderate) | 69 (Moderate) |
| o3 | 160 (Unhealthy) | 145 (Unhealthy for Sensitive Groups) | 111 (Moderate) | 92 (Moderate) | 70 (Good) | 65 (Good) | 87 (Moderate) | 123 (Unhealthy for Sensitive Groups) | 185 (Very Unhealthy) | 172 (Unhealthy) | 219 (Very Unhealthy) | 211 (Very Unhealthy) | 173 (Unhealthy) | 138 (Unhealthy for Sensitive Groups) | 116 (Moderate) | 90 (Moderate) | 53 (Good) | 41 (Good) | 72 (Moderate) | 101 (Moderate) |
| pm10 | 79 (Unhealthy for Sensitive Groups) | 97 (Unhealthy) | 101 (Unhealthy) | 77 (Unhealthy for Sensitive Groups) | 134 (Very Unhealthy) | 112 (Very Unhealthy) | 128 (Very Unhealthy) | 91 (Unhealthy) | 69 (Unhealthy for Sensitive Groups) | 55 (Unhealthy for Sensitive Groups) | 72 (Unhealthy for Sensitive Groups) | 89 (Unhealthy) | 112 (Very Unhealthy) | 118 (Very Unhealthy) | 115 (Very Unhealthy) | 147 (Very Unhealthy) | 161 (Very bad Hazardous) | 150 (Very bad Hazardous) | 156 (Very bad Hazardous) | 110 (Very Unhealthy) |
| so2 | 5.9 (Good) | 10 (Good) | 9.6 (Good) | 7 (Good) | 10 (Good) | 13 (Good) | 12 (Good) | 8.4 (Good) | 8.2 (Good) | 5.7 (Good) | 3.6 (Good) | 5.5 (Good) | 9.2 (Good) | 8.2 (Good) | 9.5 (Good) | 12 (Good) | 17 (Good) | 20 (Good) | 17 (Good) | 19 (Good) |
PM10 179 (Very bad Hazardous)
particulate matter (PM10) suspended dustPM2,5 35 (Unhealthy for Sensitive Groups)
particulate matter (PM2.5) dustO3 0.04 (Good)
ozone (O3)NO2 0 (Good)
nitrogen dioxide (NO2)SO2 0 (Good)
sulfur dioxide (SO2)供水公司
| index | 2022-05-27 |
|---|---|
| pm10 | 56 |
| pm25 | 56 |
| o3 | 0.03 |
| no2 | 0 |
| so2 | 0 |
供水公司
| index | 2020-05 | 2020-04 | 2020-03 | 2020-02 | 2020-01 | 2019-12 | 2019-11 | 2019-10 | 2019-09 | 2019-08 | 2019-07 | 2019-06 | 2019-05 | 2019-04 | 2019-03 | 2019-02 | 2019-01 | 2018-12 | 2018-11 | 2018-10 |
|---|---|---|---|---|---|---|---|---|---|---|---|---|---|---|---|---|---|---|---|---|
| pm25 | 28 | 45 | 50 | 60 | 121 | 89 | 73 | 37 | 33 | 25 | 31 | 31 | 38 | 55 | 55 | 125 | 120 | 94 | 98 | 58 |
| co | 513 | 644 | 795 | 886 | 1 | 1 | 1 | 964 | 835 | 628 | 662 | 573 | 600 | 864 | 833 | 1 | 1 | 1 | 1 | 999 |
| no2 | 27 | 46 | 40 | 20 | 47 | 47 | 53 | 47 | 37 | 35 | 36 | 36 | 39 | 44 | 48 | 40 | 65 | 61 | 65 | 69 |
| o3 | 160 | 145 | 111 | 92 | 70 | 65 | 87 | 123 | 185 | 172 | 219 | 211 | 173 | 138 | 116 | 90 | 53 | 41 | 72 | 101 |
| pm10 | 79 | 97 | 101 | 77 | 134 | 112 | 128 | 91 | 69 | 55 | 72 | 89 | 112 | 118 | 115 | 147 | 161 | 150 | 156 | 110 |
| so2 | 5.9 | 10 | 9.6 | 7 | 10 | 13 | 12 | 8.4 | 8.2 | 5.7 | 3.6 | 5.5 | 9.2 | 8.2 | 9.5 | 12 | 17 | 20 | 17 | 19 |