Air Pollution in Qilihe: Real-time Air Quality Index and smog alert.
Pollution and air quality forecast for Qilihe. Today is Tuesday, June 2, 2026. The following air pollution values have been recorded for Qilihe:- particulate matter (PM10) suspended dust - 179 (Very bad Hazardous)
- particulate matter (PM2.5) dust - 35 (Unhealthy for Sensitive Groups)
- ozone (O3) - 0 (Good)
- nitrogen dioxide (NO2) - 0 (Good)
- sulfur dioxide (SO2) - 0 (Good)

What is the air quality in Qilihe today? Is the air polluted in Qilihe?. Is there smog?
What is the level of PM10 today in Qilihe? (particulate matter (PM10) suspended dust)
The current level of particulate matter PM10 in Qilihe is:
179 (Very bad Hazardous)
The highest PM10 values usually occur in month: 166 (January 2019).
The lowest value of particulate matter PM10 pollution in Qilihe is usually recorded in: August (58).
What is the current level of PM2.5 in Qilihe? (particulate matter (PM2.5) dust)
Today's PM2.5 level is:
35 (Unhealthy for Sensitive Groups)
For comparison, the highest level of PM2.5 in Qilihe in the last 7 days was: 56 (Friday, May 27, 2022) and the lowest: 56 (Friday, May 27, 2022).
The highest PM2.5 values were recorded: 120 (January 2020).
The lowest level of particulate matter PM2.5 pollution occurs in month: August (25).
How is the O3 level today in Qilihe? (ozone (O3))
0 (Good)
How high is the level of NO2? (nitrogen dioxide (NO2))
0 (Good)
What is the level of SO2 pollution? (sulfur dioxide (SO2))
0 (Good)
Current data Friday, May 27, 2022, 12:00 PM
PM10 179 (Very bad Hazardous)
PM2,5 35 (Unhealthy for Sensitive Groups)
O3 0 (Good)
NO2 0 (Good)
SO2 0 (Good)
Data on air pollution from recent days in Qilihe
index
2022-05-27
pm10
56
Unhealthy for Sensitive Groups
pm25
56
Unhealthy
o3
0
Good
no2
0
Good
so2
0
Good
data source »
Air pollution in Qilihe from October 2018 to May 2020

index
2020-05
2020-04
2020-03
2020-02
2020-01
2019-12
2019-11
2019-10
2019-09
2019-08
2019-07
2019-06
2019-05
2019-04
2019-03
2019-02
2019-01
2018-12
2018-11
2018-10
pm25
26 (Moderate)
43 (Unhealthy for Sensitive Groups)
47 (Unhealthy for Sensitive Groups)
58 (Unhealthy)
120 (Very bad Hazardous)
87 (Very Unhealthy)
72 (Unhealthy)
36 (Unhealthy for Sensitive Groups)
31 (Moderate)
25 (Moderate)
29 (Moderate)
30 (Moderate)
40 (Unhealthy for Sensitive Groups)
54 (Unhealthy for Sensitive Groups)
55 (Unhealthy for Sensitive Groups)
120 (Very bad Hazardous)
118 (Very bad Hazardous)
94 (Very Unhealthy)
99 (Very Unhealthy)
52 (Unhealthy for Sensitive Groups)
co
670 (Good)
635 (Good)
663 (Good)
800 (Good)
1 (Good)
1 (Good)
1 (Good)
877 (Good)
918 (Good)
813 (Good)
802 (Good)
673 (Good)
615 (Good)
829 (Good)
714 (Good)
452 (Good)
1 (Good)
1 (Good)
1 (Good)
861 (Good)
no2
26 (Good)
40 (Moderate)
34 (Good)
17 (Good)
48 (Moderate)
52 (Moderate)
57 (Moderate)
49 (Moderate)
38 (Good)
33 (Good)
39 (Good)
37 (Good)
36 (Good)
41 (Moderate)
49 (Moderate)
48 (Moderate)
64 (Moderate)
58 (Moderate)
62 (Moderate)
64 (Moderate)
o3
156 (Unhealthy)
139 (Unhealthy for Sensitive Groups)
117 (Moderate)
104 (Moderate)
74 (Moderate)
58 (Good)
80 (Moderate)
110 (Moderate)
169 (Unhealthy)
165 (Unhealthy)
184 (Very Unhealthy)
193 (Very Unhealthy)
162 (Unhealthy)
131 (Unhealthy for Sensitive Groups)
112 (Moderate)
87 (Moderate)
53 (Good)
40 (Good)
71 (Moderate)
100 (Moderate)
pm10
78 (Unhealthy for Sensitive Groups)
96 (Unhealthy)
95 (Unhealthy)
73 (Unhealthy for Sensitive Groups)
128 (Very Unhealthy)
105 (Unhealthy)
122 (Very Unhealthy)
92 (Unhealthy)
71 (Unhealthy for Sensitive Groups)
58 (Unhealthy for Sensitive Groups)
69 (Unhealthy for Sensitive Groups)
85 (Unhealthy)
118 (Very Unhealthy)
115 (Very Unhealthy)
115 (Very Unhealthy)
152 (Very bad Hazardous)
166 (Very bad Hazardous)
152 (Very bad Hazardous)
160 (Very bad Hazardous)
108 (Unhealthy)
so2
6.9 (Good)
10 (Good)
8.7 (Good)
6.8 (Good)
10 (Good)
10 (Good)
10 (Good)
8.1 (Good)
7.9 (Good)
4.9 (Good)
4.7 (Good)
6.9 (Good)
9.9 (Good)
9.6 (Good)
10 (Good)
11 (Good)
17 (Good)
18 (Good)
16 (Good)
18 (Good)
data source »
四十七中
Friday, May 27, 2022, 12:00 PM
PM10 179 (Very bad Hazardous)
particulate matter (PM10) suspended dust
PM2,5 35 (Unhealthy for Sensitive Groups)
particulate matter (PM2.5) dust
O3 0.04 (Good)
ozone (O3)
NO2 0 (Good)
nitrogen dioxide (NO2)
SO2 0 (Good)
sulfur dioxide (SO2)
经开区管委
Friday, May 27, 2022, 12:00 PM
PM10 179 (Very bad Hazardous)
particulate matter (PM10) suspended dust
PM2,5 35 (Unhealthy for Sensitive Groups)
particulate matter (PM2.5) dust
O3 0.04 (Good)
ozone (O3)
NO2 0 (Good)
nitrogen dioxide (NO2)
SO2 0 (Good)
sulfur dioxide (SO2)
四十七中
index
2022-05-27
pm10
56
pm25
56
o3
0.03
no2
0
so2
0
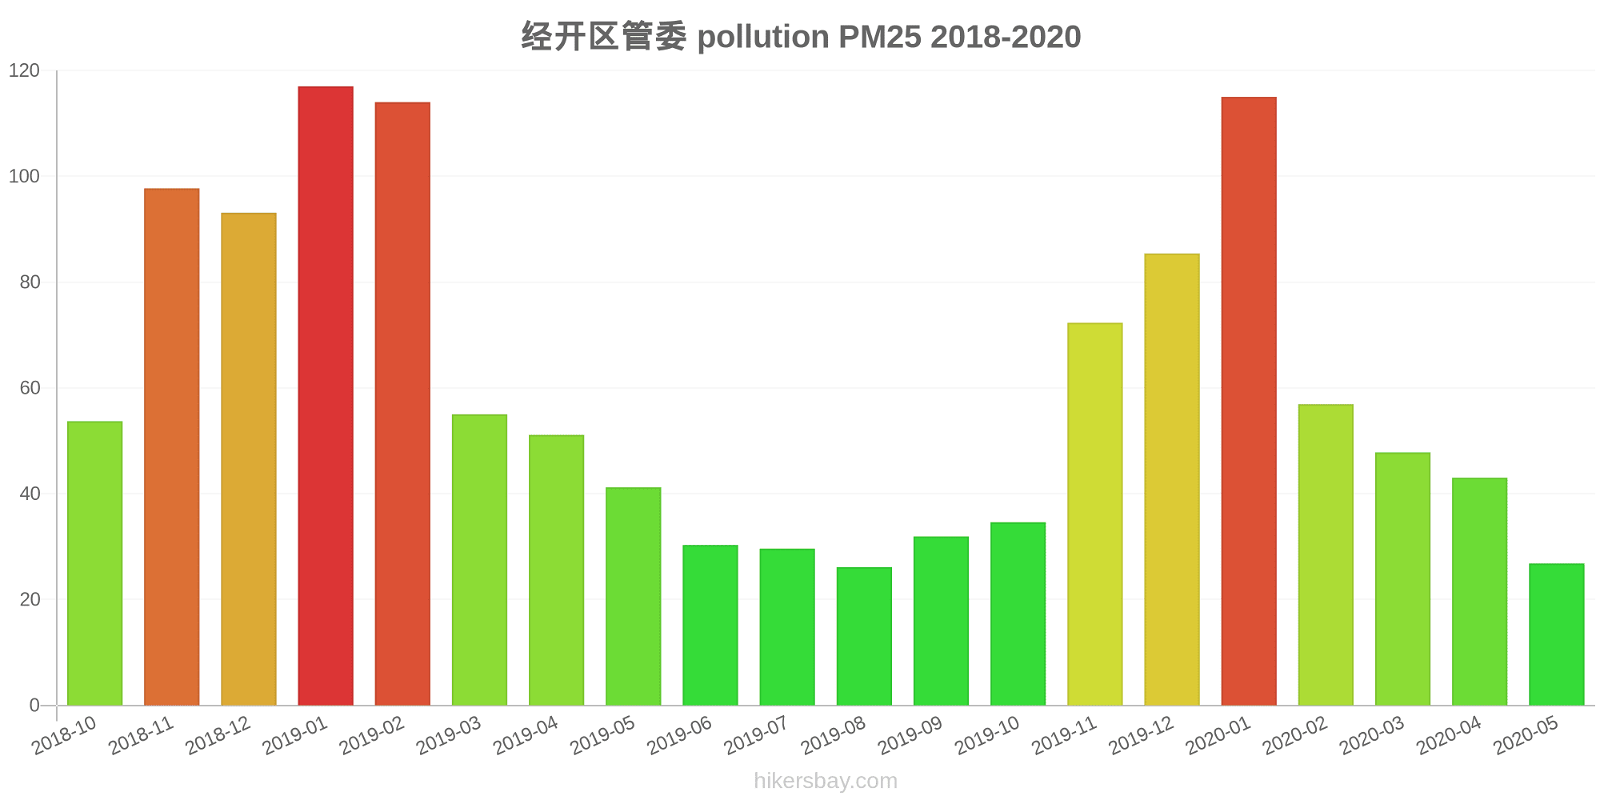
经开区管委
index
2022-05-27
pm10
56
pm25
56
o3
0.03
no2
0
so2
0
四十七中
2018-10 2020-05

index
2020-05
2020-04
2020-03
2020-02
2020-01
2019-12
2019-11
2019-10
2019-09
2019-08
2019-07
2019-06
2019-05
2019-04
2019-03
2019-02
2019-01
2018-12
2018-11
2018-10
pm25
26
43
47
59
124
89
73
38
31
24
29
29
40
58
54
125
119
94
100
50
co
619
659
702
880
1
1
1
924
981
877
793
677
657
895
807
903
1
1
1
825
no2
27
42
32
19
50
53
57
48
40
33
40
37
35
38
46
43
67
59
64
66
o3
160
136
113
107
76
57
76
105
165
168
190
195
167
131
105
95
53
41
72
101
pm10
73
90
90
72
126
103
119
87
67
53
67
77
109
112
106
147
161
149
157
105
so2
6.8
10
8.7
5.8
8.9
9.1
10
8.4
7.3
4.8
4.9
7.1
9.3
9
9.8
11
17
18
16
18
经开区管委
2018-10 2020-05
index
2020-05
2020-04
2020-03
2020-02
2020-01
2019-12
2019-11
2019-10
2019-09
2019-08
2019-07
2019-06
2019-05
2019-04
2019-03
2019-02
2019-01
2018-12
2018-11
2018-10
pm25
27
43
48
57
115
85
72
35
32
26
30
30
41
51
55
114
117
93
98
54
co
720
611
623
719
1
1
1
830
854
749
811
668
572
763
620
1
1
1
1
897
no2
25
38
35
15
46
51
57
50
36
32
39
37
36
44
53
52
62
56
59
63
o3
151
142
120
100
72
59
84
114
173
161
178
191
156
130
118
78
52
39
70
99
pm10
83
103
99
74
129
107
124
98
75
63
72
92
126
118
124
156
170
154
163
110
so2
7
10
8.7
7.8
11
11
11
7.8
8.5
5
4.5
6.6
10
10
11
10
16
19
16
18
* Pollution data source:
https://openaq.org
(ChinaAQIData)
The data is licensed under CC-By 4.0
PM10 179 (Very bad Hazardous)
PM2,5 35 (Unhealthy for Sensitive Groups)
O3 0 (Good)
NO2 0 (Good)
SO2 0 (Good)
Data on air pollution from recent days in Qilihe
| index | 2022-05-27 |
|---|---|
| pm10 | 56 Unhealthy for Sensitive Groups |
| pm25 | 56 Unhealthy |
| o3 | 0 Good |
| no2 | 0 Good |
| so2 | 0 Good |
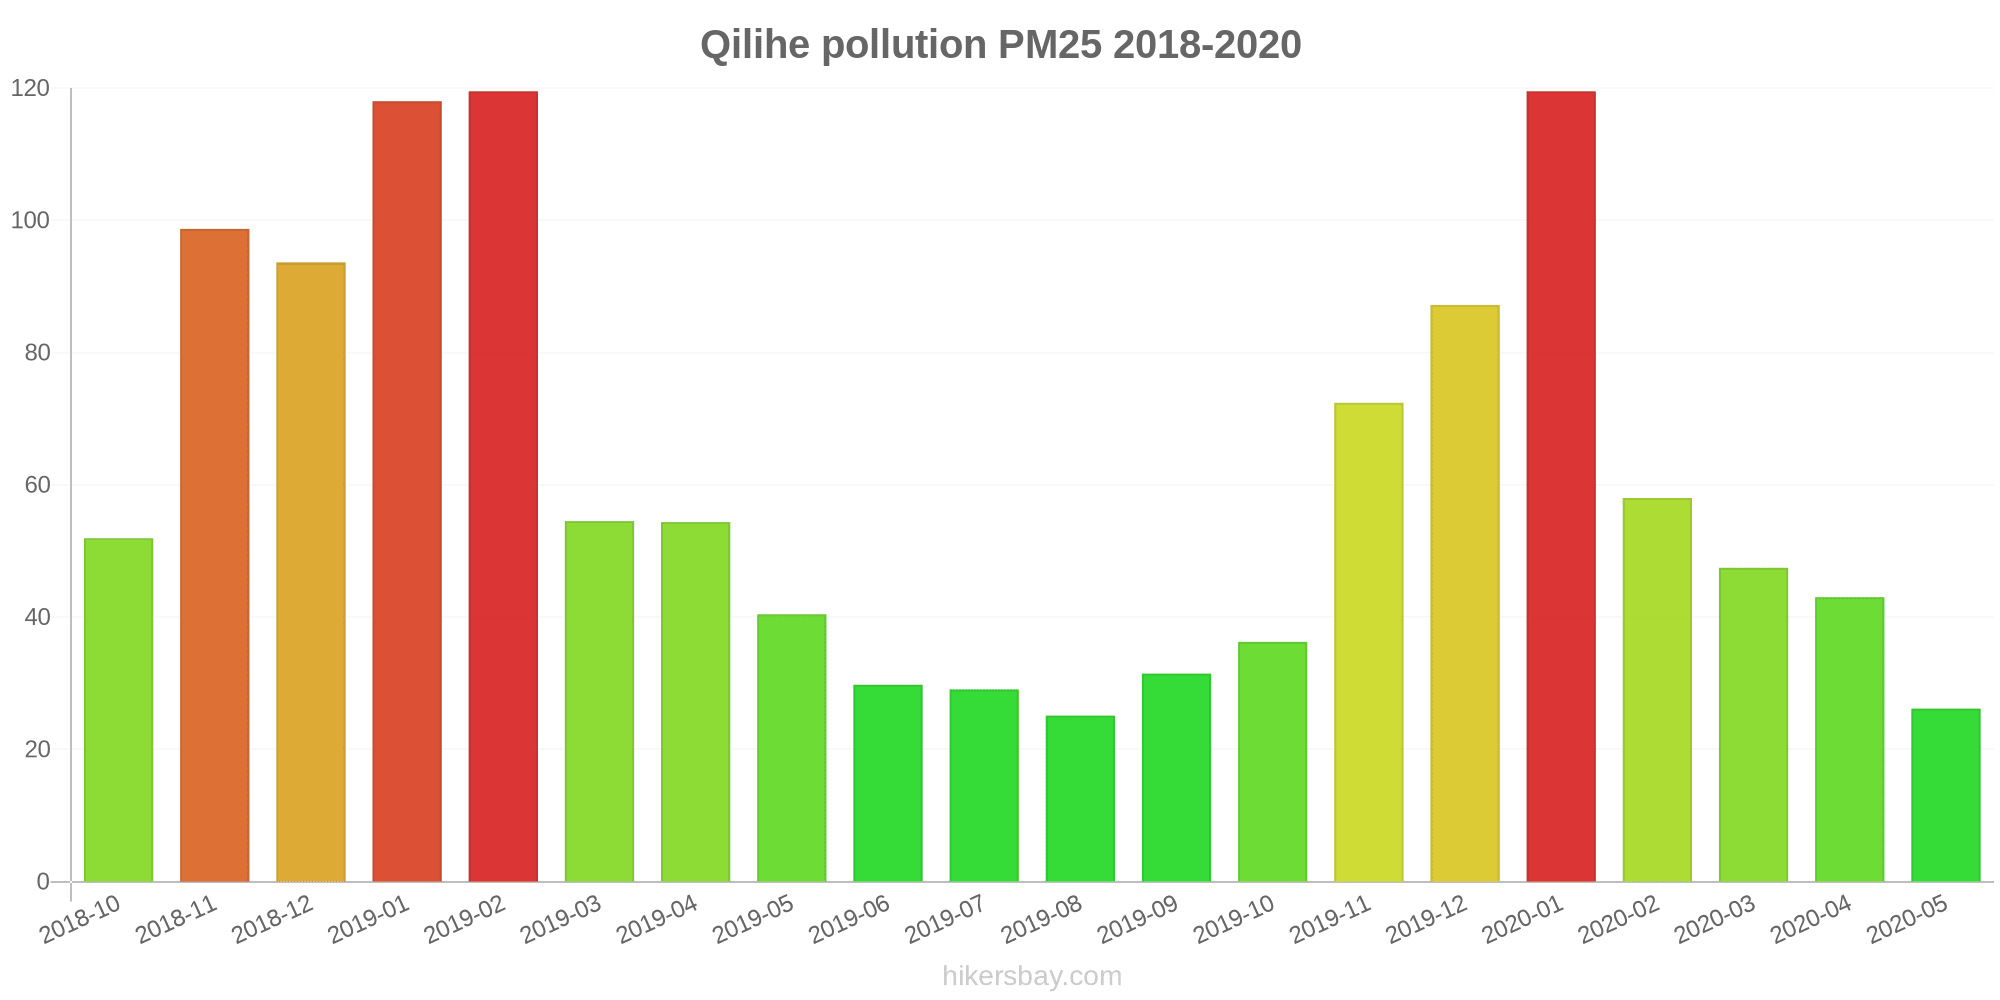
| index | 2020-05 | 2020-04 | 2020-03 | 2020-02 | 2020-01 | 2019-12 | 2019-11 | 2019-10 | 2019-09 | 2019-08 | 2019-07 | 2019-06 | 2019-05 | 2019-04 | 2019-03 | 2019-02 | 2019-01 | 2018-12 | 2018-11 | 2018-10 |
|---|---|---|---|---|---|---|---|---|---|---|---|---|---|---|---|---|---|---|---|---|
| pm25 | 26 (Moderate) | 43 (Unhealthy for Sensitive Groups) | 47 (Unhealthy for Sensitive Groups) | 58 (Unhealthy) | 120 (Very bad Hazardous) | 87 (Very Unhealthy) | 72 (Unhealthy) | 36 (Unhealthy for Sensitive Groups) | 31 (Moderate) | 25 (Moderate) | 29 (Moderate) | 30 (Moderate) | 40 (Unhealthy for Sensitive Groups) | 54 (Unhealthy for Sensitive Groups) | 55 (Unhealthy for Sensitive Groups) | 120 (Very bad Hazardous) | 118 (Very bad Hazardous) | 94 (Very Unhealthy) | 99 (Very Unhealthy) | 52 (Unhealthy for Sensitive Groups) |
| co | 670 (Good) | 635 (Good) | 663 (Good) | 800 (Good) | 1 (Good) | 1 (Good) | 1 (Good) | 877 (Good) | 918 (Good) | 813 (Good) | 802 (Good) | 673 (Good) | 615 (Good) | 829 (Good) | 714 (Good) | 452 (Good) | 1 (Good) | 1 (Good) | 1 (Good) | 861 (Good) |
| no2 | 26 (Good) | 40 (Moderate) | 34 (Good) | 17 (Good) | 48 (Moderate) | 52 (Moderate) | 57 (Moderate) | 49 (Moderate) | 38 (Good) | 33 (Good) | 39 (Good) | 37 (Good) | 36 (Good) | 41 (Moderate) | 49 (Moderate) | 48 (Moderate) | 64 (Moderate) | 58 (Moderate) | 62 (Moderate) | 64 (Moderate) |
| o3 | 156 (Unhealthy) | 139 (Unhealthy for Sensitive Groups) | 117 (Moderate) | 104 (Moderate) | 74 (Moderate) | 58 (Good) | 80 (Moderate) | 110 (Moderate) | 169 (Unhealthy) | 165 (Unhealthy) | 184 (Very Unhealthy) | 193 (Very Unhealthy) | 162 (Unhealthy) | 131 (Unhealthy for Sensitive Groups) | 112 (Moderate) | 87 (Moderate) | 53 (Good) | 40 (Good) | 71 (Moderate) | 100 (Moderate) |
| pm10 | 78 (Unhealthy for Sensitive Groups) | 96 (Unhealthy) | 95 (Unhealthy) | 73 (Unhealthy for Sensitive Groups) | 128 (Very Unhealthy) | 105 (Unhealthy) | 122 (Very Unhealthy) | 92 (Unhealthy) | 71 (Unhealthy for Sensitive Groups) | 58 (Unhealthy for Sensitive Groups) | 69 (Unhealthy for Sensitive Groups) | 85 (Unhealthy) | 118 (Very Unhealthy) | 115 (Very Unhealthy) | 115 (Very Unhealthy) | 152 (Very bad Hazardous) | 166 (Very bad Hazardous) | 152 (Very bad Hazardous) | 160 (Very bad Hazardous) | 108 (Unhealthy) |
| so2 | 6.9 (Good) | 10 (Good) | 8.7 (Good) | 6.8 (Good) | 10 (Good) | 10 (Good) | 10 (Good) | 8.1 (Good) | 7.9 (Good) | 4.9 (Good) | 4.7 (Good) | 6.9 (Good) | 9.9 (Good) | 9.6 (Good) | 10 (Good) | 11 (Good) | 17 (Good) | 18 (Good) | 16 (Good) | 18 (Good) |
PM10 179 (Very bad Hazardous)
particulate matter (PM10) suspended dustPM2,5 35 (Unhealthy for Sensitive Groups)
particulate matter (PM2.5) dustO3 0.04 (Good)
ozone (O3)NO2 0 (Good)
nitrogen dioxide (NO2)SO2 0 (Good)
sulfur dioxide (SO2)PM10 179 (Very bad Hazardous)
particulate matter (PM10) suspended dustPM2,5 35 (Unhealthy for Sensitive Groups)
particulate matter (PM2.5) dustO3 0.04 (Good)
ozone (O3)NO2 0 (Good)
nitrogen dioxide (NO2)SO2 0 (Good)
sulfur dioxide (SO2)四十七中
| index | 2022-05-27 |
|---|---|
| pm10 | 56 |
| pm25 | 56 |
| o3 | 0.03 |
| no2 | 0 |
| so2 | 0 |
经开区管委
| index | 2022-05-27 |
|---|---|
| pm10 | 56 |
| pm25 | 56 |
| o3 | 0.03 |
| no2 | 0 |
| so2 | 0 |
四十七中
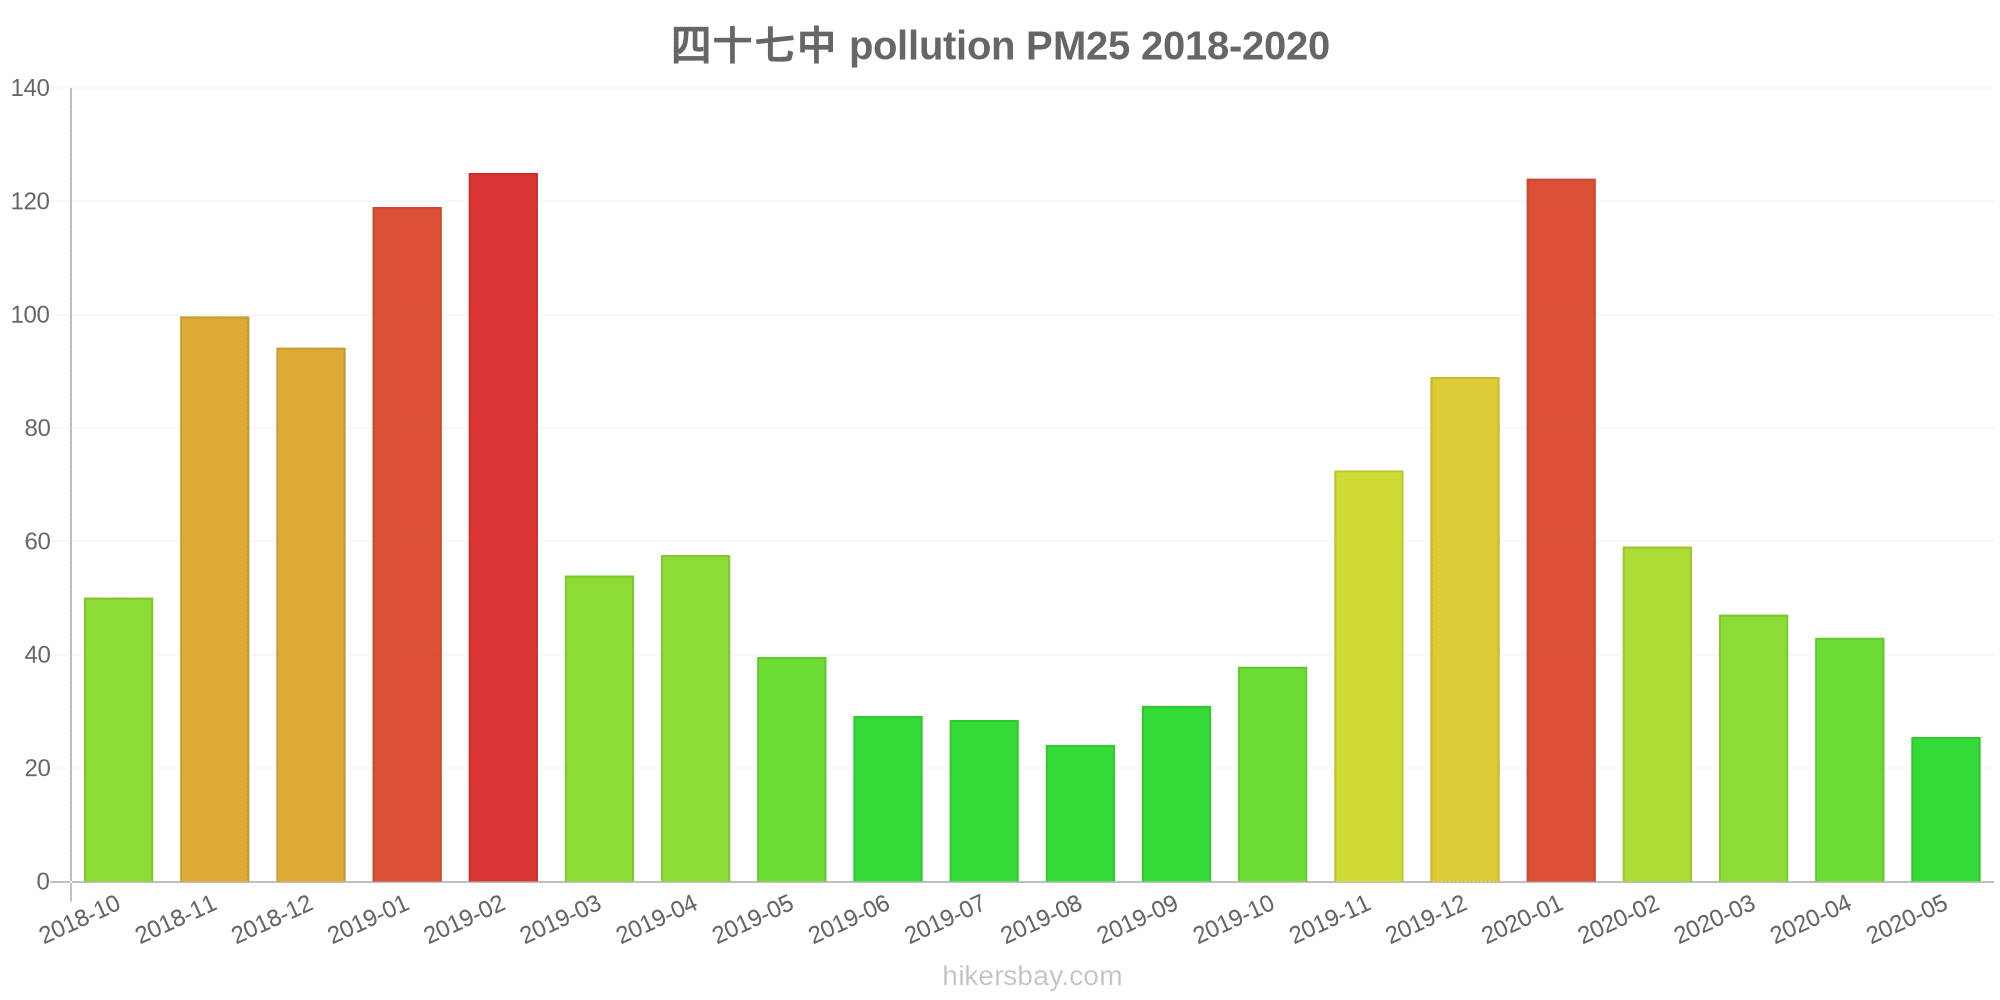
| index | 2020-05 | 2020-04 | 2020-03 | 2020-02 | 2020-01 | 2019-12 | 2019-11 | 2019-10 | 2019-09 | 2019-08 | 2019-07 | 2019-06 | 2019-05 | 2019-04 | 2019-03 | 2019-02 | 2019-01 | 2018-12 | 2018-11 | 2018-10 |
|---|---|---|---|---|---|---|---|---|---|---|---|---|---|---|---|---|---|---|---|---|
| pm25 | 26 | 43 | 47 | 59 | 124 | 89 | 73 | 38 | 31 | 24 | 29 | 29 | 40 | 58 | 54 | 125 | 119 | 94 | 100 | 50 |
| co | 619 | 659 | 702 | 880 | 1 | 1 | 1 | 924 | 981 | 877 | 793 | 677 | 657 | 895 | 807 | 903 | 1 | 1 | 1 | 825 |
| no2 | 27 | 42 | 32 | 19 | 50 | 53 | 57 | 48 | 40 | 33 | 40 | 37 | 35 | 38 | 46 | 43 | 67 | 59 | 64 | 66 |
| o3 | 160 | 136 | 113 | 107 | 76 | 57 | 76 | 105 | 165 | 168 | 190 | 195 | 167 | 131 | 105 | 95 | 53 | 41 | 72 | 101 |
| pm10 | 73 | 90 | 90 | 72 | 126 | 103 | 119 | 87 | 67 | 53 | 67 | 77 | 109 | 112 | 106 | 147 | 161 | 149 | 157 | 105 |
| so2 | 6.8 | 10 | 8.7 | 5.8 | 8.9 | 9.1 | 10 | 8.4 | 7.3 | 4.8 | 4.9 | 7.1 | 9.3 | 9 | 9.8 | 11 | 17 | 18 | 16 | 18 |
经开区管委

| index | 2020-05 | 2020-04 | 2020-03 | 2020-02 | 2020-01 | 2019-12 | 2019-11 | 2019-10 | 2019-09 | 2019-08 | 2019-07 | 2019-06 | 2019-05 | 2019-04 | 2019-03 | 2019-02 | 2019-01 | 2018-12 | 2018-11 | 2018-10 |
|---|---|---|---|---|---|---|---|---|---|---|---|---|---|---|---|---|---|---|---|---|
| pm25 | 27 | 43 | 48 | 57 | 115 | 85 | 72 | 35 | 32 | 26 | 30 | 30 | 41 | 51 | 55 | 114 | 117 | 93 | 98 | 54 |
| co | 720 | 611 | 623 | 719 | 1 | 1 | 1 | 830 | 854 | 749 | 811 | 668 | 572 | 763 | 620 | 1 | 1 | 1 | 1 | 897 |
| no2 | 25 | 38 | 35 | 15 | 46 | 51 | 57 | 50 | 36 | 32 | 39 | 37 | 36 | 44 | 53 | 52 | 62 | 56 | 59 | 63 |
| o3 | 151 | 142 | 120 | 100 | 72 | 59 | 84 | 114 | 173 | 161 | 178 | 191 | 156 | 130 | 118 | 78 | 52 | 39 | 70 | 99 |
| pm10 | 83 | 103 | 99 | 74 | 129 | 107 | 124 | 98 | 75 | 63 | 72 | 92 | 126 | 118 | 124 | 156 | 170 | 154 | 163 | 110 |
| so2 | 7 | 10 | 8.7 | 7.8 | 11 | 11 | 11 | 7.8 | 8.5 | 5 | 4.5 | 6.6 | 10 | 10 | 11 | 10 | 16 | 19 | 16 | 18 |