Air Pollution in Dapolong: Real-time Air Quality Index and smog alert.
Pollution and air quality forecast for Dapolong. Today is Tuesday, June 16, 2026. The following air pollution values have been recorded for Dapolong:- particulate matter (PM10) suspended dust - 179 (Very bad Hazardous)
- particulate matter (PM2.5) dust - 35 (Unhealthy for Sensitive Groups)
- ozone (O3) - 0 (Good)
- nitrogen dioxide (NO2) - 0 (Good)
- sulfur dioxide (SO2) - 0 (Good)

What is the air quality in Dapolong today? Is the air polluted in Dapolong?. Is there smog?
What is the level of PM10 today in Dapolong? (particulate matter (PM10) suspended dust)
The current level of particulate matter PM10 in Dapolong is:
179 (Very bad Hazardous)
The highest PM10 values usually occur in month: 100 (January 2019).
The lowest value of particulate matter PM10 pollution in Dapolong is usually recorded in: June (30).
What is the current level of PM2.5 in Dapolong? (particulate matter (PM2.5) dust)
Today's PM2.5 level is:
35 (Unhealthy for Sensitive Groups)
For comparison, the highest level of PM2.5 in Dapolong in the last 7 days was: 56 (Friday, May 27, 2022) and the lowest: 56 (Friday, May 27, 2022).
The highest PM2.5 values were recorded: 71 (January 2019).
The lowest level of particulate matter PM2.5 pollution occurs in month: July (16).
How is the O3 level today in Dapolong? (ozone (O3))
0 (Good)
How high is the level of NO2? (nitrogen dioxide (NO2))
0 (Good)
What is the level of SO2 pollution? (sulfur dioxide (SO2))
0 (Good)
Current data Friday, May 27, 2022, 12:00 PM
PM10 179 (Very bad Hazardous)
PM2,5 35 (Unhealthy for Sensitive Groups)
O3 0 (Good)
NO2 0 (Good)
SO2 0 (Good)
Data on air pollution from recent days in Dapolong
index
2022-05-27
pm10
56
Unhealthy for Sensitive Groups
pm25
56
Unhealthy
o3
0
Good
no2
0
Good
so2
0
Good
data source »
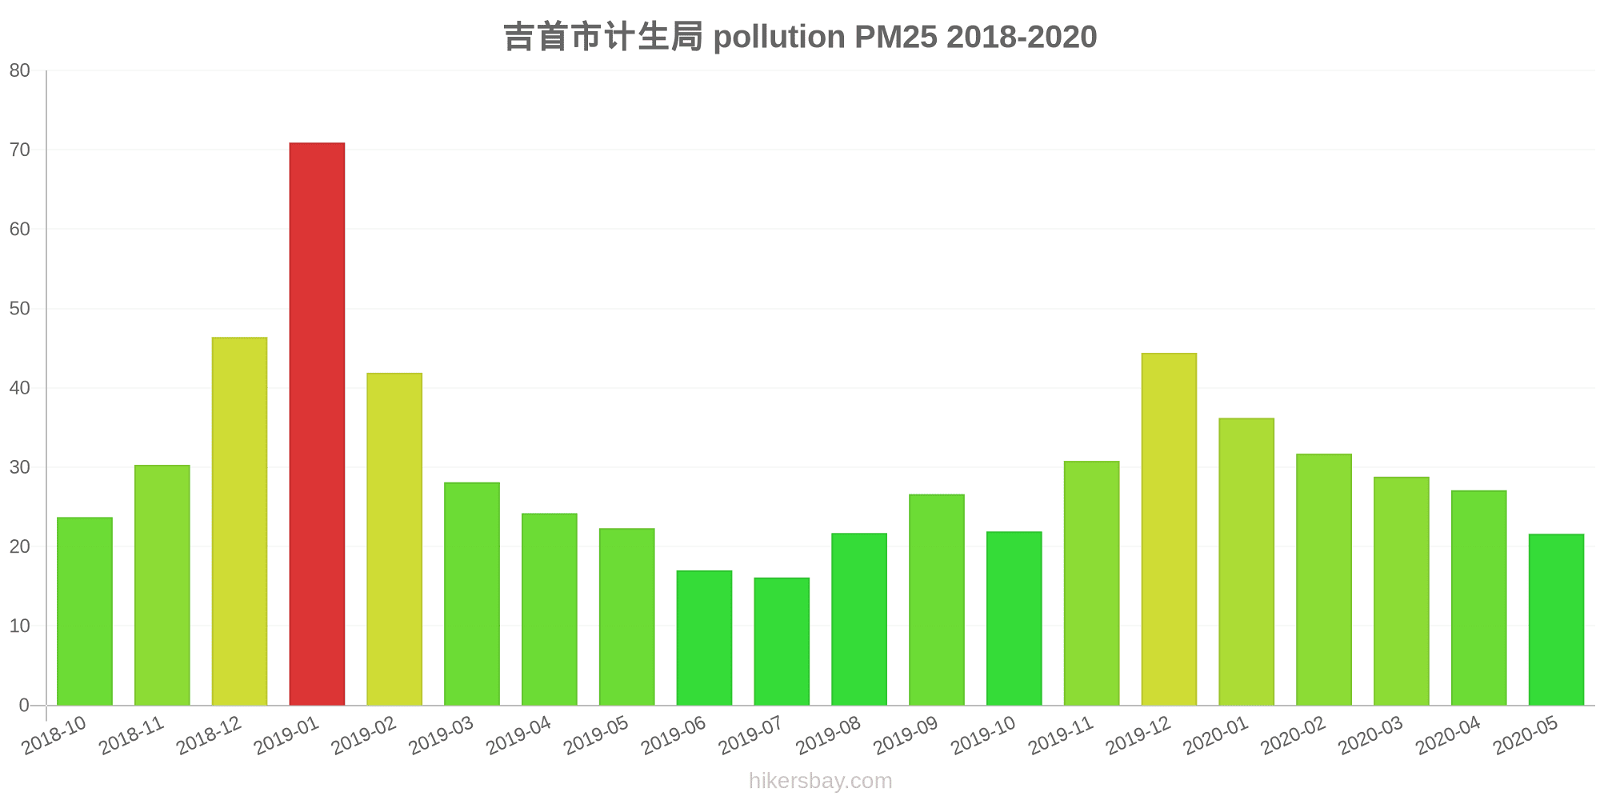
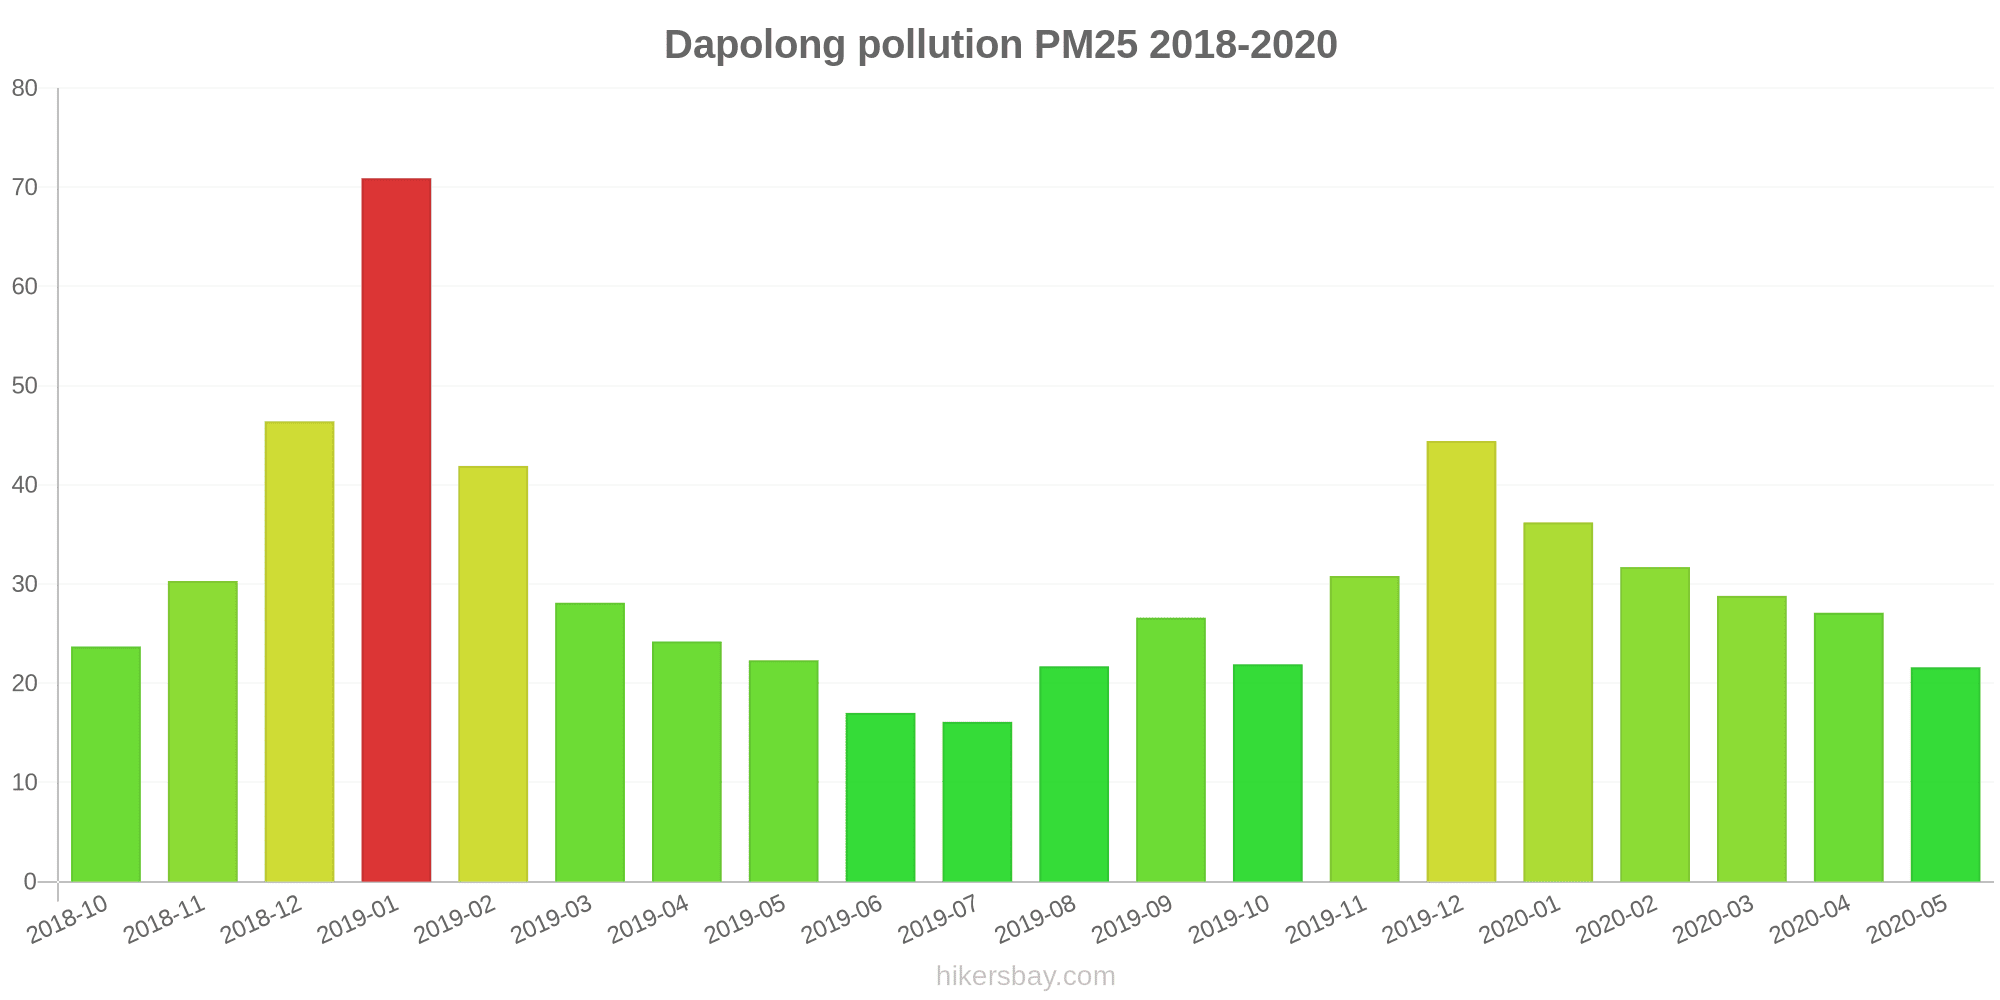
Air pollution in Dapolong from October 2018 to May 2020

index
2020-05
2020-04
2020-03
2020-02
2020-01
2019-12
2019-11
2019-10
2019-09
2019-08
2019-07
2019-06
2019-05
2019-04
2019-03
2019-02
2019-01
2018-12
2018-11
2018-10
pm25
22 (Moderate)
27 (Moderate)
29 (Moderate)
32 (Moderate)
36 (Unhealthy for Sensitive Groups)
44 (Unhealthy for Sensitive Groups)
31 (Moderate)
22 (Moderate)
27 (Moderate)
22 (Moderate)
16 (Moderate)
17 (Moderate)
22 (Moderate)
24 (Moderate)
28 (Moderate)
42 (Unhealthy for Sensitive Groups)
71 (Unhealthy)
46 (Unhealthy for Sensitive Groups)
30 (Moderate)
24 (Moderate)
co
868 (Good)
531 (Good)
636 (Good)
857 (Good)
1 (Good)
952 (Good)
767 (Good)
952 (Good)
838 (Good)
860 (Good)
773 (Good)
741 (Good)
637 (Good)
663 (Good)
823 (Good)
890 (Good)
772 (Good)
459 (Good)
706 (Good)
905 (Good)
no2
17 (Good)
22 (Good)
19 (Good)
14 (Good)
15 (Good)
26 (Good)
22 (Good)
16 (Good)
13 (Good)
8.3 (Good)
10 (Good)
12 (Good)
16 (Good)
21 (Good)
23 (Good)
16 (Good)
37 (Good)
33 (Good)
21 (Good)
17 (Good)
o3
94 (Moderate)
109 (Moderate)
79 (Moderate)
62 (Good)
56 (Good)
67 (Good)
78 (Moderate)
93 (Moderate)
131 (Unhealthy for Sensitive Groups)
117 (Moderate)
81 (Moderate)
84 (Moderate)
77 (Moderate)
62 (Good)
67 (Good)
58 (Good)
42 (Good)
43 (Good)
62 (Good)
79 (Moderate)
pm10
38 (Moderate)
45 (Moderate)
50 (Moderate)
40 (Moderate)
50 (Unhealthy for Sensitive Groups)
74 (Unhealthy for Sensitive Groups)
58 (Unhealthy for Sensitive Groups)
39 (Moderate)
45 (Moderate)
37 (Moderate)
33 (Moderate)
30 (Moderate)
49 (Moderate)
43 (Moderate)
52 (Unhealthy for Sensitive Groups)
54 (Unhealthy for Sensitive Groups)
100 (Unhealthy)
74 (Unhealthy for Sensitive Groups)
47 (Moderate)
44 (Moderate)
so2
5.3 (Good)
5.8 (Good)
5.4 (Good)
4 (Good)
4.2 (Good)
5.7 (Good)
5 (Good)
5 (Good)
4.9 (Good)
4.2 (Good)
5.1 (Good)
6 (Good)
6.9 (Good)
8.1 (Good)
9.3 (Good)
6.8 (Good)
5.4 (Good)
4.7 (Good)
2.1 (Good)
1.7 (Good)
data source »
吉首市计生局
Friday, May 27, 2022, 12:00 PM
PM10 179 (Very bad Hazardous)
particulate matter (PM10) suspended dust
PM2,5 35 (Unhealthy for Sensitive Groups)
particulate matter (PM2.5) dust
O3 0.04 (Good)
ozone (O3)
NO2 0 (Good)
nitrogen dioxide (NO2)
SO2 0 (Good)
sulfur dioxide (SO2)
吉首市计生局
index
2022-05-27
pm10
56
pm25
56
o3
0.03
no2
0
so2
0
吉首市计生局
2018-10 2020-05
index
2020-05
2020-04
2020-03
2020-02
2020-01
2019-12
2019-11
2019-10
2019-09
2019-08
2019-07
2019-06
2019-05
2019-04
2019-03
2019-02
2019-01
2018-12
2018-11
2018-10
pm25
22
27
29
32
36
44
31
22
27
22
16
17
22
24
28
42
71
46
30
24
co
868
531
636
857
1
952
767
952
838
860
773
741
637
663
823
890
772
459
706
905
no2
17
22
19
14
15
26
22
16
13
8.3
10
12
16
21
23
16
37
33
21
17
o3
94
109
79
62
56
67
78
93
131
117
81
84
77
62
67
58
42
43
62
79
pm10
38
45
50
40
50
74
58
39
45
37
33
30
49
43
52
54
100
74
47
44
so2
5.3
5.8
5.4
4
4.2
5.7
5
5
4.9
4.2
5.1
6
6.9
8.1
9.3
6.8
5.4
4.7
2.1
1.7
* Pollution data source:
https://openaq.org
(ChinaAQIData)
The data is licensed under CC-By 4.0
PM10 179 (Very bad Hazardous)
PM2,5 35 (Unhealthy for Sensitive Groups)
O3 0 (Good)
NO2 0 (Good)
SO2 0 (Good)
Data on air pollution from recent days in Dapolong
| index | 2022-05-27 |
|---|---|
| pm10 | 56 Unhealthy for Sensitive Groups |
| pm25 | 56 Unhealthy |
| o3 | 0 Good |
| no2 | 0 Good |
| so2 | 0 Good |
| index | 2020-05 | 2020-04 | 2020-03 | 2020-02 | 2020-01 | 2019-12 | 2019-11 | 2019-10 | 2019-09 | 2019-08 | 2019-07 | 2019-06 | 2019-05 | 2019-04 | 2019-03 | 2019-02 | 2019-01 | 2018-12 | 2018-11 | 2018-10 |
|---|---|---|---|---|---|---|---|---|---|---|---|---|---|---|---|---|---|---|---|---|
| pm25 | 22 (Moderate) | 27 (Moderate) | 29 (Moderate) | 32 (Moderate) | 36 (Unhealthy for Sensitive Groups) | 44 (Unhealthy for Sensitive Groups) | 31 (Moderate) | 22 (Moderate) | 27 (Moderate) | 22 (Moderate) | 16 (Moderate) | 17 (Moderate) | 22 (Moderate) | 24 (Moderate) | 28 (Moderate) | 42 (Unhealthy for Sensitive Groups) | 71 (Unhealthy) | 46 (Unhealthy for Sensitive Groups) | 30 (Moderate) | 24 (Moderate) |
| co | 868 (Good) | 531 (Good) | 636 (Good) | 857 (Good) | 1 (Good) | 952 (Good) | 767 (Good) | 952 (Good) | 838 (Good) | 860 (Good) | 773 (Good) | 741 (Good) | 637 (Good) | 663 (Good) | 823 (Good) | 890 (Good) | 772 (Good) | 459 (Good) | 706 (Good) | 905 (Good) |
| no2 | 17 (Good) | 22 (Good) | 19 (Good) | 14 (Good) | 15 (Good) | 26 (Good) | 22 (Good) | 16 (Good) | 13 (Good) | 8.3 (Good) | 10 (Good) | 12 (Good) | 16 (Good) | 21 (Good) | 23 (Good) | 16 (Good) | 37 (Good) | 33 (Good) | 21 (Good) | 17 (Good) |
| o3 | 94 (Moderate) | 109 (Moderate) | 79 (Moderate) | 62 (Good) | 56 (Good) | 67 (Good) | 78 (Moderate) | 93 (Moderate) | 131 (Unhealthy for Sensitive Groups) | 117 (Moderate) | 81 (Moderate) | 84 (Moderate) | 77 (Moderate) | 62 (Good) | 67 (Good) | 58 (Good) | 42 (Good) | 43 (Good) | 62 (Good) | 79 (Moderate) |
| pm10 | 38 (Moderate) | 45 (Moderate) | 50 (Moderate) | 40 (Moderate) | 50 (Unhealthy for Sensitive Groups) | 74 (Unhealthy for Sensitive Groups) | 58 (Unhealthy for Sensitive Groups) | 39 (Moderate) | 45 (Moderate) | 37 (Moderate) | 33 (Moderate) | 30 (Moderate) | 49 (Moderate) | 43 (Moderate) | 52 (Unhealthy for Sensitive Groups) | 54 (Unhealthy for Sensitive Groups) | 100 (Unhealthy) | 74 (Unhealthy for Sensitive Groups) | 47 (Moderate) | 44 (Moderate) |
| so2 | 5.3 (Good) | 5.8 (Good) | 5.4 (Good) | 4 (Good) | 4.2 (Good) | 5.7 (Good) | 5 (Good) | 5 (Good) | 4.9 (Good) | 4.2 (Good) | 5.1 (Good) | 6 (Good) | 6.9 (Good) | 8.1 (Good) | 9.3 (Good) | 6.8 (Good) | 5.4 (Good) | 4.7 (Good) | 2.1 (Good) | 1.7 (Good) |
PM10 179 (Very bad Hazardous)
particulate matter (PM10) suspended dustPM2,5 35 (Unhealthy for Sensitive Groups)
particulate matter (PM2.5) dustO3 0.04 (Good)
ozone (O3)NO2 0 (Good)
nitrogen dioxide (NO2)SO2 0 (Good)
sulfur dioxide (SO2)吉首市计生局
| index | 2022-05-27 |
|---|---|
| pm10 | 56 |
| pm25 | 56 |
| o3 | 0.03 |
| no2 | 0 |
| so2 | 0 |
吉首市计生局

| index | 2020-05 | 2020-04 | 2020-03 | 2020-02 | 2020-01 | 2019-12 | 2019-11 | 2019-10 | 2019-09 | 2019-08 | 2019-07 | 2019-06 | 2019-05 | 2019-04 | 2019-03 | 2019-02 | 2019-01 | 2018-12 | 2018-11 | 2018-10 |
|---|---|---|---|---|---|---|---|---|---|---|---|---|---|---|---|---|---|---|---|---|
| pm25 | 22 | 27 | 29 | 32 | 36 | 44 | 31 | 22 | 27 | 22 | 16 | 17 | 22 | 24 | 28 | 42 | 71 | 46 | 30 | 24 |
| co | 868 | 531 | 636 | 857 | 1 | 952 | 767 | 952 | 838 | 860 | 773 | 741 | 637 | 663 | 823 | 890 | 772 | 459 | 706 | 905 |
| no2 | 17 | 22 | 19 | 14 | 15 | 26 | 22 | 16 | 13 | 8.3 | 10 | 12 | 16 | 21 | 23 | 16 | 37 | 33 | 21 | 17 |
| o3 | 94 | 109 | 79 | 62 | 56 | 67 | 78 | 93 | 131 | 117 | 81 | 84 | 77 | 62 | 67 | 58 | 42 | 43 | 62 | 79 |
| pm10 | 38 | 45 | 50 | 40 | 50 | 74 | 58 | 39 | 45 | 37 | 33 | 30 | 49 | 43 | 52 | 54 | 100 | 74 | 47 | 44 |
| so2 | 5.3 | 5.8 | 5.4 | 4 | 4.2 | 5.7 | 5 | 5 | 4.9 | 4.2 | 5.1 | 6 | 6.9 | 8.1 | 9.3 | 6.8 | 5.4 | 4.7 | 2.1 | 1.7 |