Air Pollution in Erli Dianzi: Real-time Air Quality Index and smog alert.
Pollution and air quality forecast for Erli Dianzi. Today is Tuesday, June 2, 2026. The following air pollution values have been recorded for Erli Dianzi:- particulate matter (PM10) suspended dust - 179 (Very bad Hazardous)
- particulate matter (PM2.5) dust - 35 (Unhealthy for Sensitive Groups)
- ozone (O3) - 0 (Good)
- nitrogen dioxide (NO2) - 0 (Good)
- sulfur dioxide (SO2) - 0 (Good)

What is the air quality in Erli Dianzi today? Is the air polluted in Erli Dianzi?. Is there smog?
What is the level of PM10 today in Erli Dianzi? (particulate matter (PM10) suspended dust)
The current level of particulate matter PM10 in Erli Dianzi is:
179 (Very bad Hazardous)
The highest PM10 values usually occur in month: 104 (January 2019).
The lowest value of particulate matter PM10 pollution in Erli Dianzi is usually recorded in: August (32).
What is the current level of PM2.5 in Erli Dianzi? (particulate matter (PM2.5) dust)
Today's PM2.5 level is:
35 (Unhealthy for Sensitive Groups)
For comparison, the highest level of PM2.5 in Erli Dianzi in the last 7 days was: 56 (Friday, May 27, 2022) and the lowest: 56 (Friday, May 27, 2022).
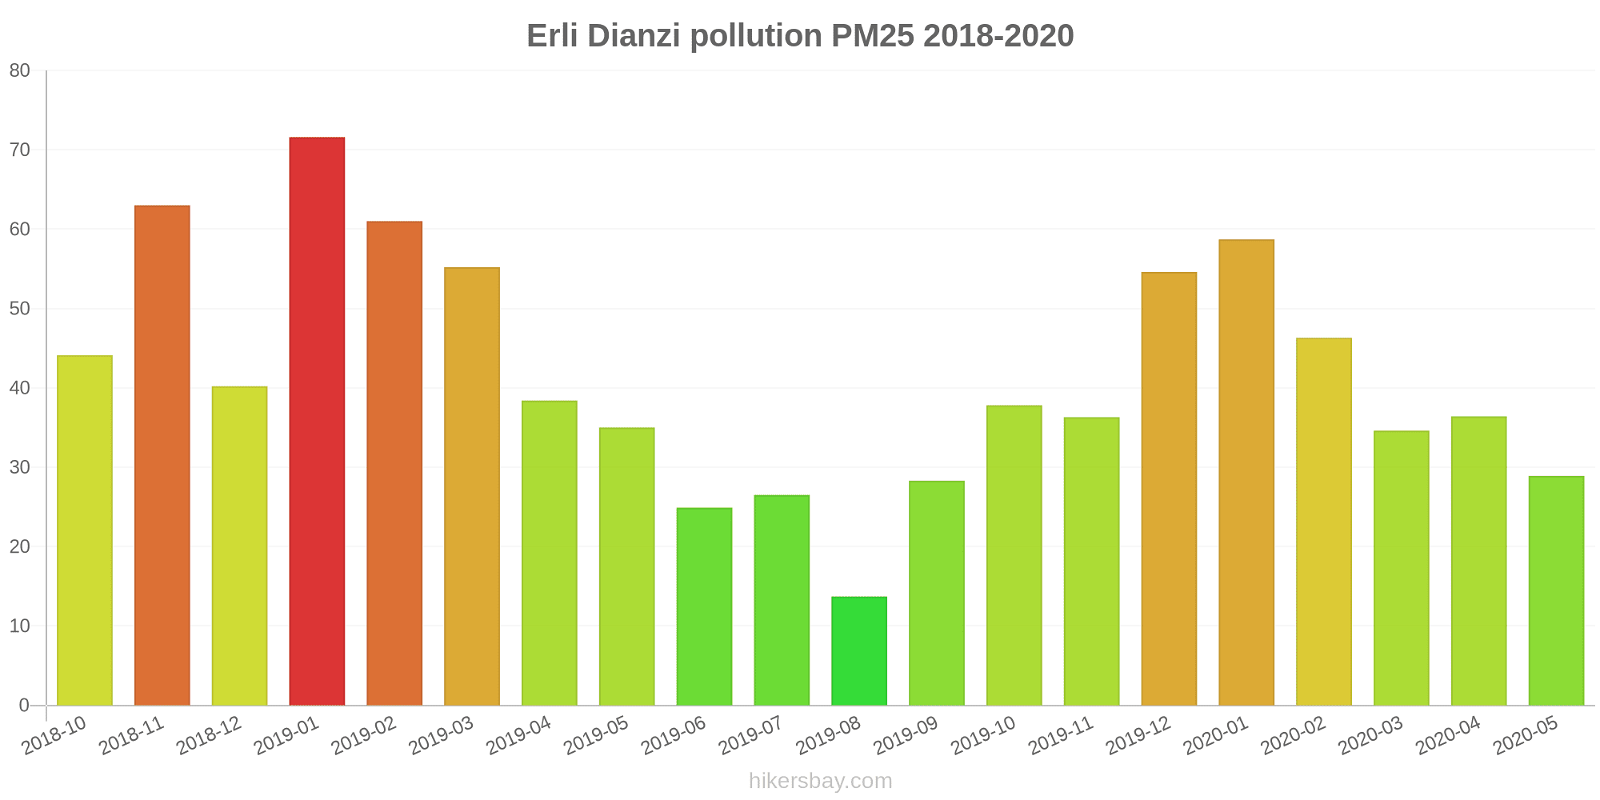
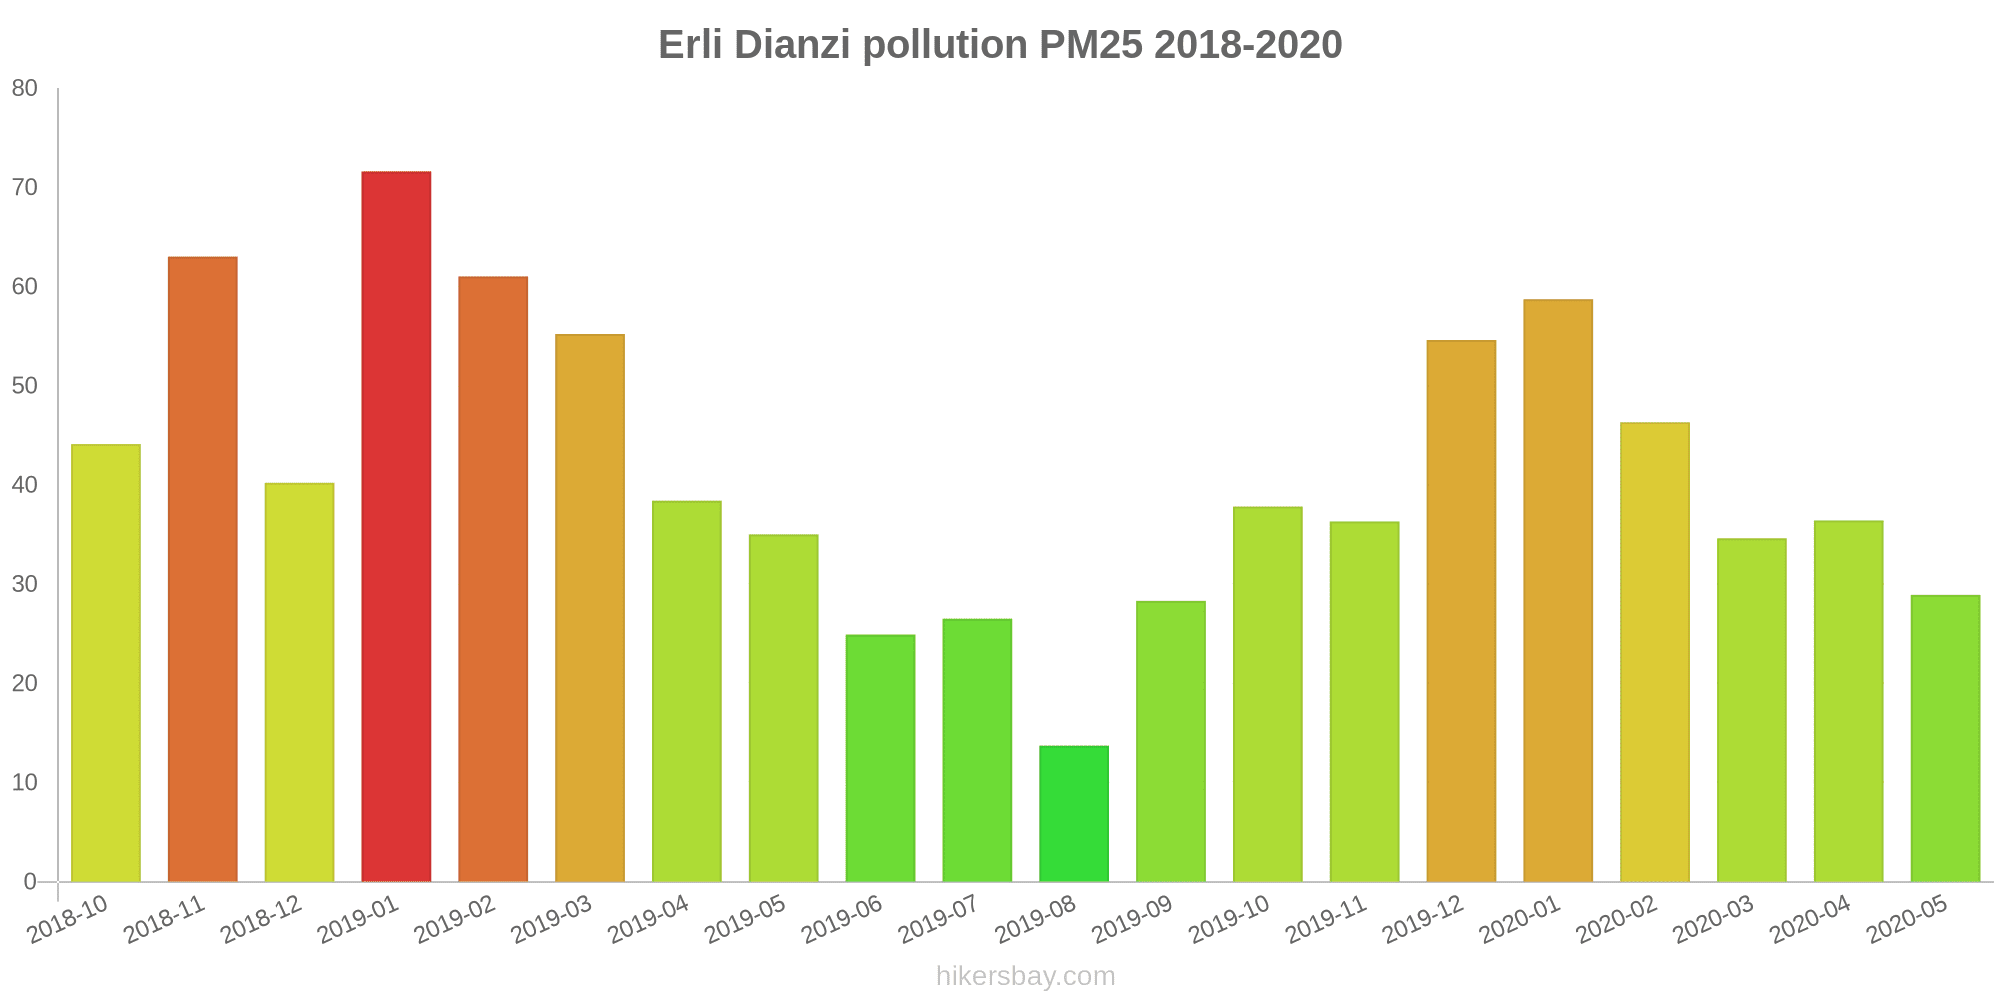
The highest PM2.5 values were recorded: 72 (January 2019).
The lowest level of particulate matter PM2.5 pollution occurs in month: August (14).
How is the O3 level today in Erli Dianzi? (ozone (O3))
0 (Good)
How high is the level of NO2? (nitrogen dioxide (NO2))
0 (Good)
What is the level of SO2 pollution? (sulfur dioxide (SO2))
0 (Good)
Current data Friday, May 27, 2022, 12:00 PM
PM10 179 (Very bad Hazardous)
PM2,5 35 (Unhealthy for Sensitive Groups)
O3 0 (Good)
NO2 0 (Good)
SO2 0 (Good)
Data on air pollution from recent days in Erli Dianzi
index
2022-05-27
pm10
56
Unhealthy for Sensitive Groups
pm25
56
Unhealthy
o3
0
Good
no2
0
Good
so2
0
Good
data source »
Air pollution in Erli Dianzi from October 2018 to May 2020
index
2020-05
2020-04
2020-03
2020-02
2020-01
2019-12
2019-11
2019-10
2019-09
2019-08
2019-07
2019-06
2019-05
2019-04
2019-03
2019-02
2019-01
2018-12
2018-11
2018-10
pm25
29 (Moderate)
36 (Unhealthy for Sensitive Groups)
35 (Moderate)
46 (Unhealthy for Sensitive Groups)
59 (Unhealthy)
55 (Unhealthy for Sensitive Groups)
36 (Unhealthy for Sensitive Groups)
38 (Unhealthy for Sensitive Groups)
28 (Moderate)
14 (Moderate)
27 (Moderate)
25 (Moderate)
35 (Unhealthy for Sensitive Groups)
38 (Unhealthy for Sensitive Groups)
55 (Unhealthy)
61 (Unhealthy)
72 (Unhealthy)
40 (Unhealthy for Sensitive Groups)
63 (Unhealthy)
44 (Unhealthy for Sensitive Groups)
co
647 (Good)
676 (Good)
1 (Good)
1 (Good)
1 (Good)
1 (Good)
1 (Good)
947 (Good)
937 (Good)
615 (Good)
860 (Good)
652 (Good)
878 (Good)
935 (Good)
1 (Good)
1 (Good)
2 (Good)
1 (Good)
1 (Good)
1 (Good)
no2
39 (Good)
46 (Moderate)
46 (Moderate)
34 (Good)
42 (Moderate)
49 (Moderate)
44 (Moderate)
50 (Moderate)
53 (Moderate)
34 (Good)
35 (Good)
42 (Moderate)
47 (Moderate)
50 (Moderate)
57 (Moderate)
51 (Moderate)
65 (Moderate)
50 (Moderate)
58 (Moderate)
60 (Moderate)
o3
131 (Unhealthy for Sensitive Groups)
129 (Unhealthy for Sensitive Groups)
94 (Moderate)
81 (Moderate)
69 (Good)
54 (Good)
67 (Good)
99 (Moderate)
157 (Unhealthy)
130 (Unhealthy for Sensitive Groups)
162 (Unhealthy)
159 (Unhealthy)
156 (Unhealthy)
110 (Moderate)
92 (Moderate)
72 (Moderate)
64 (Good)
55 (Good)
59 (Good)
77 (Moderate)
pm10
65 (Unhealthy for Sensitive Groups)
83 (Unhealthy)
68 (Unhealthy for Sensitive Groups)
77 (Unhealthy for Sensitive Groups)
89 (Unhealthy)
83 (Unhealthy)
71 (Unhealthy for Sensitive Groups)
72 (Unhealthy for Sensitive Groups)
57 (Unhealthy for Sensitive Groups)
32 (Moderate)
50 (Moderate)
42 (Moderate)
60 (Unhealthy for Sensitive Groups)
68 (Unhealthy for Sensitive Groups)
86 (Unhealthy)
92 (Unhealthy)
104 (Unhealthy)
69 (Unhealthy for Sensitive Groups)
99 (Unhealthy)
73 (Unhealthy for Sensitive Groups)
so2
14 (Good)
18 (Good)
18 (Good)
21 (Good)
36 (Good)
33 (Good)
26 (Good)
19 (Good)
17 (Good)
9.3 (Good)
8.2 (Good)
13 (Good)
15 (Good)
16 (Good)
27 (Good)
36 (Good)
52 (Moderate)
31 (Good)
27 (Good)
21 (Good)
data source »
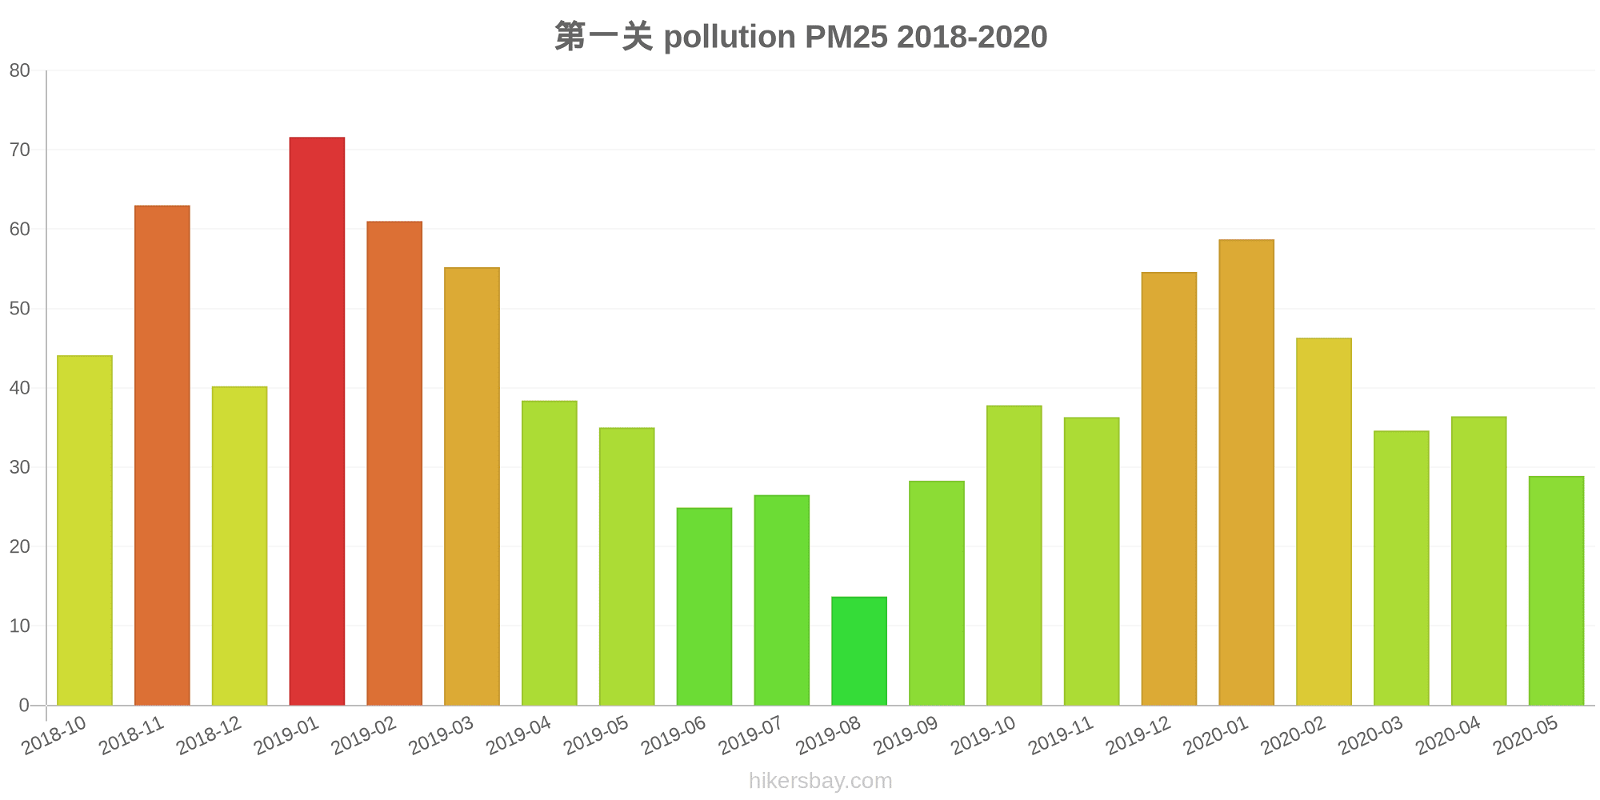
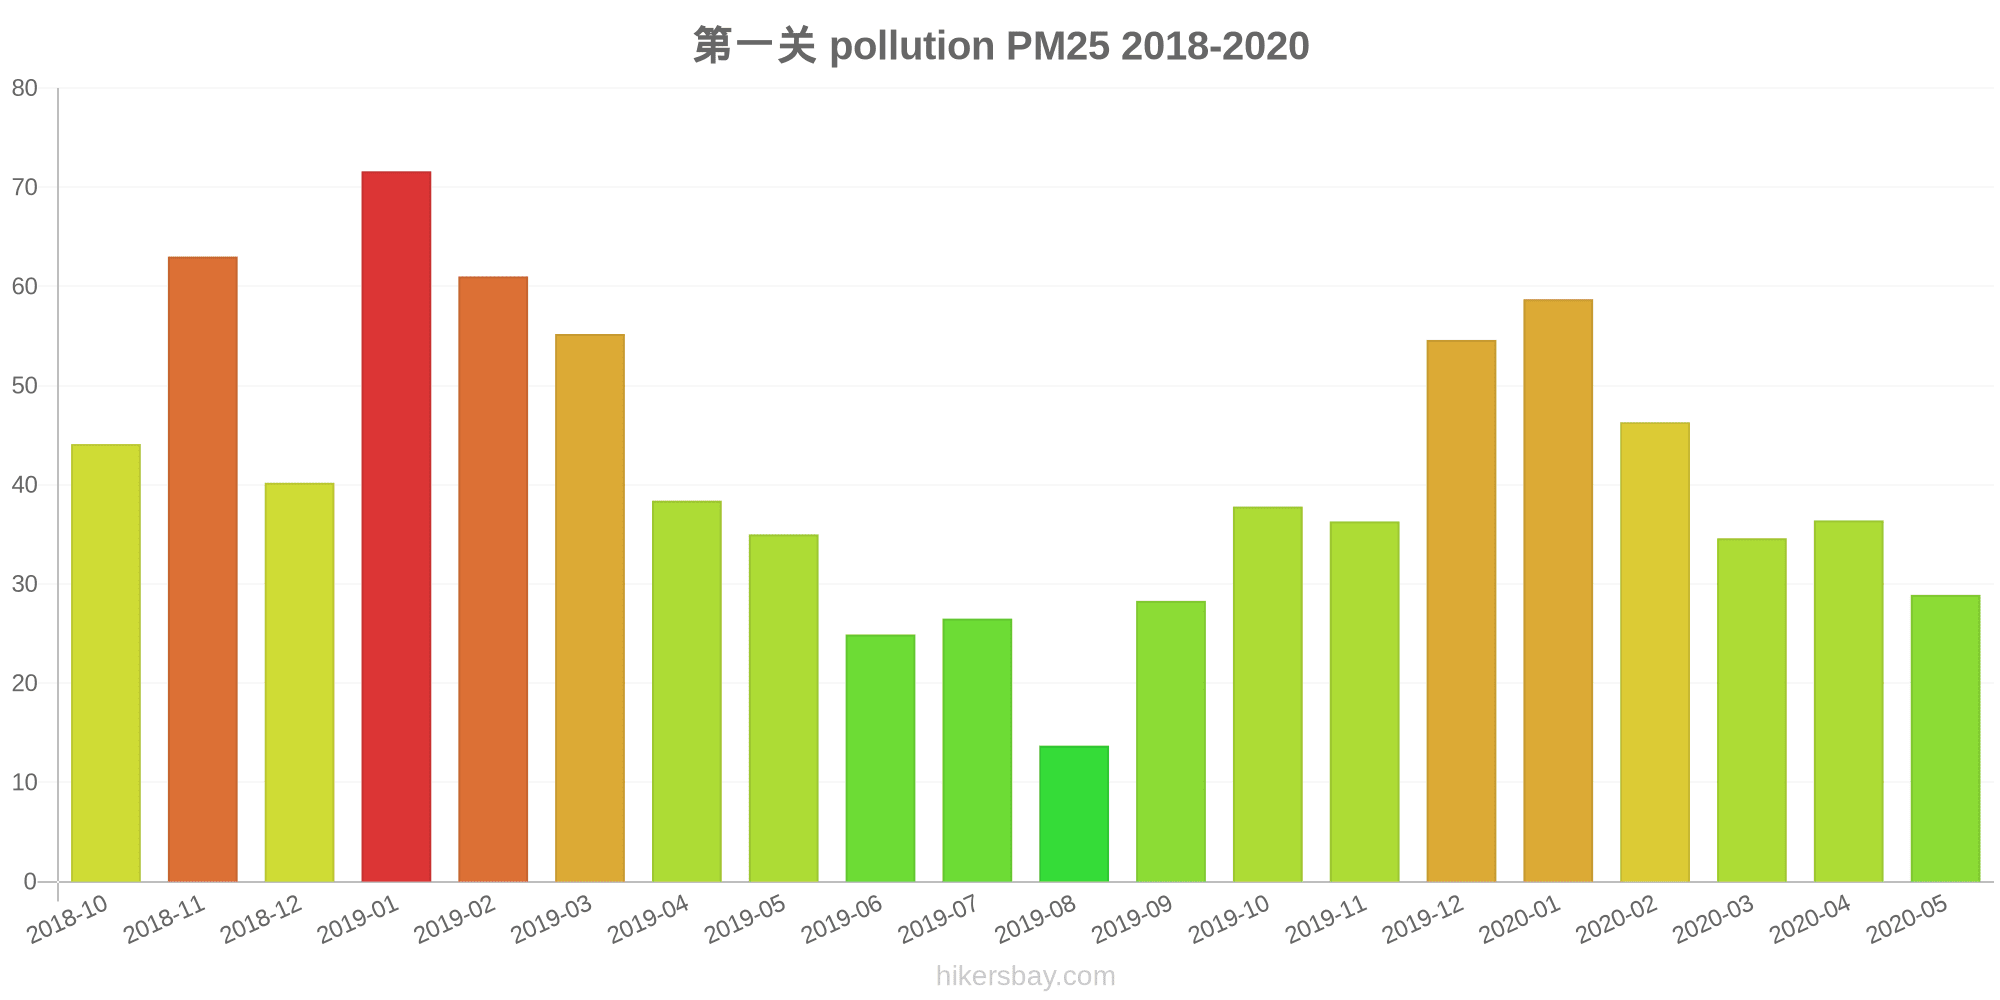
第一关
Friday, May 27, 2022, 12:00 PM
PM10 179 (Very bad Hazardous)
particulate matter (PM10) suspended dust
PM2,5 35 (Unhealthy for Sensitive Groups)
particulate matter (PM2.5) dust
O3 0.04 (Good)
ozone (O3)
NO2 0 (Good)
nitrogen dioxide (NO2)
SO2 0 (Good)
sulfur dioxide (SO2)
第一关
index
2022-05-27
pm10
56
pm25
56
o3
0.03
no2
0
so2
0
第一关
2018-10 2020-05
index
2020-05
2020-04
2020-03
2020-02
2020-01
2019-12
2019-11
2019-10
2019-09
2019-08
2019-07
2019-06
2019-05
2019-04
2019-03
2019-02
2019-01
2018-12
2018-11
2018-10
pm25
29
36
35
46
59
55
36
38
28
14
27
25
35
38
55
61
72
40
63
44
co
647
676
1
1
1
1
1
947
937
615
860
652
878
935
1
1
2
1
1
1
no2
39
46
46
34
42
49
44
50
53
34
35
42
47
50
57
51
65
50
58
60
o3
131
129
94
81
69
54
67
99
157
130
162
159
156
110
92
72
64
55
59
77
pm10
65
83
68
77
89
83
71
72
57
32
50
42
60
68
86
92
104
69
99
73
so2
14
18
18
21
36
33
26
19
17
9.3
8.2
13
15
16
27
36
52
31
27
21
* Pollution data source:
https://openaq.org
(ChinaAQIData)
The data is licensed under CC-By 4.0
PM10 179 (Very bad Hazardous)
PM2,5 35 (Unhealthy for Sensitive Groups)
O3 0 (Good)
NO2 0 (Good)
SO2 0 (Good)
Data on air pollution from recent days in Erli Dianzi
| index | 2022-05-27 |
|---|---|
| pm10 | 56 Unhealthy for Sensitive Groups |
| pm25 | 56 Unhealthy |
| o3 | 0 Good |
| no2 | 0 Good |
| so2 | 0 Good |
| index | 2020-05 | 2020-04 | 2020-03 | 2020-02 | 2020-01 | 2019-12 | 2019-11 | 2019-10 | 2019-09 | 2019-08 | 2019-07 | 2019-06 | 2019-05 | 2019-04 | 2019-03 | 2019-02 | 2019-01 | 2018-12 | 2018-11 | 2018-10 |
|---|---|---|---|---|---|---|---|---|---|---|---|---|---|---|---|---|---|---|---|---|
| pm25 | 29 (Moderate) | 36 (Unhealthy for Sensitive Groups) | 35 (Moderate) | 46 (Unhealthy for Sensitive Groups) | 59 (Unhealthy) | 55 (Unhealthy for Sensitive Groups) | 36 (Unhealthy for Sensitive Groups) | 38 (Unhealthy for Sensitive Groups) | 28 (Moderate) | 14 (Moderate) | 27 (Moderate) | 25 (Moderate) | 35 (Unhealthy for Sensitive Groups) | 38 (Unhealthy for Sensitive Groups) | 55 (Unhealthy) | 61 (Unhealthy) | 72 (Unhealthy) | 40 (Unhealthy for Sensitive Groups) | 63 (Unhealthy) | 44 (Unhealthy for Sensitive Groups) |
| co | 647 (Good) | 676 (Good) | 1 (Good) | 1 (Good) | 1 (Good) | 1 (Good) | 1 (Good) | 947 (Good) | 937 (Good) | 615 (Good) | 860 (Good) | 652 (Good) | 878 (Good) | 935 (Good) | 1 (Good) | 1 (Good) | 2 (Good) | 1 (Good) | 1 (Good) | 1 (Good) |
| no2 | 39 (Good) | 46 (Moderate) | 46 (Moderate) | 34 (Good) | 42 (Moderate) | 49 (Moderate) | 44 (Moderate) | 50 (Moderate) | 53 (Moderate) | 34 (Good) | 35 (Good) | 42 (Moderate) | 47 (Moderate) | 50 (Moderate) | 57 (Moderate) | 51 (Moderate) | 65 (Moderate) | 50 (Moderate) | 58 (Moderate) | 60 (Moderate) |
| o3 | 131 (Unhealthy for Sensitive Groups) | 129 (Unhealthy for Sensitive Groups) | 94 (Moderate) | 81 (Moderate) | 69 (Good) | 54 (Good) | 67 (Good) | 99 (Moderate) | 157 (Unhealthy) | 130 (Unhealthy for Sensitive Groups) | 162 (Unhealthy) | 159 (Unhealthy) | 156 (Unhealthy) | 110 (Moderate) | 92 (Moderate) | 72 (Moderate) | 64 (Good) | 55 (Good) | 59 (Good) | 77 (Moderate) |
| pm10 | 65 (Unhealthy for Sensitive Groups) | 83 (Unhealthy) | 68 (Unhealthy for Sensitive Groups) | 77 (Unhealthy for Sensitive Groups) | 89 (Unhealthy) | 83 (Unhealthy) | 71 (Unhealthy for Sensitive Groups) | 72 (Unhealthy for Sensitive Groups) | 57 (Unhealthy for Sensitive Groups) | 32 (Moderate) | 50 (Moderate) | 42 (Moderate) | 60 (Unhealthy for Sensitive Groups) | 68 (Unhealthy for Sensitive Groups) | 86 (Unhealthy) | 92 (Unhealthy) | 104 (Unhealthy) | 69 (Unhealthy for Sensitive Groups) | 99 (Unhealthy) | 73 (Unhealthy for Sensitive Groups) |
| so2 | 14 (Good) | 18 (Good) | 18 (Good) | 21 (Good) | 36 (Good) | 33 (Good) | 26 (Good) | 19 (Good) | 17 (Good) | 9.3 (Good) | 8.2 (Good) | 13 (Good) | 15 (Good) | 16 (Good) | 27 (Good) | 36 (Good) | 52 (Moderate) | 31 (Good) | 27 (Good) | 21 (Good) |
PM10 179 (Very bad Hazardous)
particulate matter (PM10) suspended dustPM2,5 35 (Unhealthy for Sensitive Groups)
particulate matter (PM2.5) dustO3 0.04 (Good)
ozone (O3)NO2 0 (Good)
nitrogen dioxide (NO2)SO2 0 (Good)
sulfur dioxide (SO2)第一关
| index | 2022-05-27 |
|---|---|
| pm10 | 56 |
| pm25 | 56 |
| o3 | 0.03 |
| no2 | 0 |
| so2 | 0 |
第一关
| index | 2020-05 | 2020-04 | 2020-03 | 2020-02 | 2020-01 | 2019-12 | 2019-11 | 2019-10 | 2019-09 | 2019-08 | 2019-07 | 2019-06 | 2019-05 | 2019-04 | 2019-03 | 2019-02 | 2019-01 | 2018-12 | 2018-11 | 2018-10 |
|---|---|---|---|---|---|---|---|---|---|---|---|---|---|---|---|---|---|---|---|---|
| pm25 | 29 | 36 | 35 | 46 | 59 | 55 | 36 | 38 | 28 | 14 | 27 | 25 | 35 | 38 | 55 | 61 | 72 | 40 | 63 | 44 |
| co | 647 | 676 | 1 | 1 | 1 | 1 | 1 | 947 | 937 | 615 | 860 | 652 | 878 | 935 | 1 | 1 | 2 | 1 | 1 | 1 |
| no2 | 39 | 46 | 46 | 34 | 42 | 49 | 44 | 50 | 53 | 34 | 35 | 42 | 47 | 50 | 57 | 51 | 65 | 50 | 58 | 60 |
| o3 | 131 | 129 | 94 | 81 | 69 | 54 | 67 | 99 | 157 | 130 | 162 | 159 | 156 | 110 | 92 | 72 | 64 | 55 | 59 | 77 |
| pm10 | 65 | 83 | 68 | 77 | 89 | 83 | 71 | 72 | 57 | 32 | 50 | 42 | 60 | 68 | 86 | 92 | 104 | 69 | 99 | 73 |
| so2 | 14 | 18 | 18 | 21 | 36 | 33 | 26 | 19 | 17 | 9.3 | 8.2 | 13 | 15 | 16 | 27 | 36 | 52 | 31 | 27 | 21 |