Air Pollution in Wenhuali: Real-time Air Quality Index and smog alert.
Pollution and air quality forecast for Wenhuali. Today is Tuesday, June 2, 2026. The following air pollution values have been recorded for Wenhuali:- particulate matter (PM10) suspended dust - 179 (Very bad Hazardous)
- particulate matter (PM2.5) dust - 35 (Unhealthy for Sensitive Groups)
- ozone (O3) - 0 (Good)
- nitrogen dioxide (NO2) - 0 (Good)
- sulfur dioxide (SO2) - 0 (Good)

What is the air quality in Wenhuali today? Is the air polluted in Wenhuali?. Is there smog?
What is the level of PM10 today in Wenhuali? (particulate matter (PM10) suspended dust)
The current level of particulate matter PM10 in Wenhuali is:
179 (Very bad Hazardous)
The highest PM10 values usually occur in month: 115 (November 2018).
The lowest value of particulate matter PM10 pollution in Wenhuali is usually recorded in: August (38).
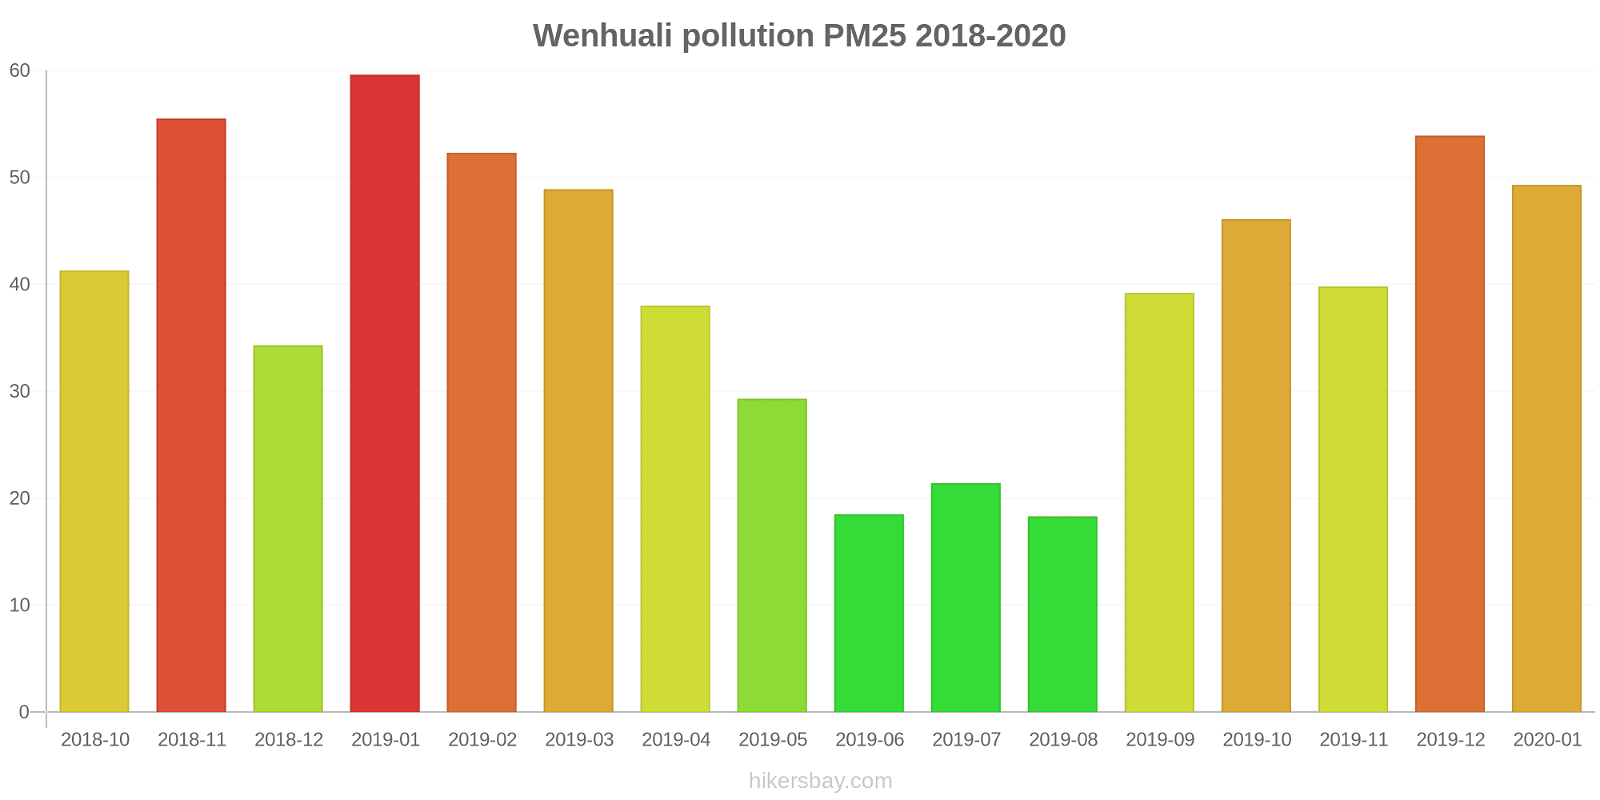
What is the current level of PM2.5 in Wenhuali? (particulate matter (PM2.5) dust)
Today's PM2.5 level is:
35 (Unhealthy for Sensitive Groups)
For comparison, the highest level of PM2.5 in Wenhuali in the last 7 days was: 56 (Friday, May 27, 2022) and the lowest: 56 (Friday, May 27, 2022).
The highest PM2.5 values were recorded: 60 (January 2019).
The lowest level of particulate matter PM2.5 pollution occurs in month: August (18).
How is the O3 level today in Wenhuali? (ozone (O3))
0 (Good)
How high is the level of NO2? (nitrogen dioxide (NO2))
0 (Good)
What is the level of SO2 pollution? (sulfur dioxide (SO2))
0 (Good)
Current data Friday, May 27, 2022, 12:00 PM
PM10 179 (Very bad Hazardous)
PM2,5 35 (Unhealthy for Sensitive Groups)
O3 0 (Good)
NO2 0 (Good)
SO2 0 (Good)
Data on air pollution from recent days in Wenhuali
index
2022-05-27
pm10
56
Unhealthy for Sensitive Groups
pm25
56
Unhealthy
o3
0
Good
no2
0
Good
so2
0
Good
data source »
Air pollution in Wenhuali from October 2018 to January 2020
index
2020-01
2019-12
2019-11
2019-10
2019-09
2019-08
2019-07
2019-06
2019-05
2019-04
2019-03
2019-02
2019-01
2018-12
2018-11
2018-10
pm25
49 (Unhealthy for Sensitive Groups)
54 (Unhealthy for Sensitive Groups)
40 (Unhealthy for Sensitive Groups)
46 (Unhealthy for Sensitive Groups)
39 (Unhealthy for Sensitive Groups)
18 (Moderate)
21 (Moderate)
19 (Moderate)
29 (Moderate)
38 (Unhealthy for Sensitive Groups)
49 (Unhealthy for Sensitive Groups)
52 (Unhealthy for Sensitive Groups)
60 (Unhealthy)
34 (Moderate)
56 (Unhealthy)
41 (Unhealthy for Sensitive Groups)
co
1 (Good)
1 (Good)
1 (Good)
1 (Good)
922 (Good)
561 (Good)
743 (Good)
523 (Good)
680 (Good)
838 (Good)
1 (Good)
1 (Good)
2 (Good)
1 (Good)
1 (Good)
1 (Good)
no2
49 (Moderate)
53 (Moderate)
51 (Moderate)
55 (Moderate)
45 (Moderate)
34 (Good)
31 (Good)
33 (Good)
44 (Moderate)
45 (Moderate)
52 (Moderate)
50 (Moderate)
64 (Moderate)
49 (Moderate)
59 (Moderate)
62 (Moderate)
o3
55 (Good)
49 (Good)
64 (Good)
94 (Moderate)
167 (Unhealthy)
129 (Unhealthy for Sensitive Groups)
162 (Unhealthy)
161 (Unhealthy)
160 (Unhealthy)
118 (Moderate)
98 (Moderate)
68 (Good)
55 (Good)
54 (Good)
61 (Good)
81 (Moderate)
pm10
78 (Unhealthy for Sensitive Groups)
78 (Unhealthy for Sensitive Groups)
72 (Unhealthy for Sensitive Groups)
80 (Unhealthy)
67 (Unhealthy for Sensitive Groups)
38 (Moderate)
62 (Unhealthy for Sensitive Groups)
73 (Unhealthy for Sensitive Groups)
83 (Unhealthy)
86 (Unhealthy)
90 (Unhealthy)
98 (Unhealthy)
110 (Very Unhealthy)
72 (Unhealthy for Sensitive Groups)
115 (Very Unhealthy)
92 (Unhealthy)
so2
22 (Good)
21 (Good)
18 (Good)
19 (Good)
19 (Good)
12 (Good)
9.6 (Good)
11 (Good)
14 (Good)
22 (Good)
26 (Good)
28 (Good)
37 (Good)
24 (Good)
26 (Good)
22 (Good)
data source »
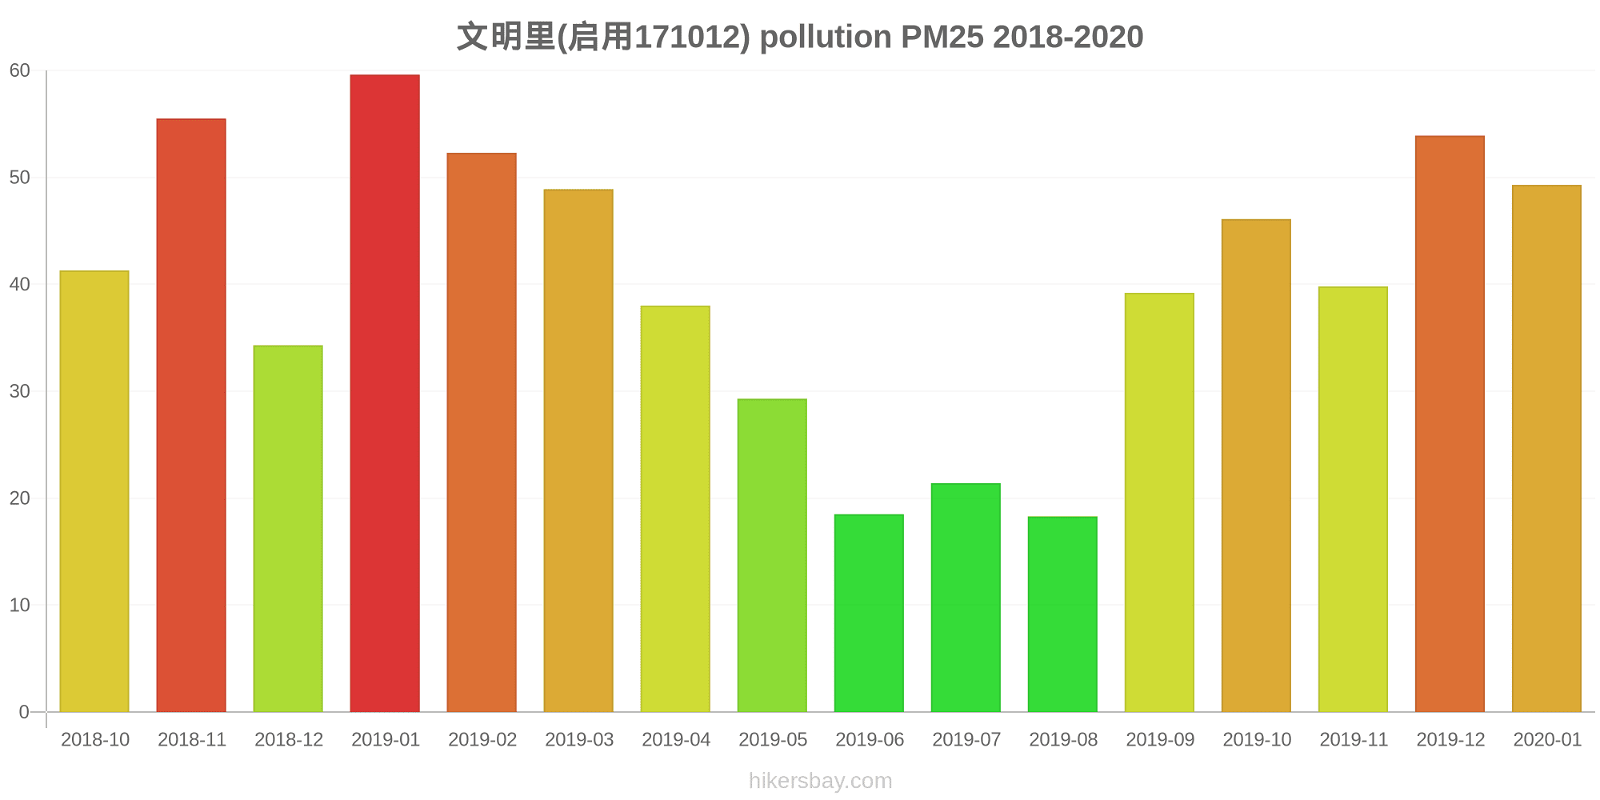
文明里(启用171012)
Friday, May 27, 2022, 12:00 PM
PM10 179 (Very bad Hazardous)
particulate matter (PM10) suspended dust
PM2,5 35 (Unhealthy for Sensitive Groups)
particulate matter (PM2.5) dust
O3 0.04 (Good)
ozone (O3)
NO2 0 (Good)
nitrogen dioxide (NO2)
SO2 0 (Good)
sulfur dioxide (SO2)
文明里(启用171012)
index
2022-05-27
pm10
56
pm25
56
o3
0.03
no2
0
so2
0
文明里(启用171012)
2018-10 2020-01
index
2020-01
2019-12
2019-11
2019-10
2019-09
2019-08
2019-07
2019-06
2019-05
2019-04
2019-03
2019-02
2019-01
2018-12
2018-11
2018-10
pm25
49
54
40
46
39
18
21
19
29
38
49
52
60
34
56
41
co
1
1
1
1
922
561
743
523
680
838
1
1
2
1
1
1
no2
49
53
51
55
45
34
31
33
44
45
52
50
64
49
59
62
o3
55
49
64
94
167
129
162
161
160
118
98
68
55
54
61
81
pm10
78
78
72
80
67
38
62
73
83
86
90
98
110
72
115
92
so2
22
21
18
19
19
12
9.6
11
14
22
26
28
37
24
26
22
* Pollution data source:
https://openaq.org
(ChinaAQIData)
The data is licensed under CC-By 4.0
PM10 179 (Very bad Hazardous)
PM2,5 35 (Unhealthy for Sensitive Groups)
O3 0 (Good)
NO2 0 (Good)
SO2 0 (Good)
Data on air pollution from recent days in Wenhuali
| index | 2022-05-27 |
|---|---|
| pm10 | 56 Unhealthy for Sensitive Groups |
| pm25 | 56 Unhealthy |
| o3 | 0 Good |
| no2 | 0 Good |
| so2 | 0 Good |

| index | 2020-01 | 2019-12 | 2019-11 | 2019-10 | 2019-09 | 2019-08 | 2019-07 | 2019-06 | 2019-05 | 2019-04 | 2019-03 | 2019-02 | 2019-01 | 2018-12 | 2018-11 | 2018-10 |
|---|---|---|---|---|---|---|---|---|---|---|---|---|---|---|---|---|
| pm25 | 49 (Unhealthy for Sensitive Groups) | 54 (Unhealthy for Sensitive Groups) | 40 (Unhealthy for Sensitive Groups) | 46 (Unhealthy for Sensitive Groups) | 39 (Unhealthy for Sensitive Groups) | 18 (Moderate) | 21 (Moderate) | 19 (Moderate) | 29 (Moderate) | 38 (Unhealthy for Sensitive Groups) | 49 (Unhealthy for Sensitive Groups) | 52 (Unhealthy for Sensitive Groups) | 60 (Unhealthy) | 34 (Moderate) | 56 (Unhealthy) | 41 (Unhealthy for Sensitive Groups) |
| co | 1 (Good) | 1 (Good) | 1 (Good) | 1 (Good) | 922 (Good) | 561 (Good) | 743 (Good) | 523 (Good) | 680 (Good) | 838 (Good) | 1 (Good) | 1 (Good) | 2 (Good) | 1 (Good) | 1 (Good) | 1 (Good) |
| no2 | 49 (Moderate) | 53 (Moderate) | 51 (Moderate) | 55 (Moderate) | 45 (Moderate) | 34 (Good) | 31 (Good) | 33 (Good) | 44 (Moderate) | 45 (Moderate) | 52 (Moderate) | 50 (Moderate) | 64 (Moderate) | 49 (Moderate) | 59 (Moderate) | 62 (Moderate) |
| o3 | 55 (Good) | 49 (Good) | 64 (Good) | 94 (Moderate) | 167 (Unhealthy) | 129 (Unhealthy for Sensitive Groups) | 162 (Unhealthy) | 161 (Unhealthy) | 160 (Unhealthy) | 118 (Moderate) | 98 (Moderate) | 68 (Good) | 55 (Good) | 54 (Good) | 61 (Good) | 81 (Moderate) |
| pm10 | 78 (Unhealthy for Sensitive Groups) | 78 (Unhealthy for Sensitive Groups) | 72 (Unhealthy for Sensitive Groups) | 80 (Unhealthy) | 67 (Unhealthy for Sensitive Groups) | 38 (Moderate) | 62 (Unhealthy for Sensitive Groups) | 73 (Unhealthy for Sensitive Groups) | 83 (Unhealthy) | 86 (Unhealthy) | 90 (Unhealthy) | 98 (Unhealthy) | 110 (Very Unhealthy) | 72 (Unhealthy for Sensitive Groups) | 115 (Very Unhealthy) | 92 (Unhealthy) |
| so2 | 22 (Good) | 21 (Good) | 18 (Good) | 19 (Good) | 19 (Good) | 12 (Good) | 9.6 (Good) | 11 (Good) | 14 (Good) | 22 (Good) | 26 (Good) | 28 (Good) | 37 (Good) | 24 (Good) | 26 (Good) | 22 (Good) |
PM10 179 (Very bad Hazardous)
particulate matter (PM10) suspended dustPM2,5 35 (Unhealthy for Sensitive Groups)
particulate matter (PM2.5) dustO3 0.04 (Good)
ozone (O3)NO2 0 (Good)
nitrogen dioxide (NO2)SO2 0 (Good)
sulfur dioxide (SO2)文明里(启用171012)
| index | 2022-05-27 |
|---|---|
| pm10 | 56 |
| pm25 | 56 |
| o3 | 0.03 |
| no2 | 0 |
| so2 | 0 |
文明里(启用171012)

| index | 2020-01 | 2019-12 | 2019-11 | 2019-10 | 2019-09 | 2019-08 | 2019-07 | 2019-06 | 2019-05 | 2019-04 | 2019-03 | 2019-02 | 2019-01 | 2018-12 | 2018-11 | 2018-10 |
|---|---|---|---|---|---|---|---|---|---|---|---|---|---|---|---|---|
| pm25 | 49 | 54 | 40 | 46 | 39 | 18 | 21 | 19 | 29 | 38 | 49 | 52 | 60 | 34 | 56 | 41 |
| co | 1 | 1 | 1 | 1 | 922 | 561 | 743 | 523 | 680 | 838 | 1 | 1 | 2 | 1 | 1 | 1 |
| no2 | 49 | 53 | 51 | 55 | 45 | 34 | 31 | 33 | 44 | 45 | 52 | 50 | 64 | 49 | 59 | 62 |
| o3 | 55 | 49 | 64 | 94 | 167 | 129 | 162 | 161 | 160 | 118 | 98 | 68 | 55 | 54 | 61 | 81 |
| pm10 | 78 | 78 | 72 | 80 | 67 | 38 | 62 | 73 | 83 | 86 | 90 | 98 | 110 | 72 | 115 | 92 |
| so2 | 22 | 21 | 18 | 19 | 19 | 12 | 9.6 | 11 | 14 | 22 | 26 | 28 | 37 | 24 | 26 | 22 |