Air Pollution in Qingshuitang: Real-time Air Quality Index and smog alert.
Pollution and air quality forecast for Qingshuitang. Today is Tuesday, June 16, 2026. The following air pollution values have been recorded for Qingshuitang:- particulate matter (PM10) suspended dust - 179 (Very bad Hazardous)
- particulate matter (PM2.5) dust - 35 (Unhealthy for Sensitive Groups)
- ozone (O3) - 0 (Good)
- nitrogen dioxide (NO2) - 0 (Good)
- sulfur dioxide (SO2) - 0 (Good)

What is the air quality in Qingshuitang today? Is the air polluted in Qingshuitang?. Is there smog?
What is the level of PM10 today in Qingshuitang? (particulate matter (PM10) suspended dust)
The current level of particulate matter PM10 in Qingshuitang is:
179 (Very bad Hazardous)
The highest PM10 values usually occur in month: 70 (January 2019).
The lowest value of particulate matter PM10 pollution in Qingshuitang is usually recorded in: July (26).
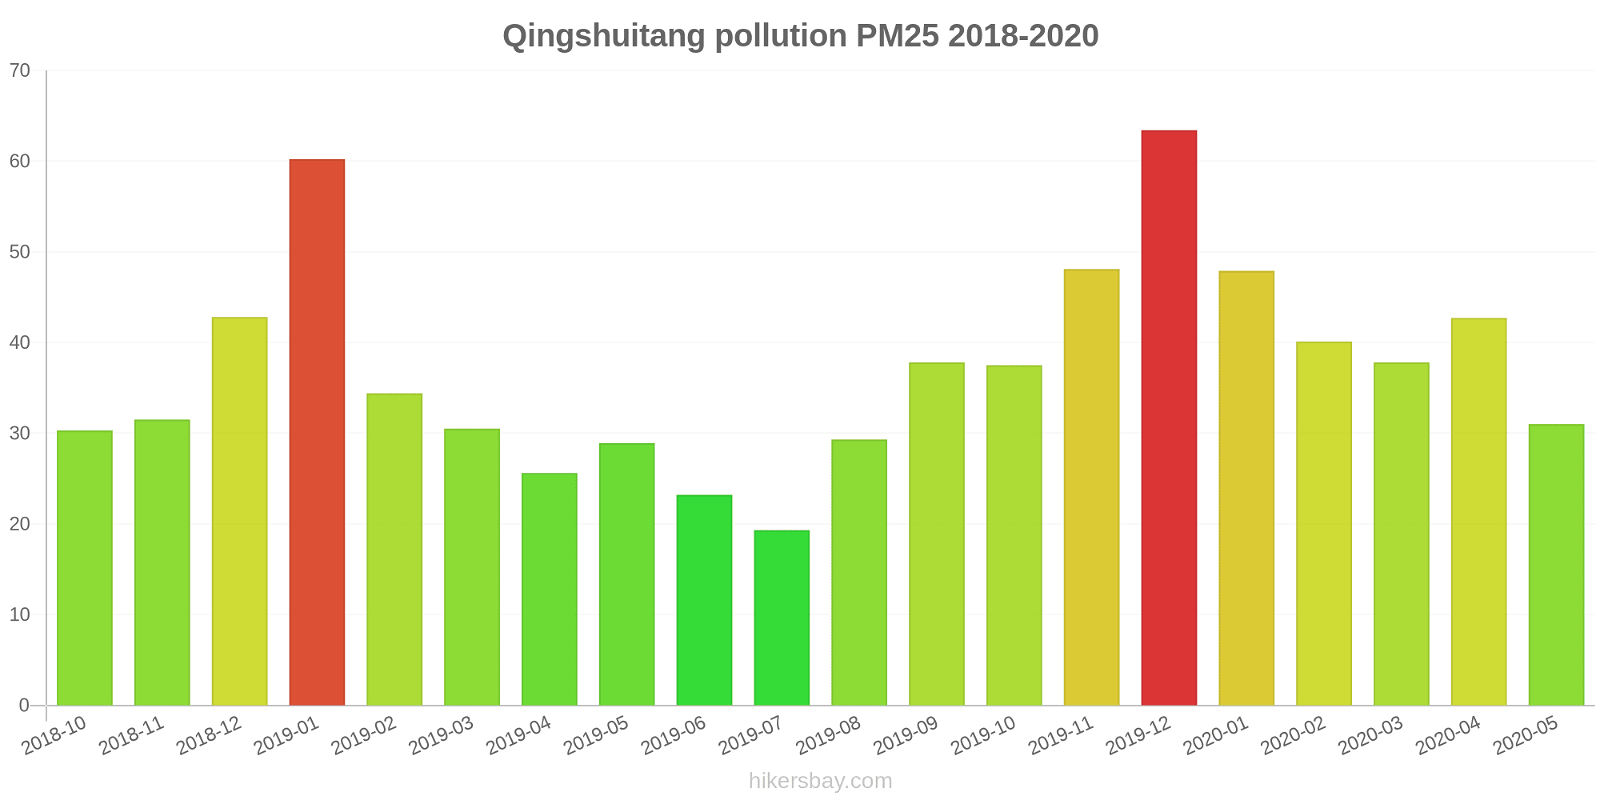
What is the current level of PM2.5 in Qingshuitang? (particulate matter (PM2.5) dust)
Today's PM2.5 level is:
35 (Unhealthy for Sensitive Groups)
For comparison, the highest level of PM2.5 in Qingshuitang in the last 7 days was: 56 (Friday, May 27, 2022) and the lowest: 56 (Friday, May 27, 2022).
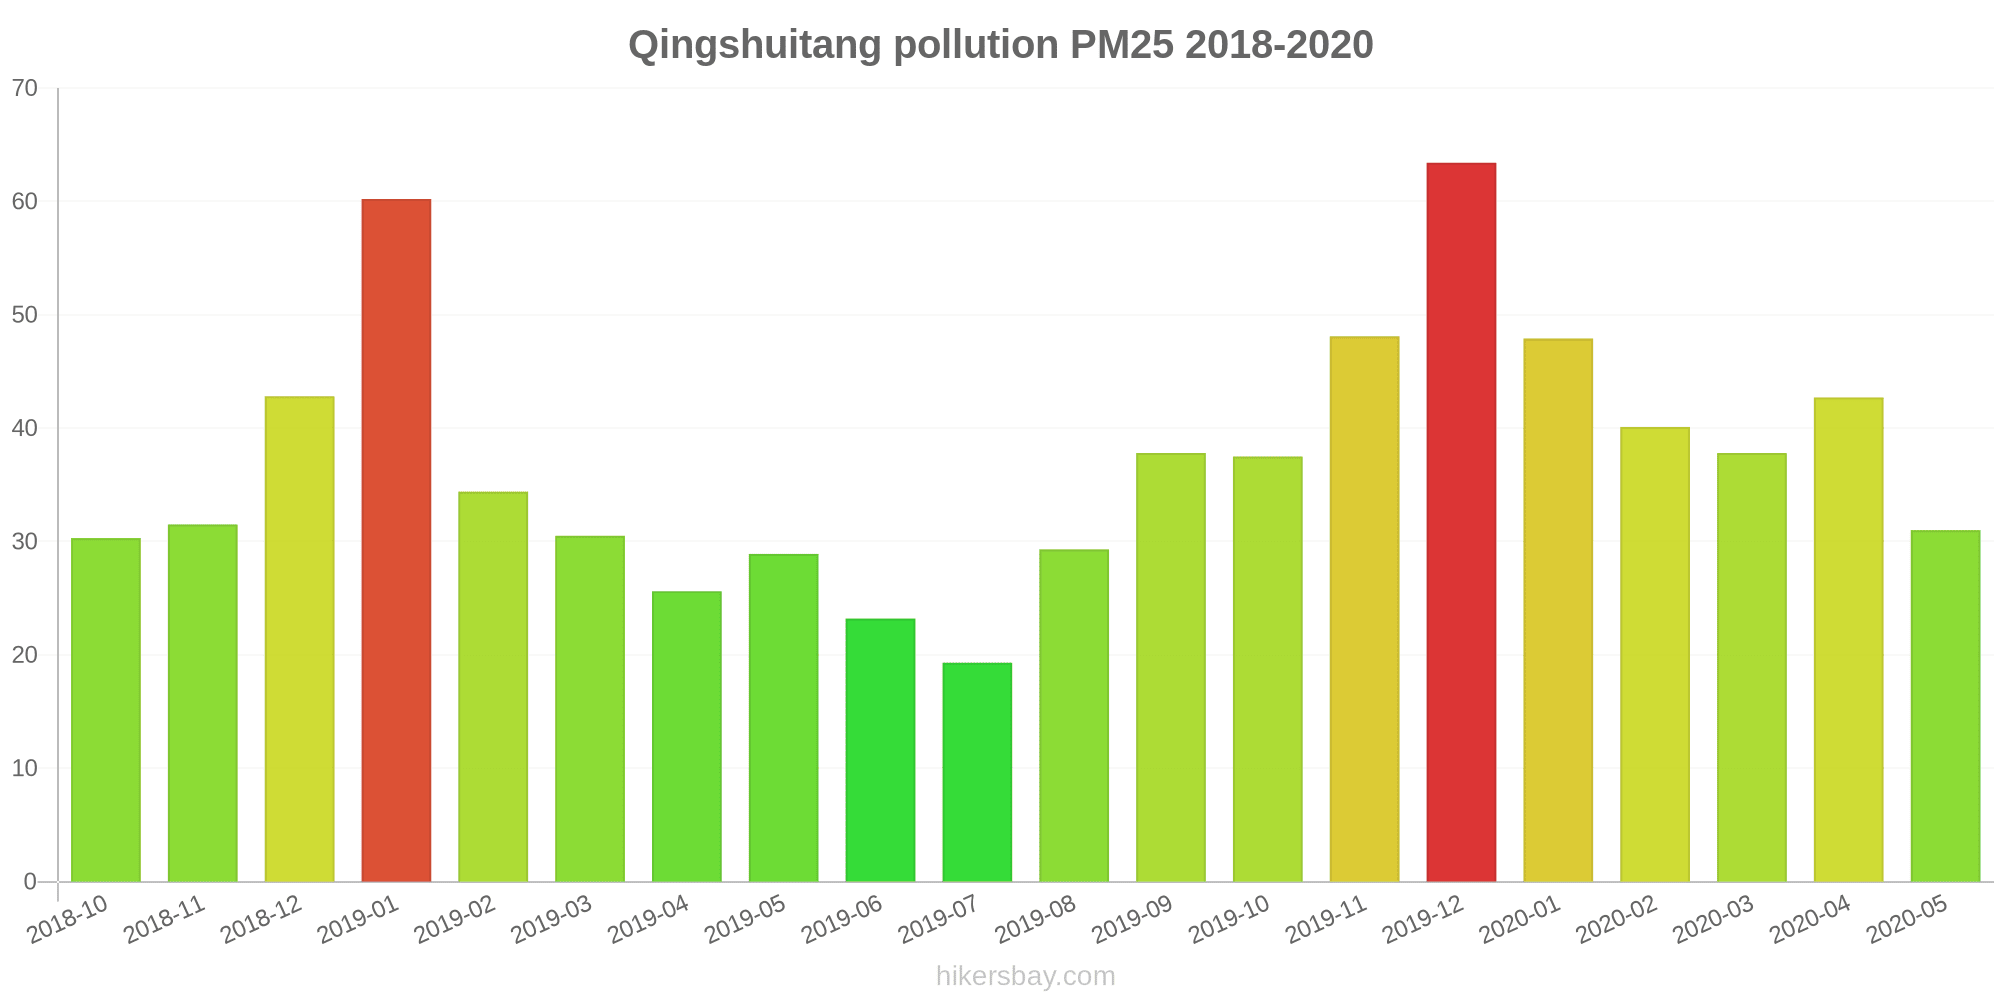
The highest PM2.5 values were recorded: 63 (December 2019).
The lowest level of particulate matter PM2.5 pollution occurs in month: July (19).
How is the O3 level today in Qingshuitang? (ozone (O3))
0 (Good)
How high is the level of NO2? (nitrogen dioxide (NO2))
0 (Good)
What is the level of SO2 pollution? (sulfur dioxide (SO2))
0 (Good)
Current data Friday, May 27, 2022, 12:00 PM
PM10 179 (Very bad Hazardous)
PM2,5 35 (Unhealthy for Sensitive Groups)
O3 0 (Good)
NO2 0 (Good)
SO2 0 (Good)
Data on air pollution from recent days in Qingshuitang
index
2022-05-27
pm10
56
Unhealthy for Sensitive Groups
pm25
56
Unhealthy
o3
0
Good
no2
0
Good
so2
0
Good
data source »
Air pollution in Qingshuitang from October 2018 to May 2020
index
2020-05
2020-04
2020-03
2020-02
2020-01
2019-12
2019-11
2019-10
2019-09
2019-08
2019-07
2019-06
2019-05
2019-04
2019-03
2019-02
2019-01
2018-12
2018-11
2018-10
pm25
31 (Moderate)
43 (Unhealthy for Sensitive Groups)
38 (Unhealthy for Sensitive Groups)
40 (Unhealthy for Sensitive Groups)
48 (Unhealthy for Sensitive Groups)
63 (Unhealthy)
48 (Unhealthy for Sensitive Groups)
38 (Unhealthy for Sensitive Groups)
38 (Unhealthy for Sensitive Groups)
29 (Moderate)
19 (Moderate)
23 (Moderate)
29 (Moderate)
26 (Moderate)
31 (Moderate)
34 (Moderate)
60 (Unhealthy)
43 (Unhealthy for Sensitive Groups)
32 (Moderate)
30 (Moderate)
co
458 (Good)
508 (Good)
658 (Good)
598 (Good)
595 (Good)
651 (Good)
702 (Good)
700 (Good)
700 (Good)
703 (Good)
551 (Good)
604 (Good)
686 (Good)
852 (Good)
877 (Good)
956 (Good)
1 (Good)
1 (Good)
875 (Good)
767 (Good)
no2
10 (Good)
13 (Good)
12 (Good)
9.5 (Good)
12 (Good)
18 (Good)
16 (Good)
12 (Good)
11 (Good)
7.1 (Good)
5.7 (Good)
5.4 (Good)
8.1 (Good)
8.8 (Good)
12 (Good)
12 (Good)
22 (Good)
18 (Good)
13 (Good)
12 (Good)
o3
114 (Moderate)
131 (Unhealthy for Sensitive Groups)
88 (Moderate)
73 (Moderate)
65 (Good)
93 (Moderate)
121 (Unhealthy for Sensitive Groups)
124 (Unhealthy for Sensitive Groups)
167 (Unhealthy)
140 (Unhealthy for Sensitive Groups)
104 (Moderate)
107 (Moderate)
115 (Moderate)
93 (Moderate)
95 (Moderate)
67 (Good)
70 (Good)
56 (Good)
86 (Moderate)
97 (Moderate)
pm10
44 (Moderate)
45 (Moderate)
41 (Moderate)
40 (Moderate)
48 (Moderate)
69 (Unhealthy for Sensitive Groups)
62 (Unhealthy for Sensitive Groups)
49 (Moderate)
50 (Unhealthy for Sensitive Groups)
37 (Moderate)
26 (Moderate)
30 (Moderate)
43 (Moderate)
36 (Moderate)
40 (Moderate)
44 (Moderate)
70 (Unhealthy for Sensitive Groups)
61 (Unhealthy for Sensitive Groups)
45 (Moderate)
43 (Moderate)
so2
10 (Good)
9.3 (Good)
9.3 (Good)
5.4 (Good)
6.8 (Good)
12 (Good)
9.9 (Good)
12 (Good)
13 (Good)
10 (Good)
7.7 (Good)
6.9 (Good)
7.4 (Good)
6.5 (Good)
10 (Good)
8.4 (Good)
11 (Good)
11 (Good)
7.9 (Good)
8 (Good)
data source »
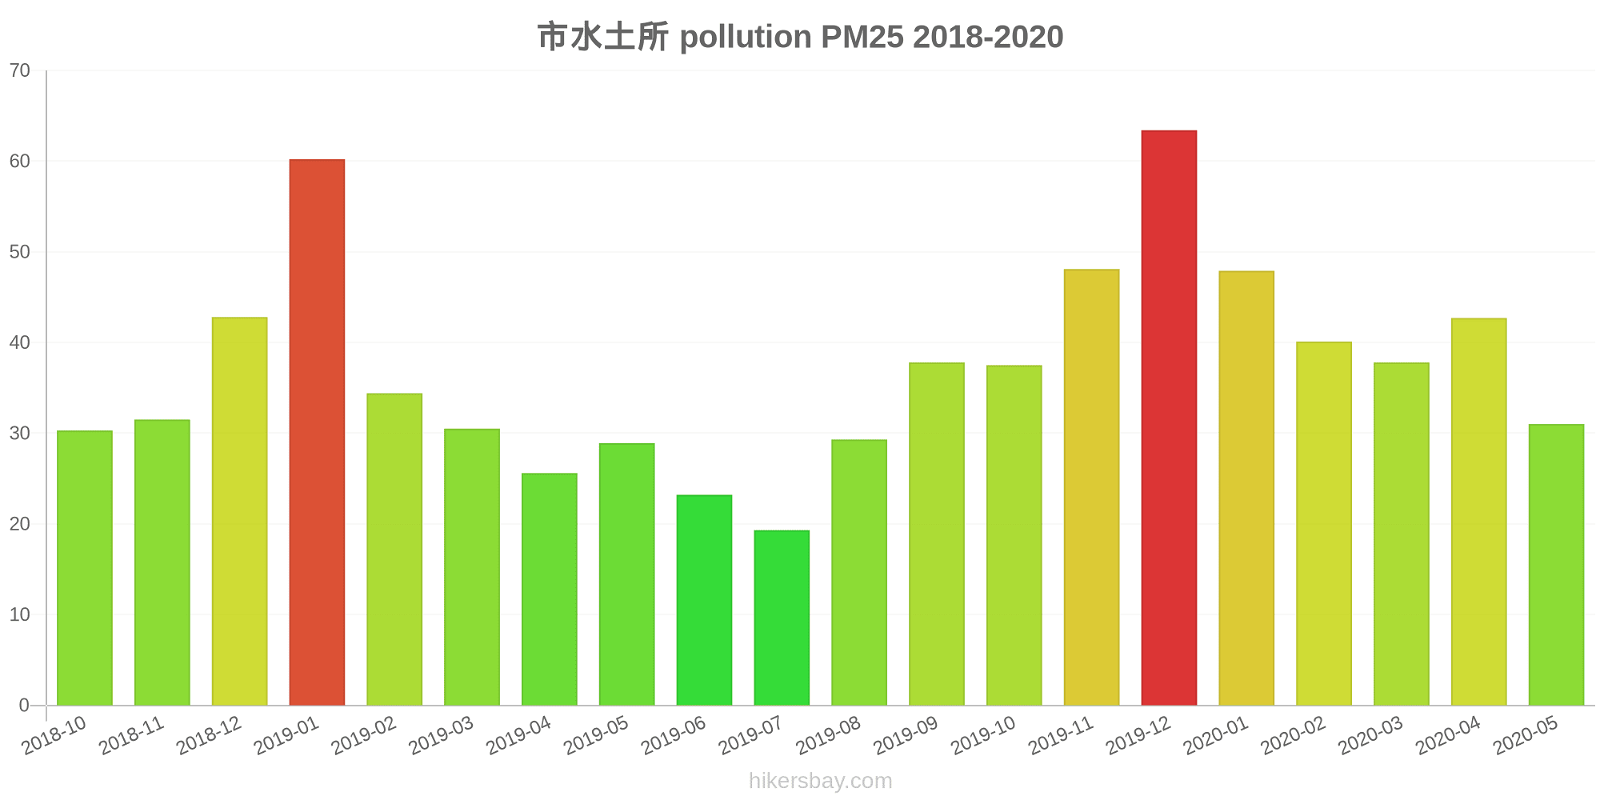
市水土所
Friday, May 27, 2022, 12:00 PM
PM10 179 (Very bad Hazardous)
particulate matter (PM10) suspended dust
PM2,5 35 (Unhealthy for Sensitive Groups)
particulate matter (PM2.5) dust
O3 0.04 (Good)
ozone (O3)
NO2 0 (Good)
nitrogen dioxide (NO2)
SO2 0 (Good)
sulfur dioxide (SO2)
市水土所
index
2022-05-27
pm10
56
pm25
56
o3
0.03
no2
0
so2
0
市水土所
2018-10 2020-05
index
2020-05
2020-04
2020-03
2020-02
2020-01
2019-12
2019-11
2019-10
2019-09
2019-08
2019-07
2019-06
2019-05
2019-04
2019-03
2019-02
2019-01
2018-12
2018-11
2018-10
pm25
31
43
38
40
48
63
48
38
38
29
19
23
29
26
31
34
60
43
32
30
co
458
508
658
598
595
651
702
700
700
703
551
604
686
852
877
956
1
1
875
767
no2
10
13
12
9.5
12
18
16
12
11
7.1
5.7
5.4
8.1
8.8
12
12
22
18
13
12
o3
114
131
88
73
65
93
121
124
167
140
104
107
115
93
95
67
70
56
86
97
pm10
44
45
41
40
48
69
62
49
50
37
26
30
43
36
40
44
70
61
45
43
so2
10
9.3
9.3
5.4
6.8
12
9.9
12
13
10
7.7
6.9
7.4
6.5
10
8.4
11
11
7.9
8
* Pollution data source:
https://openaq.org
(ChinaAQIData)
The data is licensed under CC-By 4.0
PM10 179 (Very bad Hazardous)
PM2,5 35 (Unhealthy for Sensitive Groups)
O3 0 (Good)
NO2 0 (Good)
SO2 0 (Good)
Data on air pollution from recent days in Qingshuitang
| index | 2022-05-27 |
|---|---|
| pm10 | 56 Unhealthy for Sensitive Groups |
| pm25 | 56 Unhealthy |
| o3 | 0 Good |
| no2 | 0 Good |
| so2 | 0 Good |
| index | 2020-05 | 2020-04 | 2020-03 | 2020-02 | 2020-01 | 2019-12 | 2019-11 | 2019-10 | 2019-09 | 2019-08 | 2019-07 | 2019-06 | 2019-05 | 2019-04 | 2019-03 | 2019-02 | 2019-01 | 2018-12 | 2018-11 | 2018-10 |
|---|---|---|---|---|---|---|---|---|---|---|---|---|---|---|---|---|---|---|---|---|
| pm25 | 31 (Moderate) | 43 (Unhealthy for Sensitive Groups) | 38 (Unhealthy for Sensitive Groups) | 40 (Unhealthy for Sensitive Groups) | 48 (Unhealthy for Sensitive Groups) | 63 (Unhealthy) | 48 (Unhealthy for Sensitive Groups) | 38 (Unhealthy for Sensitive Groups) | 38 (Unhealthy for Sensitive Groups) | 29 (Moderate) | 19 (Moderate) | 23 (Moderate) | 29 (Moderate) | 26 (Moderate) | 31 (Moderate) | 34 (Moderate) | 60 (Unhealthy) | 43 (Unhealthy for Sensitive Groups) | 32 (Moderate) | 30 (Moderate) |
| co | 458 (Good) | 508 (Good) | 658 (Good) | 598 (Good) | 595 (Good) | 651 (Good) | 702 (Good) | 700 (Good) | 700 (Good) | 703 (Good) | 551 (Good) | 604 (Good) | 686 (Good) | 852 (Good) | 877 (Good) | 956 (Good) | 1 (Good) | 1 (Good) | 875 (Good) | 767 (Good) |
| no2 | 10 (Good) | 13 (Good) | 12 (Good) | 9.5 (Good) | 12 (Good) | 18 (Good) | 16 (Good) | 12 (Good) | 11 (Good) | 7.1 (Good) | 5.7 (Good) | 5.4 (Good) | 8.1 (Good) | 8.8 (Good) | 12 (Good) | 12 (Good) | 22 (Good) | 18 (Good) | 13 (Good) | 12 (Good) |
| o3 | 114 (Moderate) | 131 (Unhealthy for Sensitive Groups) | 88 (Moderate) | 73 (Moderate) | 65 (Good) | 93 (Moderate) | 121 (Unhealthy for Sensitive Groups) | 124 (Unhealthy for Sensitive Groups) | 167 (Unhealthy) | 140 (Unhealthy for Sensitive Groups) | 104 (Moderate) | 107 (Moderate) | 115 (Moderate) | 93 (Moderate) | 95 (Moderate) | 67 (Good) | 70 (Good) | 56 (Good) | 86 (Moderate) | 97 (Moderate) |
| pm10 | 44 (Moderate) | 45 (Moderate) | 41 (Moderate) | 40 (Moderate) | 48 (Moderate) | 69 (Unhealthy for Sensitive Groups) | 62 (Unhealthy for Sensitive Groups) | 49 (Moderate) | 50 (Unhealthy for Sensitive Groups) | 37 (Moderate) | 26 (Moderate) | 30 (Moderate) | 43 (Moderate) | 36 (Moderate) | 40 (Moderate) | 44 (Moderate) | 70 (Unhealthy for Sensitive Groups) | 61 (Unhealthy for Sensitive Groups) | 45 (Moderate) | 43 (Moderate) |
| so2 | 10 (Good) | 9.3 (Good) | 9.3 (Good) | 5.4 (Good) | 6.8 (Good) | 12 (Good) | 9.9 (Good) | 12 (Good) | 13 (Good) | 10 (Good) | 7.7 (Good) | 6.9 (Good) | 7.4 (Good) | 6.5 (Good) | 10 (Good) | 8.4 (Good) | 11 (Good) | 11 (Good) | 7.9 (Good) | 8 (Good) |
PM10 179 (Very bad Hazardous)
particulate matter (PM10) suspended dustPM2,5 35 (Unhealthy for Sensitive Groups)
particulate matter (PM2.5) dustO3 0.04 (Good)
ozone (O3)NO2 0 (Good)
nitrogen dioxide (NO2)SO2 0 (Good)
sulfur dioxide (SO2)市水土所
| index | 2022-05-27 |
|---|---|
| pm10 | 56 |
| pm25 | 56 |
| o3 | 0.03 |
| no2 | 0 |
| so2 | 0 |
市水土所

| index | 2020-05 | 2020-04 | 2020-03 | 2020-02 | 2020-01 | 2019-12 | 2019-11 | 2019-10 | 2019-09 | 2019-08 | 2019-07 | 2019-06 | 2019-05 | 2019-04 | 2019-03 | 2019-02 | 2019-01 | 2018-12 | 2018-11 | 2018-10 |
|---|---|---|---|---|---|---|---|---|---|---|---|---|---|---|---|---|---|---|---|---|
| pm25 | 31 | 43 | 38 | 40 | 48 | 63 | 48 | 38 | 38 | 29 | 19 | 23 | 29 | 26 | 31 | 34 | 60 | 43 | 32 | 30 |
| co | 458 | 508 | 658 | 598 | 595 | 651 | 702 | 700 | 700 | 703 | 551 | 604 | 686 | 852 | 877 | 956 | 1 | 1 | 875 | 767 |
| no2 | 10 | 13 | 12 | 9.5 | 12 | 18 | 16 | 12 | 11 | 7.1 | 5.7 | 5.4 | 8.1 | 8.8 | 12 | 12 | 22 | 18 | 13 | 12 |
| o3 | 114 | 131 | 88 | 73 | 65 | 93 | 121 | 124 | 167 | 140 | 104 | 107 | 115 | 93 | 95 | 67 | 70 | 56 | 86 | 97 |
| pm10 | 44 | 45 | 41 | 40 | 48 | 69 | 62 | 49 | 50 | 37 | 26 | 30 | 43 | 36 | 40 | 44 | 70 | 61 | 45 | 43 |
| so2 | 10 | 9.3 | 9.3 | 5.4 | 6.8 | 12 | 9.9 | 12 | 13 | 10 | 7.7 | 6.9 | 7.4 | 6.5 | 10 | 8.4 | 11 | 11 | 7.9 | 8 |