Air Pollution in Shuntianqiao: Real-time Air Quality Index and smog alert.
Pollution and air quality forecast for Shuntianqiao. Today is Tuesday, June 16, 2026. The following air pollution values have been recorded for Shuntianqiao:- particulate matter (PM10) suspended dust - 179 (Very bad Hazardous)
- particulate matter (PM2.5) dust - 35 (Unhealthy for Sensitive Groups)
- ozone (O3) - 0 (Good)
- nitrogen dioxide (NO2) - 0 (Good)
- sulfur dioxide (SO2) - 0 (Good)

What is the air quality in Shuntianqiao today? Is the air polluted in Shuntianqiao?. Is there smog?
What is the level of PM10 today in Shuntianqiao? (particulate matter (PM10) suspended dust)
The current level of particulate matter PM10 in Shuntianqiao is:
179 (Very bad Hazardous)
The highest PM10 values usually occur in month: 110 (January 2019).
The lowest value of particulate matter PM10 pollution in Shuntianqiao is usually recorded in: July (44).
What is the current level of PM2.5 in Shuntianqiao? (particulate matter (PM2.5) dust)
Today's PM2.5 level is:
35 (Unhealthy for Sensitive Groups)
For comparison, the highest level of PM2.5 in Shuntianqiao in the last 7 days was: 56 (Friday, May 27, 2022) and the lowest: 56 (Friday, May 27, 2022).
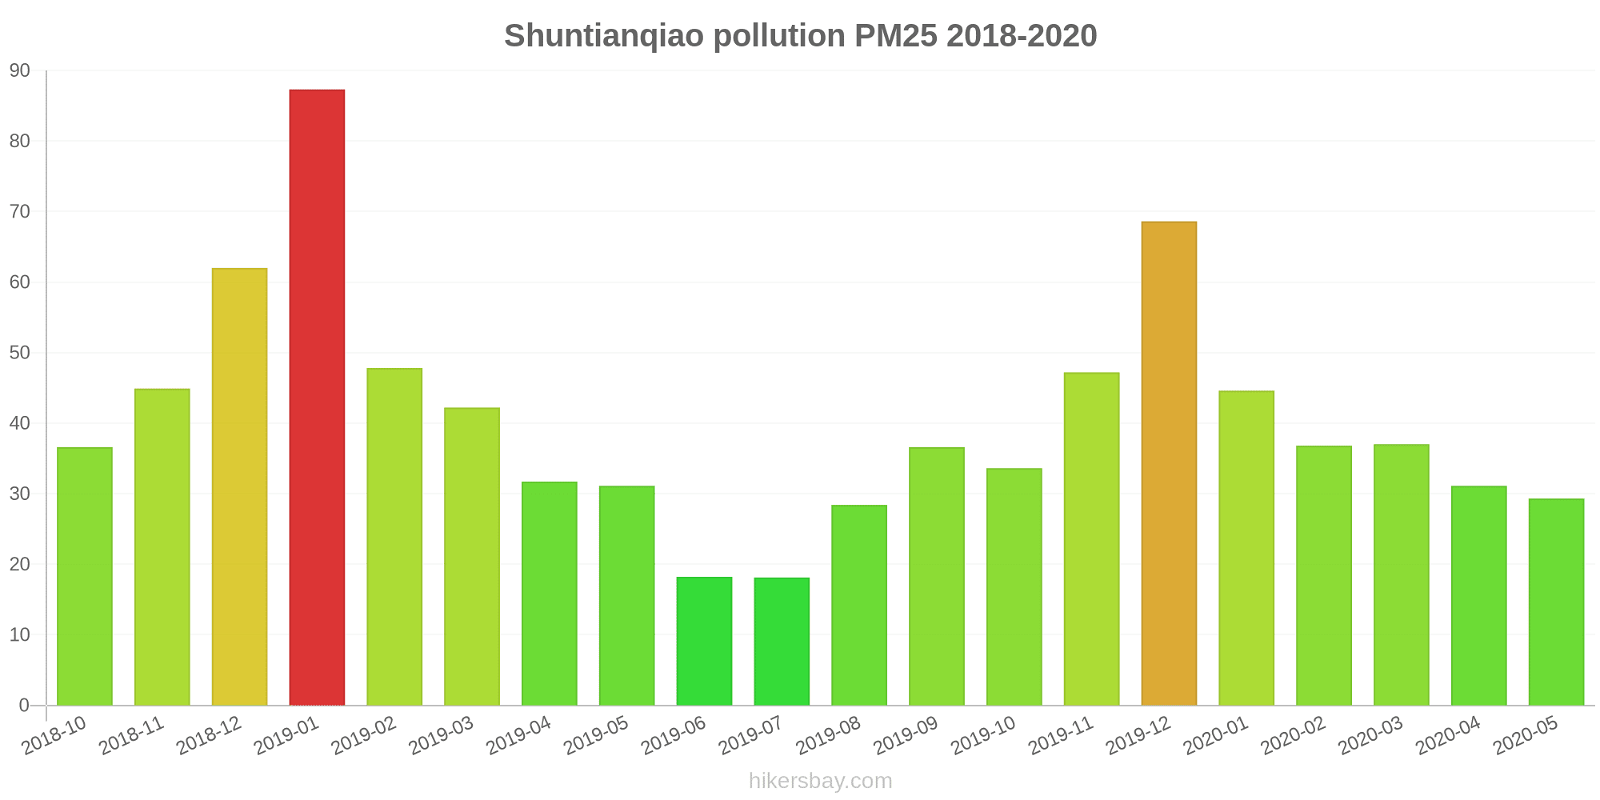
The highest PM2.5 values were recorded: 87 (January 2019).
The lowest level of particulate matter PM2.5 pollution occurs in month: July (18).
How is the O3 level today in Shuntianqiao? (ozone (O3))
0 (Good)
How high is the level of NO2? (nitrogen dioxide (NO2))
0 (Good)
What is the level of SO2 pollution? (sulfur dioxide (SO2))
0 (Good)
Current data Friday, May 27, 2022, 12:00 PM
PM10 179 (Very bad Hazardous)
PM2,5 35 (Unhealthy for Sensitive Groups)
O3 0 (Good)
NO2 0 (Good)
SO2 0 (Good)
Data on air pollution from recent days in Shuntianqiao
index
2022-05-27
pm10
56
Unhealthy for Sensitive Groups
pm25
56
Unhealthy
o3
0
Good
no2
0
Good
so2
0
Good
data source »
Air pollution in Shuntianqiao from October 2018 to May 2020
index
2020-05
2020-04
2020-03
2020-02
2020-01
2019-12
2019-11
2019-10
2019-09
2019-08
2019-07
2019-06
2019-05
2019-04
2019-03
2019-02
2019-01
2018-12
2018-11
2018-10
pm25
29 (Moderate)
31 (Moderate)
37 (Unhealthy for Sensitive Groups)
37 (Unhealthy for Sensitive Groups)
45 (Unhealthy for Sensitive Groups)
69 (Unhealthy)
47 (Unhealthy for Sensitive Groups)
34 (Moderate)
37 (Unhealthy for Sensitive Groups)
28 (Moderate)
18 (Moderate)
18 (Moderate)
31 (Moderate)
32 (Moderate)
42 (Unhealthy for Sensitive Groups)
48 (Unhealthy for Sensitive Groups)
87 (Very Unhealthy)
62 (Unhealthy)
45 (Unhealthy for Sensitive Groups)
37 (Unhealthy for Sensitive Groups)
co
1 (Good)
885 (Good)
900 (Good)
933 (Good)
994 (Good)
929 (Good)
783 (Good)
828 (Good)
1 (Good)
1 (Good)
1 (Good)
1 (Good)
989 (Good)
1 (Good)
969 (Good)
1 (Good)
1 (Good)
1 (Good)
1 (Good)
802 (Good)
no2
8.8 (Good)
20 (Good)
9.4 (Good)
3.3 (Good)
11 (Good)
27 (Good)
26 (Good)
22 (Good)
29 (Good)
23 (Good)
21 (Good)
14 (Good)
17 (Good)
15 (Good)
19 (Good)
6.8 (Good)
18 (Good)
17 (Good)
22 (Good)
22 (Good)
o3
104 (Moderate)
116 (Moderate)
88 (Moderate)
70 (Moderate)
64 (Good)
85 (Moderate)
88 (Moderate)
100 (Moderate)
139 (Unhealthy for Sensitive Groups)
118 (Moderate)
89 (Moderate)
90 (Moderate)
94 (Moderate)
92 (Moderate)
88 (Moderate)
66 (Good)
59 (Good)
53 (Good)
74 (Moderate)
84 (Moderate)
pm10
56 (Unhealthy for Sensitive Groups)
66 (Unhealthy for Sensitive Groups)
61 (Unhealthy for Sensitive Groups)
46 (Moderate)
54 (Unhealthy for Sensitive Groups)
90 (Unhealthy)
83 (Unhealthy)
61 (Unhealthy for Sensitive Groups)
74 (Unhealthy for Sensitive Groups)
59 (Unhealthy for Sensitive Groups)
44 (Moderate)
47 (Moderate)
75 (Unhealthy for Sensitive Groups)
61 (Unhealthy for Sensitive Groups)
74 (Unhealthy for Sensitive Groups)
66 (Unhealthy for Sensitive Groups)
110 (Very Unhealthy)
91 (Unhealthy)
68 (Unhealthy for Sensitive Groups)
71 (Unhealthy for Sensitive Groups)
so2
7.9 (Good)
12 (Good)
8.2 (Good)
1.9 (Good)
3.1 (Good)
13 (Good)
13 (Good)
7.5 (Good)
10 (Good)
7.9 (Good)
5.4 (Good)
7.8 (Good)
8 (Good)
6 (Good)
7.7 (Good)
2.9 (Good)
6.3 (Good)
7.7 (Good)
7.1 (Good)
7.1 (Good)
data source »
监测楼
Friday, May 27, 2022, 12:00 PM
PM10 179 (Very bad Hazardous)
particulate matter (PM10) suspended dust
PM2,5 35 (Unhealthy for Sensitive Groups)
particulate matter (PM2.5) dust
O3 0.04 (Good)
ozone (O3)
NO2 0 (Good)
nitrogen dioxide (NO2)
SO2 0 (Good)
sulfur dioxide (SO2)
监测楼
index
2022-05-27
pm10
56
pm25
56
o3
0.03
no2
0
so2
0
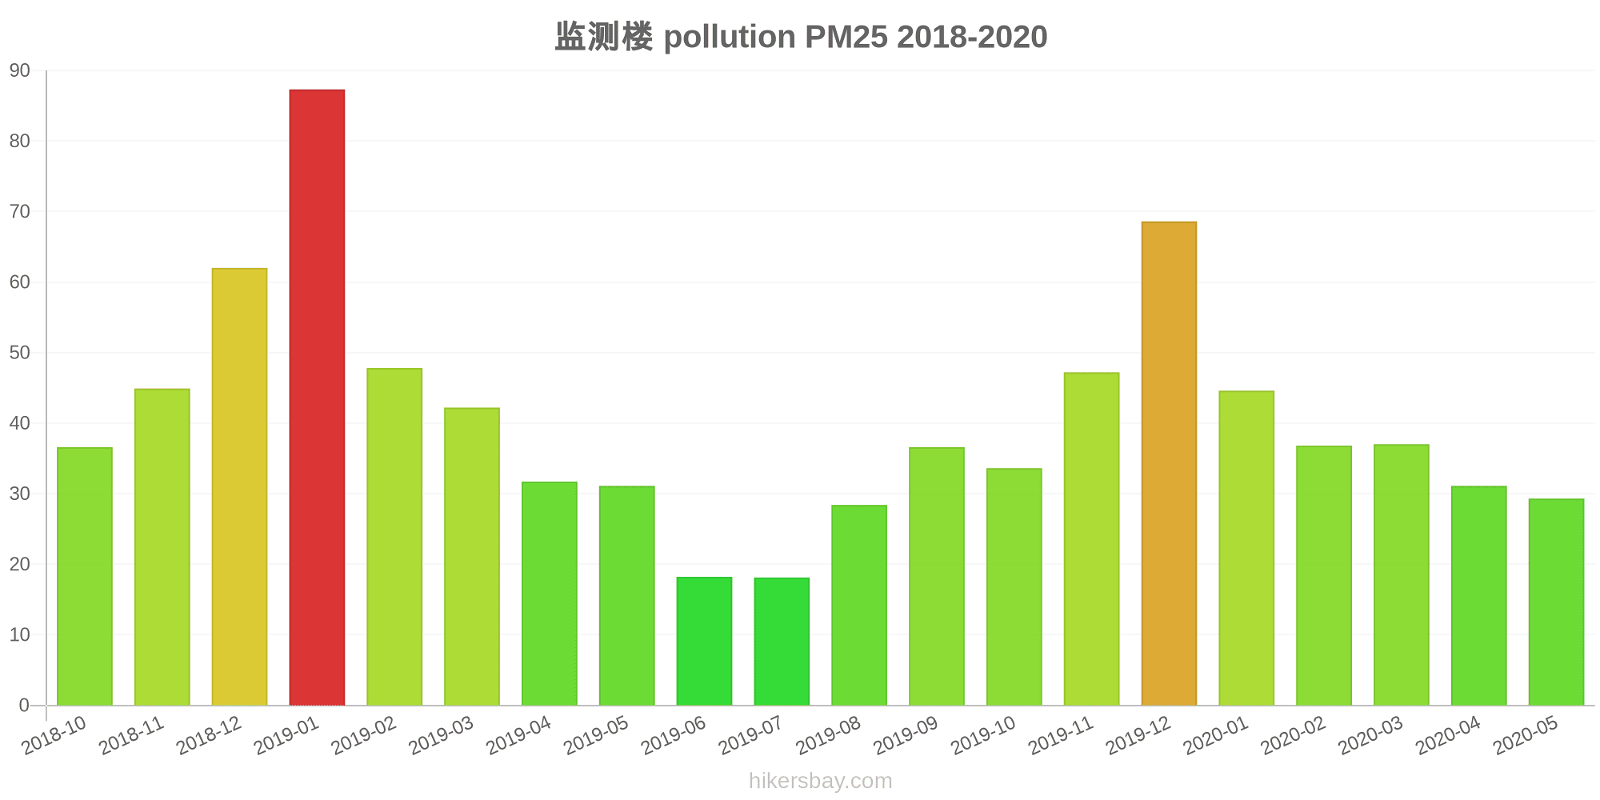
监测楼
2018-10 2020-05
index
2020-05
2020-04
2020-03
2020-02
2020-01
2019-12
2019-11
2019-10
2019-09
2019-08
2019-07
2019-06
2019-05
2019-04
2019-03
2019-02
2019-01
2018-12
2018-11
2018-10
pm25
29
31
37
37
45
69
47
34
37
28
18
18
31
32
42
48
87
62
45
37
co
1
885
900
933
994
929
783
828
1
1
1
1
989
1
969
1
1
1
1
802
no2
8.8
20
9.4
3.3
11
27
26
22
29
23
21
14
17
15
19
6.8
18
17
22
22
o3
104
116
88
70
64
85
88
100
139
118
89
90
94
92
88
66
59
53
74
84
pm10
56
66
61
46
54
90
83
61
74
59
44
47
75
61
74
66
110
91
68
71
so2
7.9
12
8.2
1.9
3.1
13
13
7.5
10
7.9
5.4
7.8
8
6
7.7
2.9
6.3
7.7
7.1
7.1
* Pollution data source:
https://openaq.org
(ChinaAQIData)
The data is licensed under CC-By 4.0
PM10 179 (Very bad Hazardous)
PM2,5 35 (Unhealthy for Sensitive Groups)
O3 0 (Good)
NO2 0 (Good)
SO2 0 (Good)
Data on air pollution from recent days in Shuntianqiao
| index | 2022-05-27 |
|---|---|
| pm10 | 56 Unhealthy for Sensitive Groups |
| pm25 | 56 Unhealthy |
| o3 | 0 Good |
| no2 | 0 Good |
| so2 | 0 Good |

| index | 2020-05 | 2020-04 | 2020-03 | 2020-02 | 2020-01 | 2019-12 | 2019-11 | 2019-10 | 2019-09 | 2019-08 | 2019-07 | 2019-06 | 2019-05 | 2019-04 | 2019-03 | 2019-02 | 2019-01 | 2018-12 | 2018-11 | 2018-10 |
|---|---|---|---|---|---|---|---|---|---|---|---|---|---|---|---|---|---|---|---|---|
| pm25 | 29 (Moderate) | 31 (Moderate) | 37 (Unhealthy for Sensitive Groups) | 37 (Unhealthy for Sensitive Groups) | 45 (Unhealthy for Sensitive Groups) | 69 (Unhealthy) | 47 (Unhealthy for Sensitive Groups) | 34 (Moderate) | 37 (Unhealthy for Sensitive Groups) | 28 (Moderate) | 18 (Moderate) | 18 (Moderate) | 31 (Moderate) | 32 (Moderate) | 42 (Unhealthy for Sensitive Groups) | 48 (Unhealthy for Sensitive Groups) | 87 (Very Unhealthy) | 62 (Unhealthy) | 45 (Unhealthy for Sensitive Groups) | 37 (Unhealthy for Sensitive Groups) |
| co | 1 (Good) | 885 (Good) | 900 (Good) | 933 (Good) | 994 (Good) | 929 (Good) | 783 (Good) | 828 (Good) | 1 (Good) | 1 (Good) | 1 (Good) | 1 (Good) | 989 (Good) | 1 (Good) | 969 (Good) | 1 (Good) | 1 (Good) | 1 (Good) | 1 (Good) | 802 (Good) |
| no2 | 8.8 (Good) | 20 (Good) | 9.4 (Good) | 3.3 (Good) | 11 (Good) | 27 (Good) | 26 (Good) | 22 (Good) | 29 (Good) | 23 (Good) | 21 (Good) | 14 (Good) | 17 (Good) | 15 (Good) | 19 (Good) | 6.8 (Good) | 18 (Good) | 17 (Good) | 22 (Good) | 22 (Good) |
| o3 | 104 (Moderate) | 116 (Moderate) | 88 (Moderate) | 70 (Moderate) | 64 (Good) | 85 (Moderate) | 88 (Moderate) | 100 (Moderate) | 139 (Unhealthy for Sensitive Groups) | 118 (Moderate) | 89 (Moderate) | 90 (Moderate) | 94 (Moderate) | 92 (Moderate) | 88 (Moderate) | 66 (Good) | 59 (Good) | 53 (Good) | 74 (Moderate) | 84 (Moderate) |
| pm10 | 56 (Unhealthy for Sensitive Groups) | 66 (Unhealthy for Sensitive Groups) | 61 (Unhealthy for Sensitive Groups) | 46 (Moderate) | 54 (Unhealthy for Sensitive Groups) | 90 (Unhealthy) | 83 (Unhealthy) | 61 (Unhealthy for Sensitive Groups) | 74 (Unhealthy for Sensitive Groups) | 59 (Unhealthy for Sensitive Groups) | 44 (Moderate) | 47 (Moderate) | 75 (Unhealthy for Sensitive Groups) | 61 (Unhealthy for Sensitive Groups) | 74 (Unhealthy for Sensitive Groups) | 66 (Unhealthy for Sensitive Groups) | 110 (Very Unhealthy) | 91 (Unhealthy) | 68 (Unhealthy for Sensitive Groups) | 71 (Unhealthy for Sensitive Groups) |
| so2 | 7.9 (Good) | 12 (Good) | 8.2 (Good) | 1.9 (Good) | 3.1 (Good) | 13 (Good) | 13 (Good) | 7.5 (Good) | 10 (Good) | 7.9 (Good) | 5.4 (Good) | 7.8 (Good) | 8 (Good) | 6 (Good) | 7.7 (Good) | 2.9 (Good) | 6.3 (Good) | 7.7 (Good) | 7.1 (Good) | 7.1 (Good) |
PM10 179 (Very bad Hazardous)
particulate matter (PM10) suspended dustPM2,5 35 (Unhealthy for Sensitive Groups)
particulate matter (PM2.5) dustO3 0.04 (Good)
ozone (O3)NO2 0 (Good)
nitrogen dioxide (NO2)SO2 0 (Good)
sulfur dioxide (SO2)监测楼
| index | 2022-05-27 |
|---|---|
| pm10 | 56 |
| pm25 | 56 |
| o3 | 0.03 |
| no2 | 0 |
| so2 | 0 |
监测楼

| index | 2020-05 | 2020-04 | 2020-03 | 2020-02 | 2020-01 | 2019-12 | 2019-11 | 2019-10 | 2019-09 | 2019-08 | 2019-07 | 2019-06 | 2019-05 | 2019-04 | 2019-03 | 2019-02 | 2019-01 | 2018-12 | 2018-11 | 2018-10 |
|---|---|---|---|---|---|---|---|---|---|---|---|---|---|---|---|---|---|---|---|---|
| pm25 | 29 | 31 | 37 | 37 | 45 | 69 | 47 | 34 | 37 | 28 | 18 | 18 | 31 | 32 | 42 | 48 | 87 | 62 | 45 | 37 |
| co | 1 | 885 | 900 | 933 | 994 | 929 | 783 | 828 | 1 | 1 | 1 | 1 | 989 | 1 | 969 | 1 | 1 | 1 | 1 | 802 |
| no2 | 8.8 | 20 | 9.4 | 3.3 | 11 | 27 | 26 | 22 | 29 | 23 | 21 | 14 | 17 | 15 | 19 | 6.8 | 18 | 17 | 22 | 22 |
| o3 | 104 | 116 | 88 | 70 | 64 | 85 | 88 | 100 | 139 | 118 | 89 | 90 | 94 | 92 | 88 | 66 | 59 | 53 | 74 | 84 |
| pm10 | 56 | 66 | 61 | 46 | 54 | 90 | 83 | 61 | 74 | 59 | 44 | 47 | 75 | 61 | 74 | 66 | 110 | 91 | 68 | 71 |
| so2 | 7.9 | 12 | 8.2 | 1.9 | 3.1 | 13 | 13 | 7.5 | 10 | 7.9 | 5.4 | 7.8 | 8 | 6 | 7.7 | 2.9 | 6.3 | 7.7 | 7.1 | 7.1 |