Air Pollution in Zhengjia: Real-time Air Quality Index and smog alert.
Pollution and air quality forecast for Zhengjia. Today is Tuesday, June 2, 2026. The following air pollution values have been recorded for Zhengjia:- particulate matter (PM10) suspended dust - 179 (Very bad Hazardous)
- particulate matter (PM2.5) dust - 35 (Unhealthy for Sensitive Groups)
- ozone (O3) - 0 (Good)
- nitrogen dioxide (NO2) - 0 (Good)
- sulfur dioxide (SO2) - 0 (Good)

What is the air quality in Zhengjia today? Is the air polluted in Zhengjia?. Is there smog?
What is the level of PM10 today in Zhengjia? (particulate matter (PM10) suspended dust)
The current level of particulate matter PM10 in Zhengjia is:
179 (Very bad Hazardous)
The highest PM10 values usually occur in month: 192 (February 2019).
The lowest value of particulate matter PM10 pollution in Zhengjia is usually recorded in: August (62).
What is the current level of PM2.5 in Zhengjia? (particulate matter (PM2.5) dust)
Today's PM2.5 level is:
35 (Unhealthy for Sensitive Groups)
For comparison, the highest level of PM2.5 in Zhengjia in the last 7 days was: 56 (Friday, May 27, 2022) and the lowest: 56 (Friday, May 27, 2022).
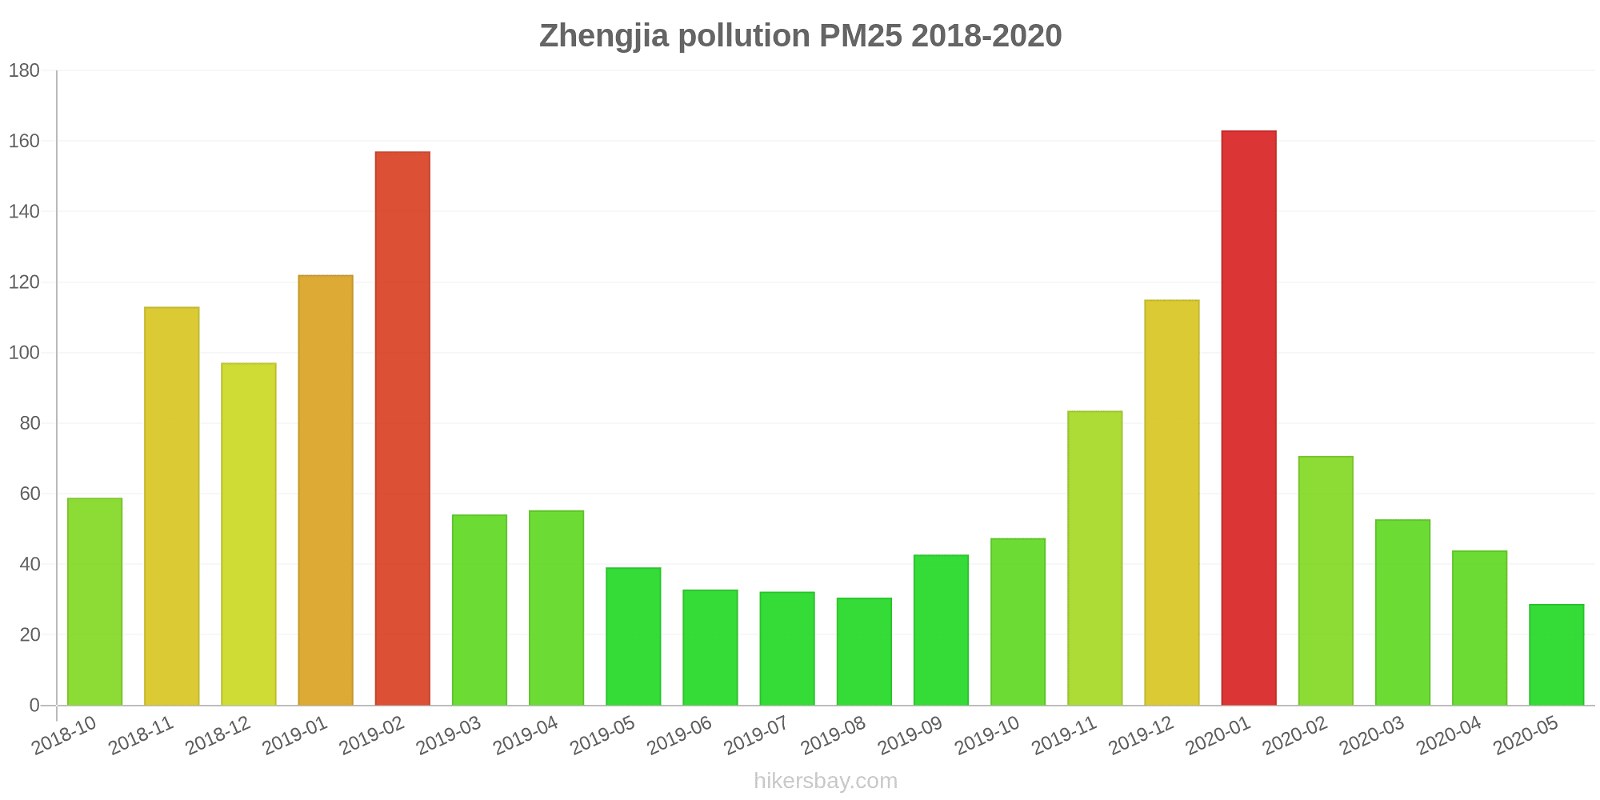
The highest PM2.5 values were recorded: 163 (January 2020).
The lowest level of particulate matter PM2.5 pollution occurs in month: May (29).
How is the O3 level today in Zhengjia? (ozone (O3))
0 (Good)
How high is the level of NO2? (nitrogen dioxide (NO2))
0 (Good)
What is the level of SO2 pollution? (sulfur dioxide (SO2))
0 (Good)
Current data Friday, May 27, 2022, 12:00 PM
PM10 179 (Very bad Hazardous)
PM2,5 35 (Unhealthy for Sensitive Groups)
O3 0 (Good)
NO2 0 (Good)
SO2 0 (Good)
Data on air pollution from recent days in Zhengjia
index
2022-05-27
pm10
56
Unhealthy for Sensitive Groups
pm25
56
Unhealthy
o3
0
Good
no2
0
Good
so2
0
Good
data source »
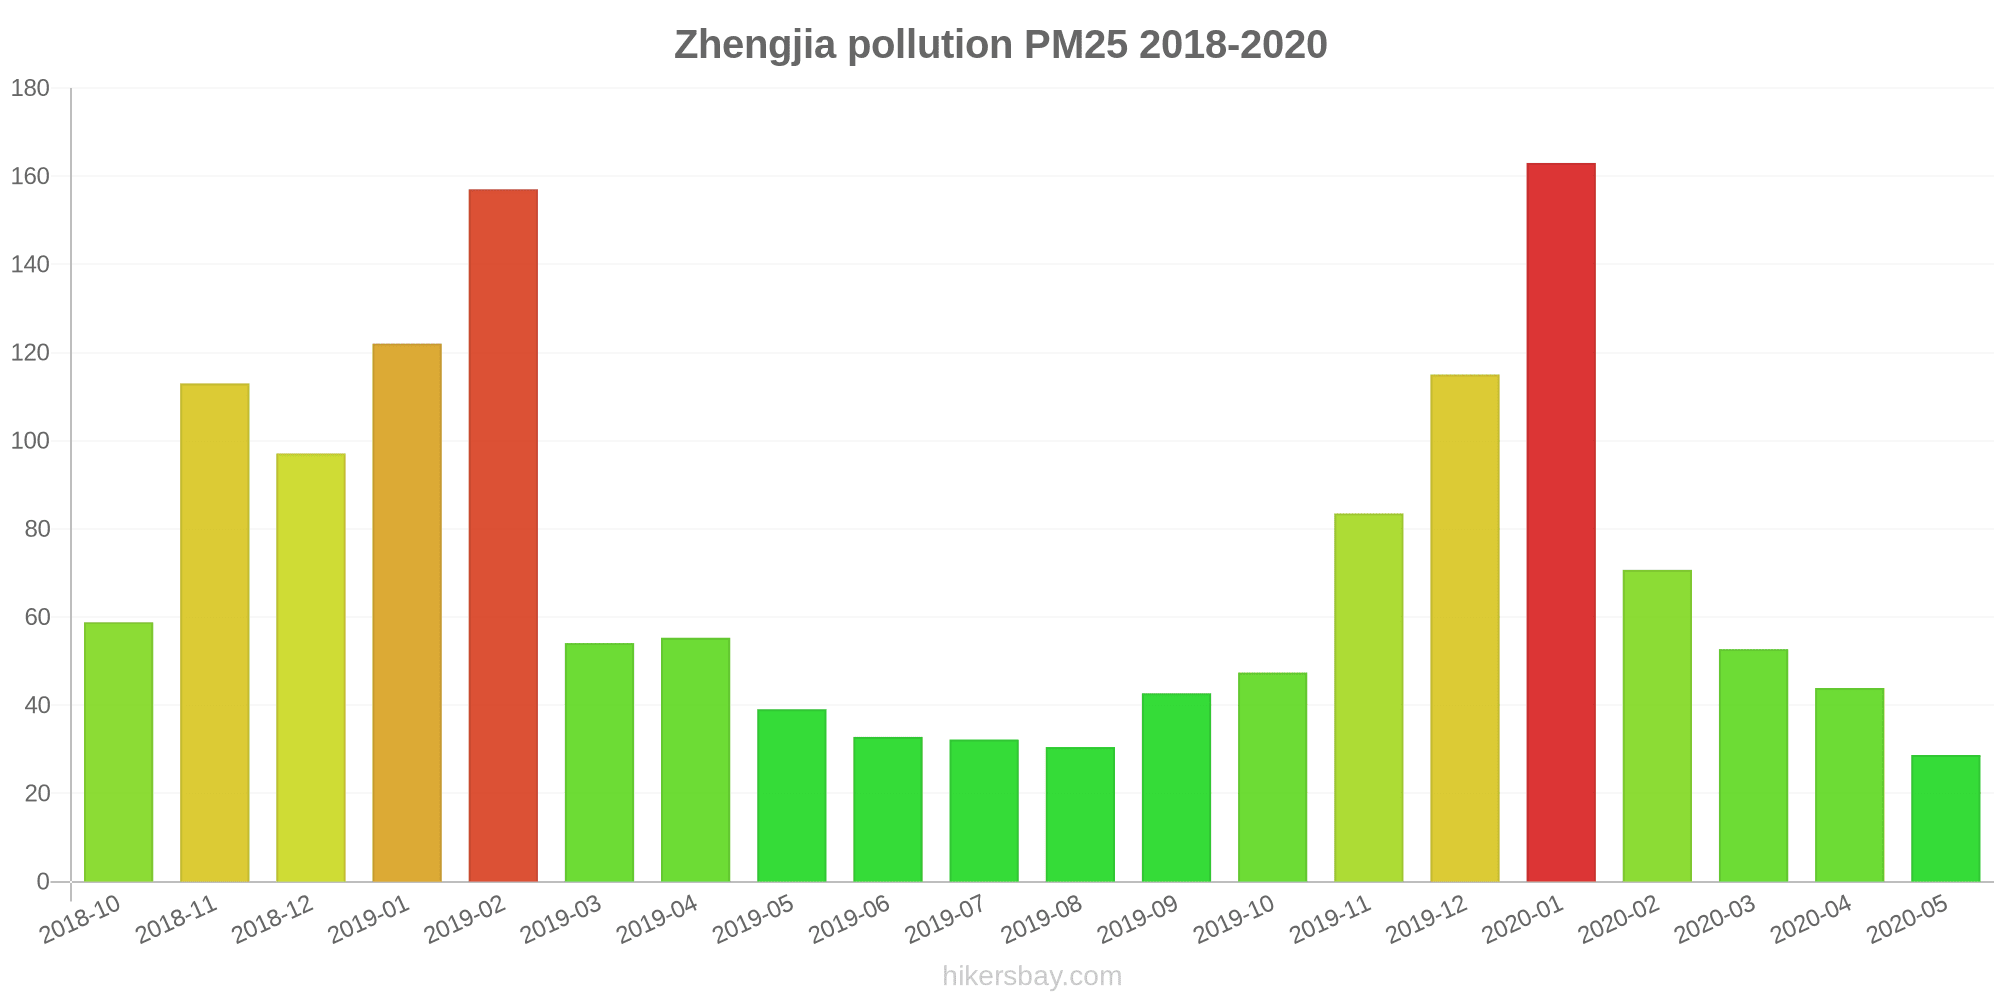
Air pollution in Zhengjia from October 2018 to May 2020
index
2020-05
2020-04
2020-03
2020-02
2020-01
2019-12
2019-11
2019-10
2019-09
2019-08
2019-07
2019-06
2019-05
2019-04
2019-03
2019-02
2019-01
2018-12
2018-11
2018-10
pm25
29 (Moderate)
44 (Unhealthy for Sensitive Groups)
53 (Unhealthy for Sensitive Groups)
71 (Unhealthy)
163 (Very bad Hazardous)
115 (Very bad Hazardous)
84 (Very Unhealthy)
47 (Unhealthy for Sensitive Groups)
43 (Unhealthy for Sensitive Groups)
31 (Moderate)
32 (Moderate)
33 (Moderate)
39 (Unhealthy for Sensitive Groups)
55 (Unhealthy)
54 (Unhealthy for Sensitive Groups)
157 (Very bad Hazardous)
122 (Very bad Hazardous)
97 (Very Unhealthy)
113 (Very bad Hazardous)
59 (Unhealthy)
co
906 (Good)
754 (Good)
712 (Good)
902 (Good)
1 (Good)
1 (Good)
1 (Good)
1 (Good)
1 (Good)
1 (Good)
785 (Good)
679 (Good)
782 (Good)
979 (Good)
828 (Good)
1 (Good)
1 (Good)
1 (Good)
1 (Good)
1 (Good)
no2
23 (Good)
39 (Good)
35 (Good)
22 (Good)
51 (Moderate)
56 (Moderate)
55 (Moderate)
44 (Moderate)
38 (Good)
28 (Good)
23 (Good)
26 (Good)
31 (Good)
39 (Good)
40 (Good)
34 (Good)
59 (Moderate)
58 (Moderate)
55 (Moderate)
52 (Moderate)
o3
153 (Unhealthy)
131 (Unhealthy for Sensitive Groups)
107 (Moderate)
90 (Moderate)
66 (Good)
43 (Good)
79 (Moderate)
115 (Moderate)
176 (Unhealthy)
160 (Unhealthy)
193 (Very Unhealthy)
222 (Very Unhealthy)
184 (Very Unhealthy)
143 (Unhealthy for Sensitive Groups)
126 (Unhealthy for Sensitive Groups)
92 (Moderate)
56 (Good)
57 (Good)
74 (Moderate)
103 (Moderate)
pm10
93 (Unhealthy)
104 (Unhealthy)
100 (Unhealthy)
87 (Unhealthy)
184 (Very bad Hazardous)
142 (Very Unhealthy)
141 (Very Unhealthy)
103 (Unhealthy)
83 (Unhealthy)
62 (Unhealthy for Sensitive Groups)
69 (Unhealthy for Sensitive Groups)
85 (Unhealthy)
107 (Unhealthy)
120 (Very Unhealthy)
115 (Very Unhealthy)
192 (Very bad Hazardous)
183 (Very bad Hazardous)
166 (Very bad Hazardous)
177 (Very bad Hazardous)
113 (Very Unhealthy)
so2
9 (Good)
14 (Good)
12 (Good)
11 (Good)
18 (Good)
16 (Good)
19 (Good)
13 (Good)
14 (Good)
9.3 (Good)
6.6 (Good)
9.8 (Good)
12 (Good)
14 (Good)
13 (Good)
17 (Good)
29 (Good)
28 (Good)
17 (Good)
24 (Good)
data source »
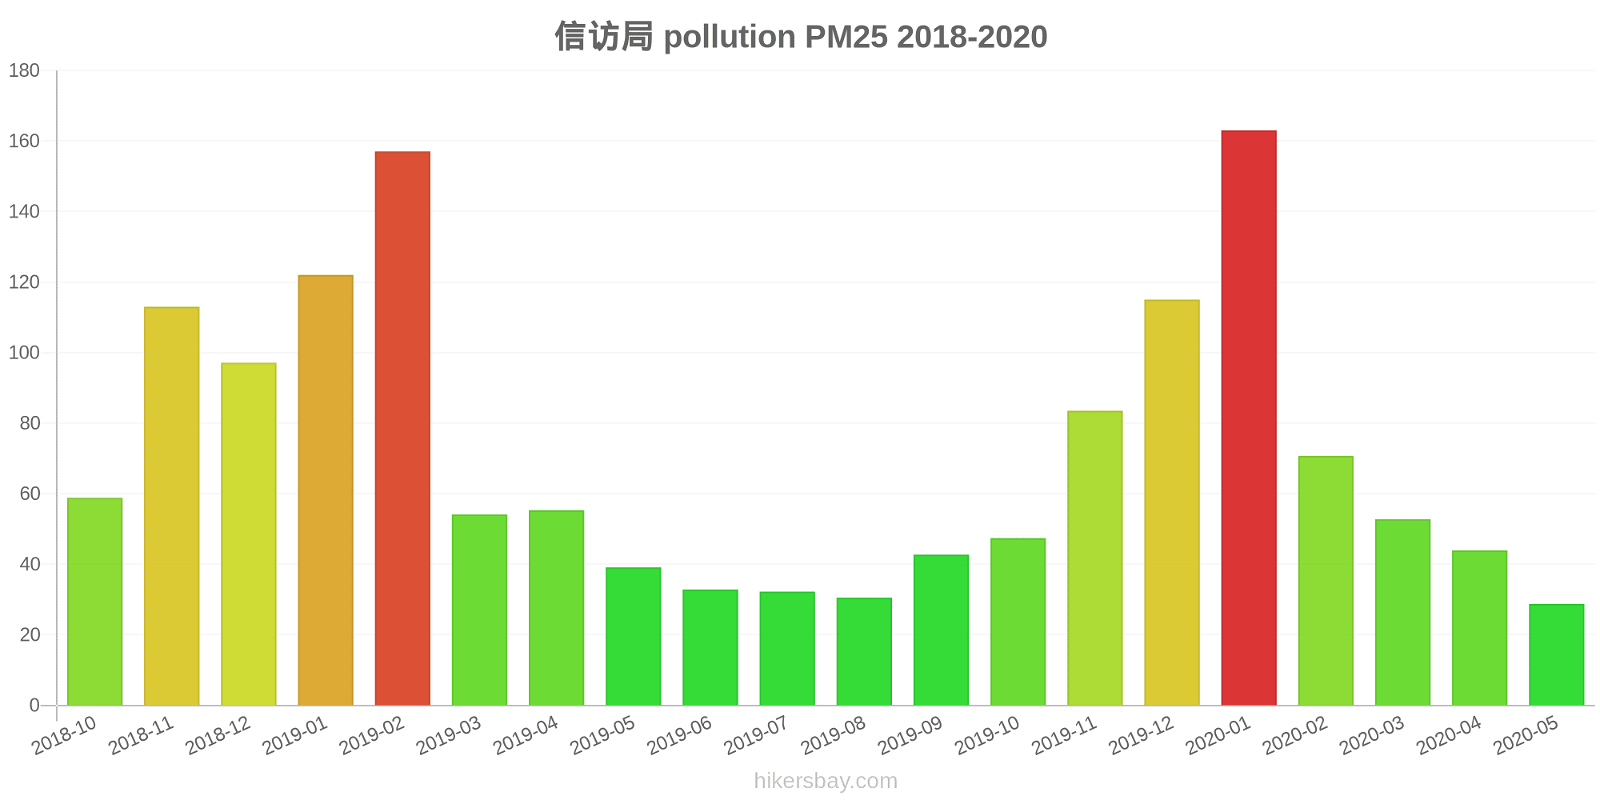
信访局(启用171207)
Friday, May 27, 2022, 12:00 PM
PM10 179 (Very bad Hazardous)
particulate matter (PM10) suspended dust
PM2,5 35 (Unhealthy for Sensitive Groups)
particulate matter (PM2.5) dust
O3 0.04 (Good)
ozone (O3)
NO2 0 (Good)
nitrogen dioxide (NO2)
SO2 0 (Good)
sulfur dioxide (SO2)
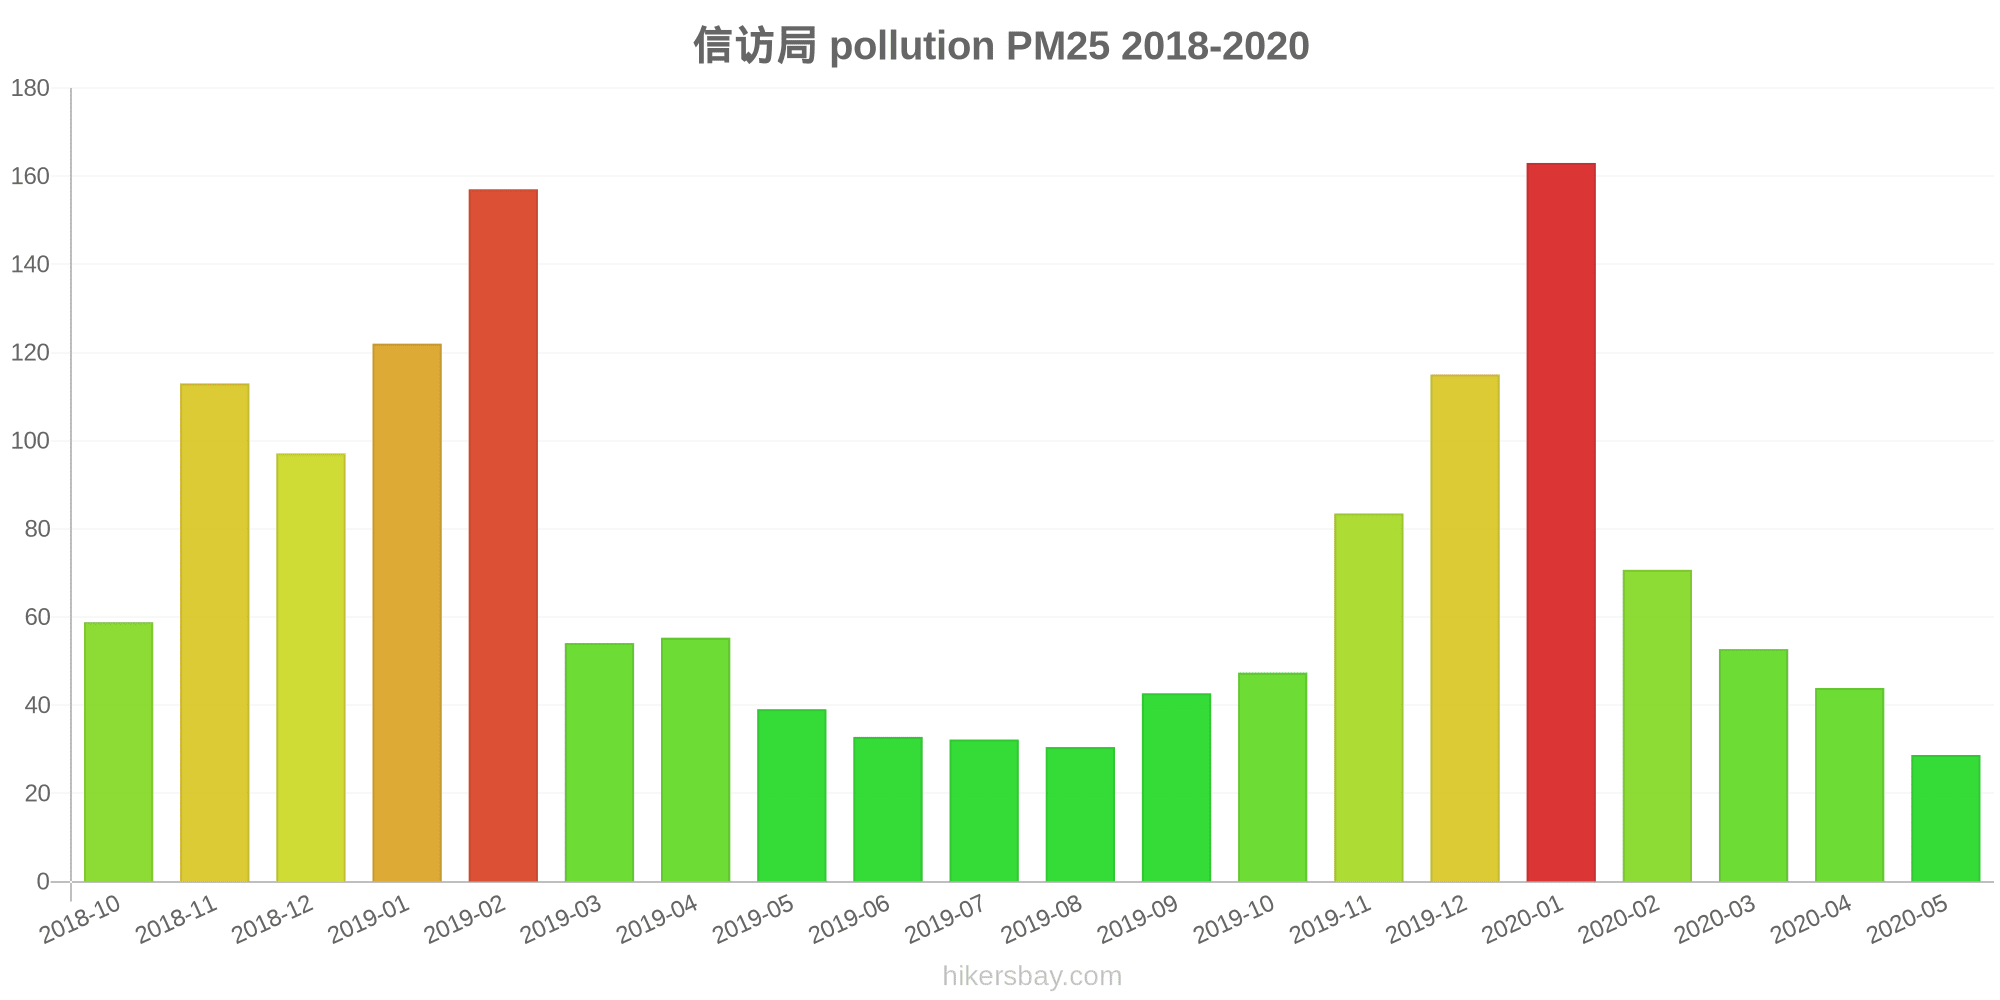
信访局(启用171207)
index
2022-05-27
pm10
56
pm25
56
o3
0.03
no2
0
so2
0
信访局
2018-10 2020-05
index
2020-05
2020-04
2020-03
2020-02
2020-01
2019-12
2019-11
2019-10
2019-09
2019-08
2019-07
2019-06
2019-05
2019-04
2019-03
2019-02
2019-01
2018-12
2018-11
2018-10
pm25
29
44
53
71
163
115
84
47
43
31
32
33
39
55
54
157
122
97
113
59
co
906
754
712
902
1
1
1
1
1
1
785
679
782
979
828
1
1
1
1
1
no2
23
39
35
22
51
56
55
44
38
28
23
26
31
39
40
34
59
58
55
52
o3
153
131
107
90
66
43
79
115
176
160
193
222
184
143
126
92
56
57
74
103
pm10
93
104
100
87
184
142
141
103
83
62
69
85
107
120
115
192
183
166
177
113
so2
9
14
12
11
18
16
19
13
14
9.3
6.6
9.8
12
14
13
17
29
28
17
24
* Pollution data source:
https://openaq.org
(ChinaAQIData)
The data is licensed under CC-By 4.0
PM10 179 (Very bad Hazardous)
PM2,5 35 (Unhealthy for Sensitive Groups)
O3 0 (Good)
NO2 0 (Good)
SO2 0 (Good)
Data on air pollution from recent days in Zhengjia
| index | 2022-05-27 |
|---|---|
| pm10 | 56 Unhealthy for Sensitive Groups |
| pm25 | 56 Unhealthy |
| o3 | 0 Good |
| no2 | 0 Good |
| so2 | 0 Good |
| index | 2020-05 | 2020-04 | 2020-03 | 2020-02 | 2020-01 | 2019-12 | 2019-11 | 2019-10 | 2019-09 | 2019-08 | 2019-07 | 2019-06 | 2019-05 | 2019-04 | 2019-03 | 2019-02 | 2019-01 | 2018-12 | 2018-11 | 2018-10 |
|---|---|---|---|---|---|---|---|---|---|---|---|---|---|---|---|---|---|---|---|---|
| pm25 | 29 (Moderate) | 44 (Unhealthy for Sensitive Groups) | 53 (Unhealthy for Sensitive Groups) | 71 (Unhealthy) | 163 (Very bad Hazardous) | 115 (Very bad Hazardous) | 84 (Very Unhealthy) | 47 (Unhealthy for Sensitive Groups) | 43 (Unhealthy for Sensitive Groups) | 31 (Moderate) | 32 (Moderate) | 33 (Moderate) | 39 (Unhealthy for Sensitive Groups) | 55 (Unhealthy) | 54 (Unhealthy for Sensitive Groups) | 157 (Very bad Hazardous) | 122 (Very bad Hazardous) | 97 (Very Unhealthy) | 113 (Very bad Hazardous) | 59 (Unhealthy) |
| co | 906 (Good) | 754 (Good) | 712 (Good) | 902 (Good) | 1 (Good) | 1 (Good) | 1 (Good) | 1 (Good) | 1 (Good) | 1 (Good) | 785 (Good) | 679 (Good) | 782 (Good) | 979 (Good) | 828 (Good) | 1 (Good) | 1 (Good) | 1 (Good) | 1 (Good) | 1 (Good) |
| no2 | 23 (Good) | 39 (Good) | 35 (Good) | 22 (Good) | 51 (Moderate) | 56 (Moderate) | 55 (Moderate) | 44 (Moderate) | 38 (Good) | 28 (Good) | 23 (Good) | 26 (Good) | 31 (Good) | 39 (Good) | 40 (Good) | 34 (Good) | 59 (Moderate) | 58 (Moderate) | 55 (Moderate) | 52 (Moderate) |
| o3 | 153 (Unhealthy) | 131 (Unhealthy for Sensitive Groups) | 107 (Moderate) | 90 (Moderate) | 66 (Good) | 43 (Good) | 79 (Moderate) | 115 (Moderate) | 176 (Unhealthy) | 160 (Unhealthy) | 193 (Very Unhealthy) | 222 (Very Unhealthy) | 184 (Very Unhealthy) | 143 (Unhealthy for Sensitive Groups) | 126 (Unhealthy for Sensitive Groups) | 92 (Moderate) | 56 (Good) | 57 (Good) | 74 (Moderate) | 103 (Moderate) |
| pm10 | 93 (Unhealthy) | 104 (Unhealthy) | 100 (Unhealthy) | 87 (Unhealthy) | 184 (Very bad Hazardous) | 142 (Very Unhealthy) | 141 (Very Unhealthy) | 103 (Unhealthy) | 83 (Unhealthy) | 62 (Unhealthy for Sensitive Groups) | 69 (Unhealthy for Sensitive Groups) | 85 (Unhealthy) | 107 (Unhealthy) | 120 (Very Unhealthy) | 115 (Very Unhealthy) | 192 (Very bad Hazardous) | 183 (Very bad Hazardous) | 166 (Very bad Hazardous) | 177 (Very bad Hazardous) | 113 (Very Unhealthy) |
| so2 | 9 (Good) | 14 (Good) | 12 (Good) | 11 (Good) | 18 (Good) | 16 (Good) | 19 (Good) | 13 (Good) | 14 (Good) | 9.3 (Good) | 6.6 (Good) | 9.8 (Good) | 12 (Good) | 14 (Good) | 13 (Good) | 17 (Good) | 29 (Good) | 28 (Good) | 17 (Good) | 24 (Good) |
PM10 179 (Very bad Hazardous)
particulate matter (PM10) suspended dustPM2,5 35 (Unhealthy for Sensitive Groups)
particulate matter (PM2.5) dustO3 0.04 (Good)
ozone (O3)NO2 0 (Good)
nitrogen dioxide (NO2)SO2 0 (Good)
sulfur dioxide (SO2)信访局(启用171207)
| index | 2022-05-27 |
|---|---|
| pm10 | 56 |
| pm25 | 56 |
| o3 | 0.03 |
| no2 | 0 |
| so2 | 0 |
信访局
| index | 2020-05 | 2020-04 | 2020-03 | 2020-02 | 2020-01 | 2019-12 | 2019-11 | 2019-10 | 2019-09 | 2019-08 | 2019-07 | 2019-06 | 2019-05 | 2019-04 | 2019-03 | 2019-02 | 2019-01 | 2018-12 | 2018-11 | 2018-10 |
|---|---|---|---|---|---|---|---|---|---|---|---|---|---|---|---|---|---|---|---|---|
| pm25 | 29 | 44 | 53 | 71 | 163 | 115 | 84 | 47 | 43 | 31 | 32 | 33 | 39 | 55 | 54 | 157 | 122 | 97 | 113 | 59 |
| co | 906 | 754 | 712 | 902 | 1 | 1 | 1 | 1 | 1 | 1 | 785 | 679 | 782 | 979 | 828 | 1 | 1 | 1 | 1 | 1 |
| no2 | 23 | 39 | 35 | 22 | 51 | 56 | 55 | 44 | 38 | 28 | 23 | 26 | 31 | 39 | 40 | 34 | 59 | 58 | 55 | 52 |
| o3 | 153 | 131 | 107 | 90 | 66 | 43 | 79 | 115 | 176 | 160 | 193 | 222 | 184 | 143 | 126 | 92 | 56 | 57 | 74 | 103 |
| pm10 | 93 | 104 | 100 | 87 | 184 | 142 | 141 | 103 | 83 | 62 | 69 | 85 | 107 | 120 | 115 | 192 | 183 | 166 | 177 | 113 |
| so2 | 9 | 14 | 12 | 11 | 18 | 16 | 19 | 13 | 14 | 9.3 | 6.6 | 9.8 | 12 | 14 | 13 | 17 | 29 | 28 | 17 | 24 |