Air Pollution in Sanlitun: Real-time Air Quality Index and smog alert.
Pollution and air quality forecast for Sanlitun. Today is Tuesday, June 2, 2026. The following air pollution values have been recorded for Sanlitun:- particulate matter (PM10) suspended dust - 179 (Very bad Hazardous)
- particulate matter (PM2.5) dust - 35 (Unhealthy for Sensitive Groups)
- ozone (O3) - 0 (Good)
- nitrogen dioxide (NO2) - 0 (Good)
- sulfur dioxide (SO2) - 0 (Good)

What is the air quality in Sanlitun today? Is the air polluted in Sanlitun?. Is there smog?
What is the level of PM10 today in Sanlitun? (particulate matter (PM10) suspended dust)
The current level of particulate matter PM10 in Sanlitun is:
179 (Very bad Hazardous)
The highest PM10 values usually occur in month: 193 (February 2019).
The lowest value of particulate matter PM10 pollution in Sanlitun is usually recorded in: August (63).
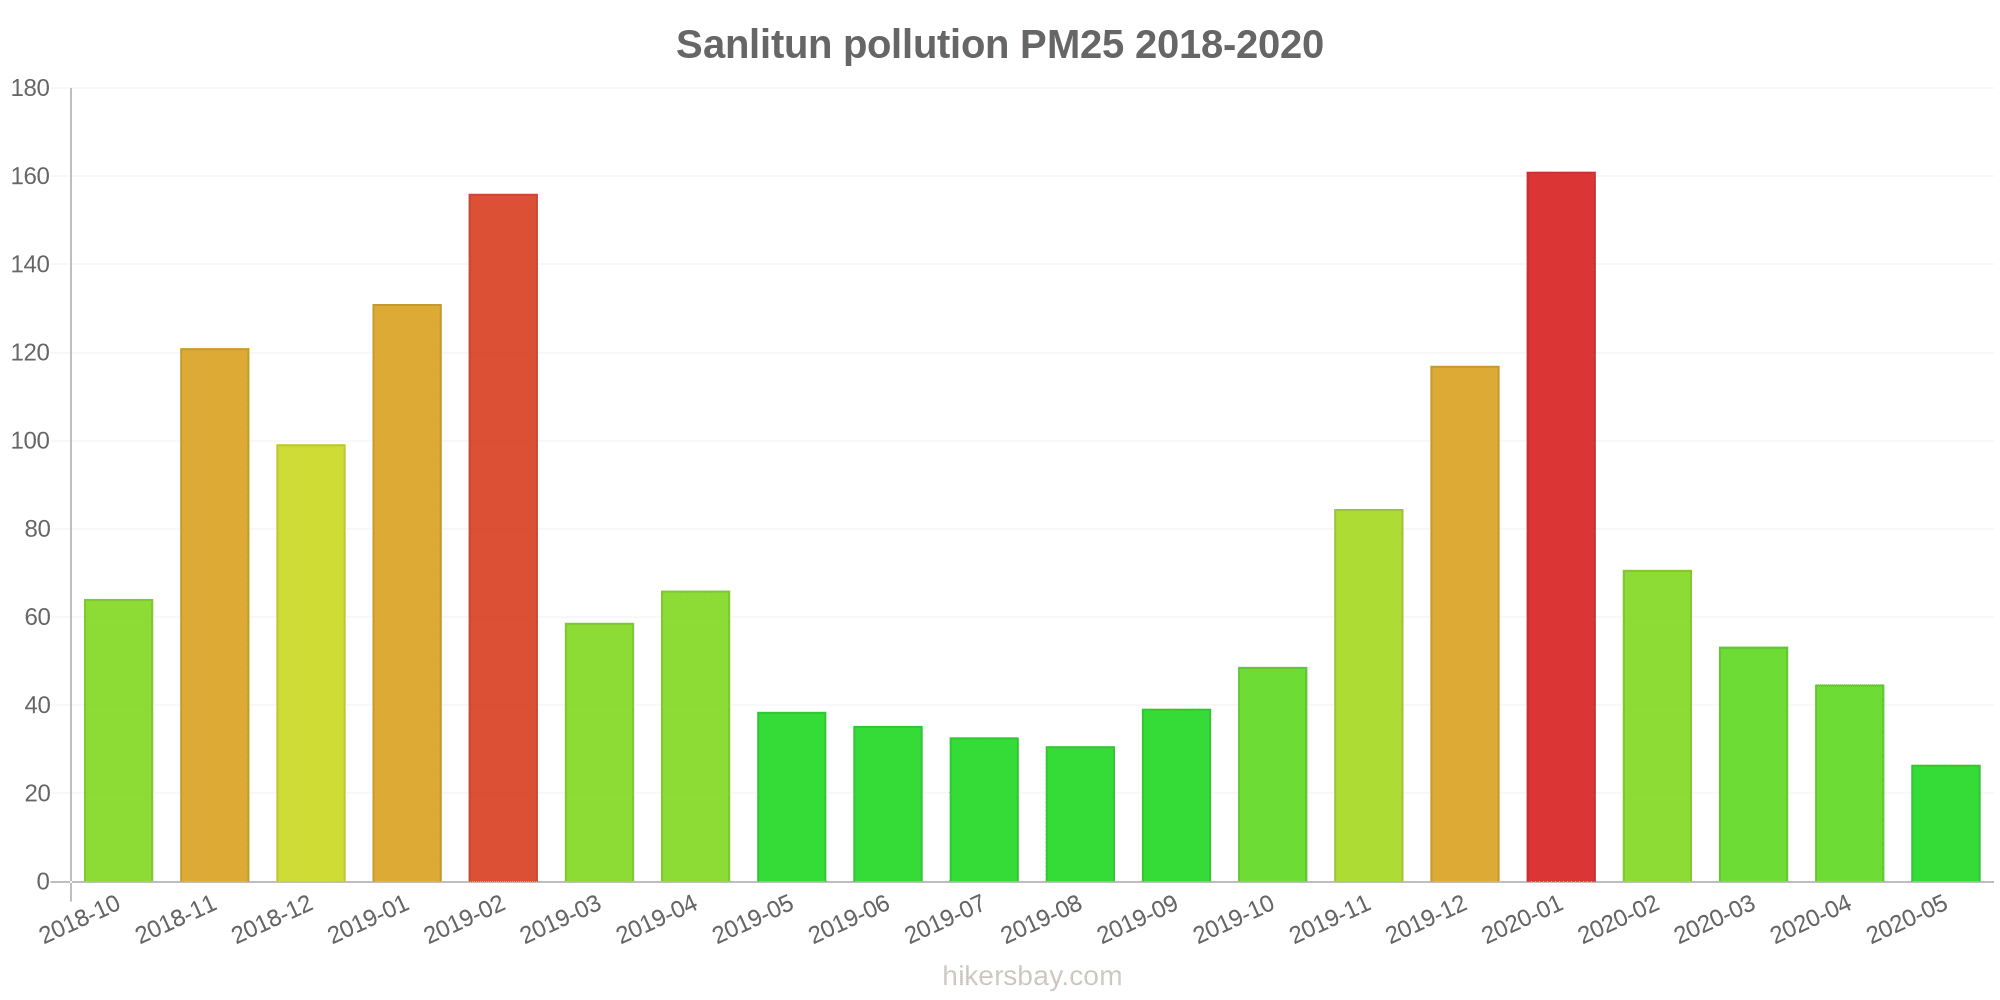
What is the current level of PM2.5 in Sanlitun? (particulate matter (PM2.5) dust)
Today's PM2.5 level is:
35 (Unhealthy for Sensitive Groups)
For comparison, the highest level of PM2.5 in Sanlitun in the last 7 days was: 56 (Friday, May 27, 2022) and the lowest: 56 (Friday, May 27, 2022).
The highest PM2.5 values were recorded: 161 (January 2020).
The lowest level of particulate matter PM2.5 pollution occurs in month: May (27).
How is the O3 level today in Sanlitun? (ozone (O3))
0 (Good)
How high is the level of NO2? (nitrogen dioxide (NO2))
0 (Good)
What is the level of SO2 pollution? (sulfur dioxide (SO2))
0 (Good)
Current data Friday, May 27, 2022, 12:00 PM
PM10 179 (Very bad Hazardous)
PM2,5 35 (Unhealthy for Sensitive Groups)
O3 0 (Good)
NO2 0 (Good)
SO2 0 (Good)
Data on air pollution from recent days in Sanlitun
index
2022-05-27
pm10
56
Unhealthy for Sensitive Groups
pm25
56
Unhealthy
o3
0
Good
no2
0
Good
so2
0
Good
data source »
Air pollution in Sanlitun from October 2018 to May 2020

index
2020-05
2020-04
2020-03
2020-02
2020-01
2019-12
2019-11
2019-10
2019-09
2019-08
2019-07
2019-06
2019-05
2019-04
2019-03
2019-02
2019-01
2018-12
2018-11
2018-10
pm25
27 (Moderate)
45 (Unhealthy for Sensitive Groups)
53 (Unhealthy for Sensitive Groups)
71 (Unhealthy)
161 (Very bad Hazardous)
117 (Very bad Hazardous)
85 (Very Unhealthy)
49 (Unhealthy for Sensitive Groups)
39 (Unhealthy for Sensitive Groups)
31 (Moderate)
33 (Moderate)
35 (Unhealthy for Sensitive Groups)
39 (Unhealthy for Sensitive Groups)
66 (Unhealthy)
59 (Unhealthy)
156 (Very bad Hazardous)
131 (Very bad Hazardous)
99 (Very Unhealthy)
121 (Very bad Hazardous)
64 (Unhealthy)
co
714 (Good)
761 (Good)
781 (Good)
1 (Good)
1 (Good)
1 (Good)
1 (Good)
1 (Good)
1 (Good)
1 (Good)
906 (Good)
791 (Good)
784 (Good)
1 (Good)
931 (Good)
1 (Good)
2 (Good)
1 (Good)
1 (Good)
1 (Good)
no2
25 (Good)
40 (Moderate)
37 (Good)
26 (Good)
52 (Moderate)
57 (Moderate)
54 (Moderate)
39 (Good)
36 (Good)
25 (Good)
23 (Good)
27 (Good)
31 (Good)
35 (Good)
38 (Good)
40 (Good)
63 (Moderate)
60 (Moderate)
53 (Moderate)
60 (Moderate)
o3
166 (Unhealthy)
151 (Unhealthy)
117 (Moderate)
98 (Moderate)
68 (Good)
43 (Good)
81 (Moderate)
113 (Moderate)
177 (Unhealthy)
167 (Unhealthy)
204 (Very Unhealthy)
225 (Very Unhealthy)
170 (Unhealthy)
137 (Unhealthy for Sensitive Groups)
121 (Unhealthy for Sensitive Groups)
93 (Moderate)
55 (Good)
48 (Good)
66 (Good)
97 (Moderate)
pm10
88 (Unhealthy)
103 (Unhealthy)
99 (Unhealthy)
89 (Unhealthy)
183 (Very bad Hazardous)
145 (Very Unhealthy)
145 (Very Unhealthy)
106 (Unhealthy)
87 (Unhealthy)
63 (Unhealthy for Sensitive Groups)
70 (Unhealthy for Sensitive Groups)
84 (Unhealthy)
93 (Unhealthy)
120 (Very Unhealthy)
111 (Very Unhealthy)
193 (Very bad Hazardous)
187 (Very bad Hazardous)
166 (Very bad Hazardous)
181 (Very bad Hazardous)
114 (Very Unhealthy)
so2
8.5 (Good)
14 (Good)
12 (Good)
9.6 (Good)
16 (Good)
16 (Good)
18 (Good)
13 (Good)
12 (Good)
6.9 (Good)
5.7 (Good)
11 (Good)
11 (Good)
13 (Good)
14 (Good)
19 (Good)
26 (Good)
24 (Good)
19 (Good)
21 (Good)
data source »
银杏小区
Friday, May 27, 2022, 12:00 PM
PM10 179 (Very bad Hazardous)
particulate matter (PM10) suspended dust
PM2,5 35 (Unhealthy for Sensitive Groups)
particulate matter (PM2.5) dust
O3 0.04 (Good)
ozone (O3)
NO2 0 (Good)
nitrogen dioxide (NO2)
SO2 0 (Good)
sulfur dioxide (SO2)
银杏小区
index
2022-05-27
pm10
56
pm25
56
o3
0.03
no2
0
so2
0
银杏小区
2018-10 2020-05

index
2020-05
2020-04
2020-03
2020-02
2020-01
2019-12
2019-11
2019-10
2019-09
2019-08
2019-07
2019-06
2019-05
2019-04
2019-03
2019-02
2019-01
2018-12
2018-11
2018-10
pm25
27
45
53
71
161
117
85
49
39
31
33
35
39
66
59
156
131
99
121
64
co
714
761
781
1
1
1
1
1
1
1
906
791
784
1
931
1
2
1
1
1
no2
25
40
37
26
52
57
54
39
36
25
23
27
31
35
38
40
63
60
53
60
o3
166
151
117
98
68
43
81
113
177
167
204
225
170
137
121
93
55
48
66
97
pm10
88
103
99
89
183
145
145
106
87
63
70
84
93
120
111
193
187
166
181
114
so2
8.5
14
12
9.6
16
16
18
13
12
6.9
5.7
11
11
13
14
19
26
24
19
21
* Pollution data source:
https://openaq.org
(ChinaAQIData)
The data is licensed under CC-By 4.0
PM10 179 (Very bad Hazardous)
PM2,5 35 (Unhealthy for Sensitive Groups)
O3 0 (Good)
NO2 0 (Good)
SO2 0 (Good)
Data on air pollution from recent days in Sanlitun
| index | 2022-05-27 |
|---|---|
| pm10 | 56 Unhealthy for Sensitive Groups |
| pm25 | 56 Unhealthy |
| o3 | 0 Good |
| no2 | 0 Good |
| so2 | 0 Good |
| index | 2020-05 | 2020-04 | 2020-03 | 2020-02 | 2020-01 | 2019-12 | 2019-11 | 2019-10 | 2019-09 | 2019-08 | 2019-07 | 2019-06 | 2019-05 | 2019-04 | 2019-03 | 2019-02 | 2019-01 | 2018-12 | 2018-11 | 2018-10 |
|---|---|---|---|---|---|---|---|---|---|---|---|---|---|---|---|---|---|---|---|---|
| pm25 | 27 (Moderate) | 45 (Unhealthy for Sensitive Groups) | 53 (Unhealthy for Sensitive Groups) | 71 (Unhealthy) | 161 (Very bad Hazardous) | 117 (Very bad Hazardous) | 85 (Very Unhealthy) | 49 (Unhealthy for Sensitive Groups) | 39 (Unhealthy for Sensitive Groups) | 31 (Moderate) | 33 (Moderate) | 35 (Unhealthy for Sensitive Groups) | 39 (Unhealthy for Sensitive Groups) | 66 (Unhealthy) | 59 (Unhealthy) | 156 (Very bad Hazardous) | 131 (Very bad Hazardous) | 99 (Very Unhealthy) | 121 (Very bad Hazardous) | 64 (Unhealthy) |
| co | 714 (Good) | 761 (Good) | 781 (Good) | 1 (Good) | 1 (Good) | 1 (Good) | 1 (Good) | 1 (Good) | 1 (Good) | 1 (Good) | 906 (Good) | 791 (Good) | 784 (Good) | 1 (Good) | 931 (Good) | 1 (Good) | 2 (Good) | 1 (Good) | 1 (Good) | 1 (Good) |
| no2 | 25 (Good) | 40 (Moderate) | 37 (Good) | 26 (Good) | 52 (Moderate) | 57 (Moderate) | 54 (Moderate) | 39 (Good) | 36 (Good) | 25 (Good) | 23 (Good) | 27 (Good) | 31 (Good) | 35 (Good) | 38 (Good) | 40 (Good) | 63 (Moderate) | 60 (Moderate) | 53 (Moderate) | 60 (Moderate) |
| o3 | 166 (Unhealthy) | 151 (Unhealthy) | 117 (Moderate) | 98 (Moderate) | 68 (Good) | 43 (Good) | 81 (Moderate) | 113 (Moderate) | 177 (Unhealthy) | 167 (Unhealthy) | 204 (Very Unhealthy) | 225 (Very Unhealthy) | 170 (Unhealthy) | 137 (Unhealthy for Sensitive Groups) | 121 (Unhealthy for Sensitive Groups) | 93 (Moderate) | 55 (Good) | 48 (Good) | 66 (Good) | 97 (Moderate) |
| pm10 | 88 (Unhealthy) | 103 (Unhealthy) | 99 (Unhealthy) | 89 (Unhealthy) | 183 (Very bad Hazardous) | 145 (Very Unhealthy) | 145 (Very Unhealthy) | 106 (Unhealthy) | 87 (Unhealthy) | 63 (Unhealthy for Sensitive Groups) | 70 (Unhealthy for Sensitive Groups) | 84 (Unhealthy) | 93 (Unhealthy) | 120 (Very Unhealthy) | 111 (Very Unhealthy) | 193 (Very bad Hazardous) | 187 (Very bad Hazardous) | 166 (Very bad Hazardous) | 181 (Very bad Hazardous) | 114 (Very Unhealthy) |
| so2 | 8.5 (Good) | 14 (Good) | 12 (Good) | 9.6 (Good) | 16 (Good) | 16 (Good) | 18 (Good) | 13 (Good) | 12 (Good) | 6.9 (Good) | 5.7 (Good) | 11 (Good) | 11 (Good) | 13 (Good) | 14 (Good) | 19 (Good) | 26 (Good) | 24 (Good) | 19 (Good) | 21 (Good) |
PM10 179 (Very bad Hazardous)
particulate matter (PM10) suspended dustPM2,5 35 (Unhealthy for Sensitive Groups)
particulate matter (PM2.5) dustO3 0.04 (Good)
ozone (O3)NO2 0 (Good)
nitrogen dioxide (NO2)SO2 0 (Good)
sulfur dioxide (SO2)银杏小区
| index | 2022-05-27 |
|---|---|
| pm10 | 56 |
| pm25 | 56 |
| o3 | 0.03 |
| no2 | 0 |
| so2 | 0 |
银杏小区

| index | 2020-05 | 2020-04 | 2020-03 | 2020-02 | 2020-01 | 2019-12 | 2019-11 | 2019-10 | 2019-09 | 2019-08 | 2019-07 | 2019-06 | 2019-05 | 2019-04 | 2019-03 | 2019-02 | 2019-01 | 2018-12 | 2018-11 | 2018-10 |
|---|---|---|---|---|---|---|---|---|---|---|---|---|---|---|---|---|---|---|---|---|
| pm25 | 27 | 45 | 53 | 71 | 161 | 117 | 85 | 49 | 39 | 31 | 33 | 35 | 39 | 66 | 59 | 156 | 131 | 99 | 121 | 64 |
| co | 714 | 761 | 781 | 1 | 1 | 1 | 1 | 1 | 1 | 1 | 906 | 791 | 784 | 1 | 931 | 1 | 2 | 1 | 1 | 1 |
| no2 | 25 | 40 | 37 | 26 | 52 | 57 | 54 | 39 | 36 | 25 | 23 | 27 | 31 | 35 | 38 | 40 | 63 | 60 | 53 | 60 |
| o3 | 166 | 151 | 117 | 98 | 68 | 43 | 81 | 113 | 177 | 167 | 204 | 225 | 170 | 137 | 121 | 93 | 55 | 48 | 66 | 97 |
| pm10 | 88 | 103 | 99 | 89 | 183 | 145 | 145 | 106 | 87 | 63 | 70 | 84 | 93 | 120 | 111 | 193 | 187 | 166 | 181 | 114 |
| so2 | 8.5 | 14 | 12 | 9.6 | 16 | 16 | 18 | 13 | 12 | 6.9 | 5.7 | 11 | 11 | 13 | 14 | 19 | 26 | 24 | 19 | 21 |