Air Pollution in Zhangjiazhuang: Real-time Air Quality Index and smog alert.
Pollution and air quality forecast for Zhangjiazhuang. Today is Tuesday, June 2, 2026. The following air pollution values have been recorded for Zhangjiazhuang:- particulate matter (PM10) suspended dust - 179 (Very bad Hazardous)
- particulate matter (PM2.5) dust - 35 (Unhealthy for Sensitive Groups)
- ozone (O3) - 0 (Good)
- nitrogen dioxide (NO2) - 0 (Good)
- sulfur dioxide (SO2) - 0 (Good)

What is the air quality in Zhangjiazhuang today? Is the air polluted in Zhangjiazhuang?. Is there smog?
What is the level of PM10 today in Zhangjiazhuang? (particulate matter (PM10) suspended dust)
The current level of particulate matter PM10 in Zhangjiazhuang is:
179 (Very bad Hazardous)
The highest PM10 values usually occur in month: 188 (January 2020).
The lowest value of particulate matter PM10 pollution in Zhangjiazhuang is usually recorded in: August (57).
What is the current level of PM2.5 in Zhangjiazhuang? (particulate matter (PM2.5) dust)
Today's PM2.5 level is:
35 (Unhealthy for Sensitive Groups)
For comparison, the highest level of PM2.5 in Zhangjiazhuang in the last 7 days was: 56 (Friday, May 27, 2022) and the lowest: 56 (Friday, May 27, 2022).
The highest PM2.5 values were recorded: 168 (January 2020).
The lowest level of particulate matter PM2.5 pollution occurs in month: August (27).
How is the O3 level today in Zhangjiazhuang? (ozone (O3))
0 (Good)
How high is the level of NO2? (nitrogen dioxide (NO2))
0 (Good)
What is the level of SO2 pollution? (sulfur dioxide (SO2))
0 (Good)
Current data Friday, May 27, 2022, 12:00 PM
PM10 179 (Very bad Hazardous)
PM2,5 35 (Unhealthy for Sensitive Groups)
O3 0 (Good)
NO2 0 (Good)
SO2 0 (Good)
Data on air pollution from recent days in Zhangjiazhuang
index
2022-05-27
pm10
56
Unhealthy for Sensitive Groups
pm25
56
Unhealthy
o3
0
Good
no2
0
Good
so2
0
Good
data source »
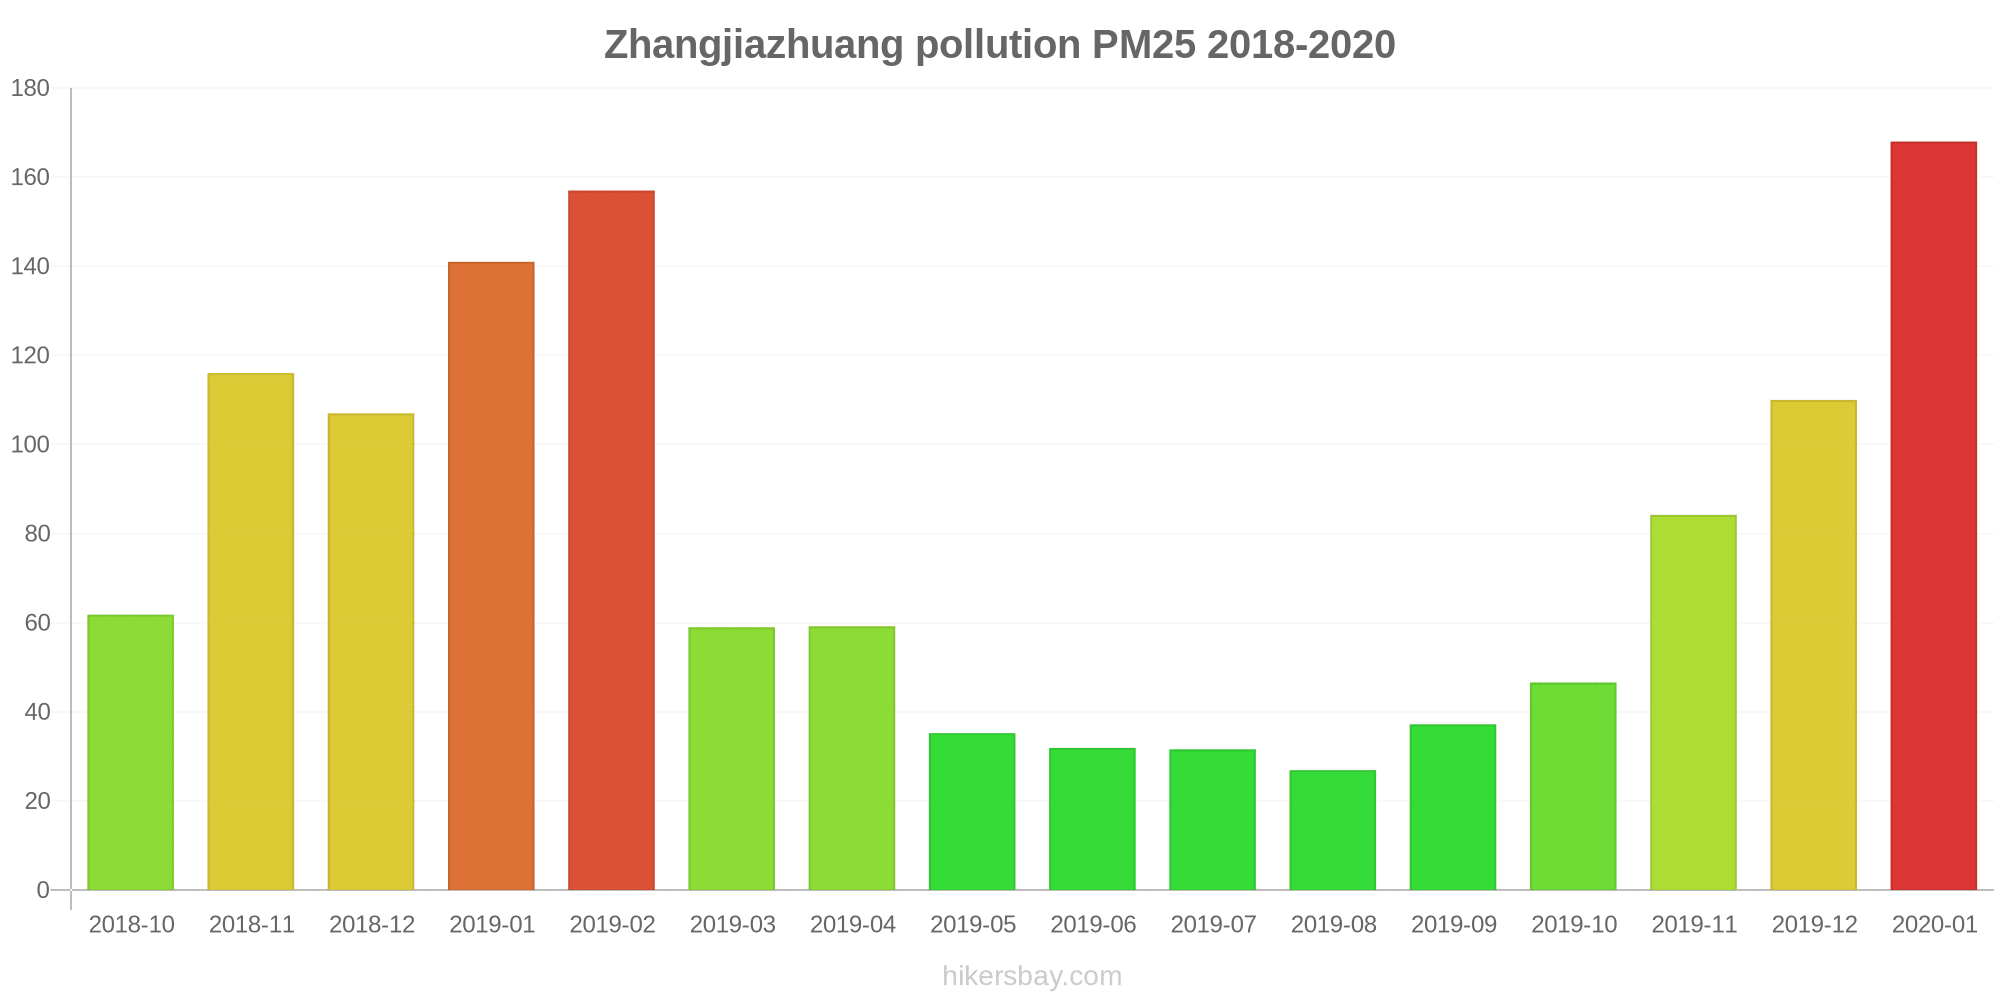
Air pollution in Zhangjiazhuang from October 2018 to January 2020
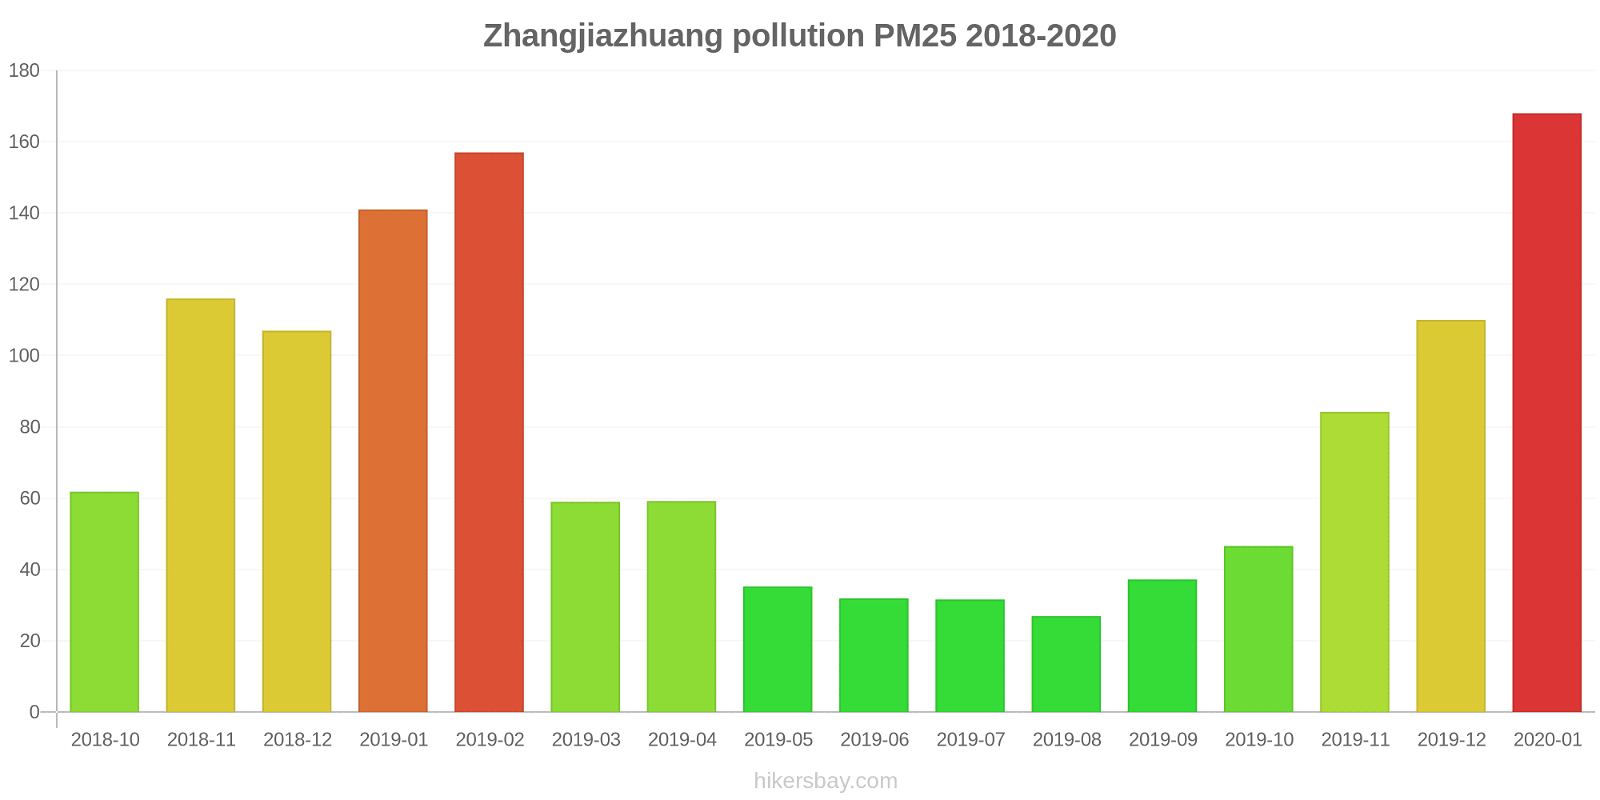
index
2020-01
2019-12
2019-11
2019-10
2019-09
2019-08
2019-07
2019-06
2019-05
2019-04
2019-03
2019-02
2019-01
2018-12
2018-11
2018-10
pm25
168 (Very bad Hazardous)
110 (Very bad Hazardous)
84 (Very Unhealthy)
47 (Unhealthy for Sensitive Groups)
37 (Unhealthy for Sensitive Groups)
27 (Moderate)
32 (Moderate)
32 (Moderate)
35 (Unhealthy for Sensitive Groups)
59 (Unhealthy)
59 (Unhealthy)
157 (Very bad Hazardous)
141 (Very bad Hazardous)
107 (Very Unhealthy)
116 (Very bad Hazardous)
62 (Unhealthy)
co
2 (Good)
1 (Good)
1 (Good)
897 (Good)
786 (Good)
795 (Good)
683 (Good)
717 (Good)
720 (Good)
1 (Good)
827 (Good)
1 (Good)
2 (Good)
1 (Good)
1 (Good)
1 (Good)
no2
58 (Moderate)
50 (Moderate)
49 (Moderate)
44 (Moderate)
35 (Good)
25 (Good)
22 (Good)
24 (Good)
27 (Good)
31 (Good)
33 (Good)
34 (Good)
59 (Moderate)
58 (Moderate)
51 (Moderate)
52 (Moderate)
o3
61 (Good)
48 (Good)
88 (Moderate)
119 (Moderate)
182 (Very Unhealthy)
159 (Unhealthy)
195 (Very Unhealthy)
212 (Very Unhealthy)
163 (Unhealthy)
132 (Unhealthy for Sensitive Groups)
117 (Moderate)
91 (Moderate)
57 (Good)
50 (Good)
64 (Good)
97 (Moderate)
pm10
188 (Very bad Hazardous)
136 (Very Unhealthy)
141 (Very Unhealthy)
107 (Unhealthy)
85 (Unhealthy)
57 (Unhealthy for Sensitive Groups)
67 (Unhealthy for Sensitive Groups)
85 (Unhealthy)
90 (Unhealthy)
111 (Very Unhealthy)
111 (Very Unhealthy)
188 (Very bad Hazardous)
185 (Very bad Hazardous)
140 (Very Unhealthy)
135 (Very Unhealthy)
86 (Unhealthy)
so2
19 (Good)
14 (Good)
14 (Good)
13 (Good)
13 (Good)
10 (Good)
7.3 (Good)
9.5 (Good)
13 (Good)
15 (Good)
14 (Good)
20 (Good)
33 (Good)
27 (Good)
16 (Good)
21 (Good)
data source »
棉研所(对照点)
Friday, May 27, 2022, 12:00 PM
PM10 179 (Very bad Hazardous)
particulate matter (PM10) suspended dust
PM2,5 35 (Unhealthy for Sensitive Groups)
particulate matter (PM2.5) dust
O3 0.04 (Good)
ozone (O3)
NO2 0 (Good)
nitrogen dioxide (NO2)
SO2 0 (Good)
sulfur dioxide (SO2)
棉研所(对照点)
index
2022-05-27
pm10
56
pm25
56
o3
0.03
no2
0
so2
0
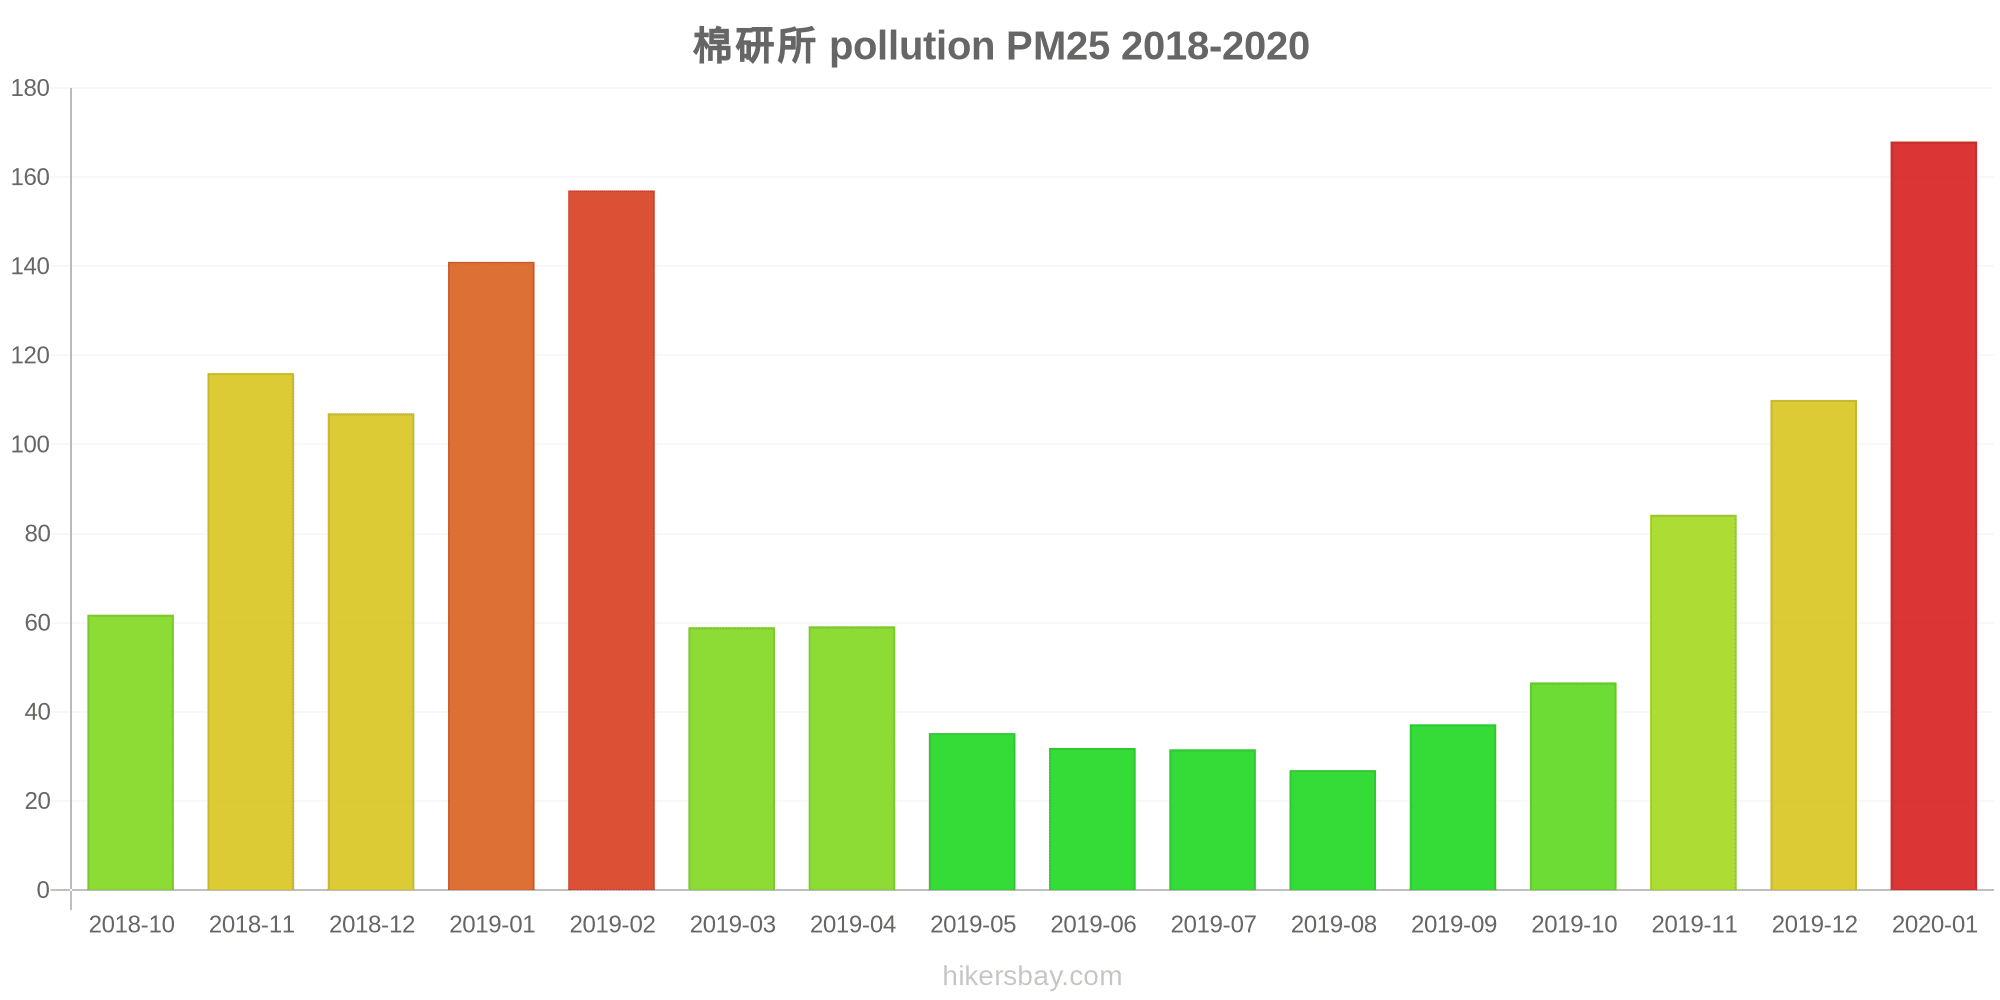
棉研所
2018-10 2020-01

index
2020-01
2019-12
2019-11
2019-10
2019-09
2019-08
2019-07
2019-06
2019-05
2019-04
2019-03
2019-02
2019-01
2018-12
2018-11
2018-10
pm25
168
110
84
47
37
27
32
32
35
59
59
157
141
107
116
62
co
2
1
1
897
786
795
683
717
720
1
827
1
2
1
1
1
no2
58
50
49
44
35
25
22
24
27
31
33
34
59
58
51
52
o3
61
48
88
119
182
159
195
212
163
132
117
91
57
50
64
97
pm10
188
136
141
107
85
57
67
85
90
111
111
188
185
140
135
86
so2
19
14
14
13
13
10
7.3
9.5
13
15
14
20
33
27
16
21
* Pollution data source:
https://openaq.org
()
The data is licensed under CC-By 4.0
PM10 179 (Very bad Hazardous)
PM2,5 35 (Unhealthy for Sensitive Groups)
O3 0 (Good)
NO2 0 (Good)
SO2 0 (Good)
Data on air pollution from recent days in Zhangjiazhuang
| index | 2022-05-27 |
|---|---|
| pm10 | 56 Unhealthy for Sensitive Groups |
| pm25 | 56 Unhealthy |
| o3 | 0 Good |
| no2 | 0 Good |
| so2 | 0 Good |
| index | 2020-01 | 2019-12 | 2019-11 | 2019-10 | 2019-09 | 2019-08 | 2019-07 | 2019-06 | 2019-05 | 2019-04 | 2019-03 | 2019-02 | 2019-01 | 2018-12 | 2018-11 | 2018-10 |
|---|---|---|---|---|---|---|---|---|---|---|---|---|---|---|---|---|
| pm25 | 168 (Very bad Hazardous) | 110 (Very bad Hazardous) | 84 (Very Unhealthy) | 47 (Unhealthy for Sensitive Groups) | 37 (Unhealthy for Sensitive Groups) | 27 (Moderate) | 32 (Moderate) | 32 (Moderate) | 35 (Unhealthy for Sensitive Groups) | 59 (Unhealthy) | 59 (Unhealthy) | 157 (Very bad Hazardous) | 141 (Very bad Hazardous) | 107 (Very Unhealthy) | 116 (Very bad Hazardous) | 62 (Unhealthy) |
| co | 2 (Good) | 1 (Good) | 1 (Good) | 897 (Good) | 786 (Good) | 795 (Good) | 683 (Good) | 717 (Good) | 720 (Good) | 1 (Good) | 827 (Good) | 1 (Good) | 2 (Good) | 1 (Good) | 1 (Good) | 1 (Good) |
| no2 | 58 (Moderate) | 50 (Moderate) | 49 (Moderate) | 44 (Moderate) | 35 (Good) | 25 (Good) | 22 (Good) | 24 (Good) | 27 (Good) | 31 (Good) | 33 (Good) | 34 (Good) | 59 (Moderate) | 58 (Moderate) | 51 (Moderate) | 52 (Moderate) |
| o3 | 61 (Good) | 48 (Good) | 88 (Moderate) | 119 (Moderate) | 182 (Very Unhealthy) | 159 (Unhealthy) | 195 (Very Unhealthy) | 212 (Very Unhealthy) | 163 (Unhealthy) | 132 (Unhealthy for Sensitive Groups) | 117 (Moderate) | 91 (Moderate) | 57 (Good) | 50 (Good) | 64 (Good) | 97 (Moderate) |
| pm10 | 188 (Very bad Hazardous) | 136 (Very Unhealthy) | 141 (Very Unhealthy) | 107 (Unhealthy) | 85 (Unhealthy) | 57 (Unhealthy for Sensitive Groups) | 67 (Unhealthy for Sensitive Groups) | 85 (Unhealthy) | 90 (Unhealthy) | 111 (Very Unhealthy) | 111 (Very Unhealthy) | 188 (Very bad Hazardous) | 185 (Very bad Hazardous) | 140 (Very Unhealthy) | 135 (Very Unhealthy) | 86 (Unhealthy) |
| so2 | 19 (Good) | 14 (Good) | 14 (Good) | 13 (Good) | 13 (Good) | 10 (Good) | 7.3 (Good) | 9.5 (Good) | 13 (Good) | 15 (Good) | 14 (Good) | 20 (Good) | 33 (Good) | 27 (Good) | 16 (Good) | 21 (Good) |
PM10 179 (Very bad Hazardous)
particulate matter (PM10) suspended dustPM2,5 35 (Unhealthy for Sensitive Groups)
particulate matter (PM2.5) dustO3 0.04 (Good)
ozone (O3)NO2 0 (Good)
nitrogen dioxide (NO2)SO2 0 (Good)
sulfur dioxide (SO2)棉研所(对照点)
| index | 2022-05-27 |
|---|---|
| pm10 | 56 |
| pm25 | 56 |
| o3 | 0.03 |
| no2 | 0 |
| so2 | 0 |
棉研所
| index | 2020-01 | 2019-12 | 2019-11 | 2019-10 | 2019-09 | 2019-08 | 2019-07 | 2019-06 | 2019-05 | 2019-04 | 2019-03 | 2019-02 | 2019-01 | 2018-12 | 2018-11 | 2018-10 |
|---|---|---|---|---|---|---|---|---|---|---|---|---|---|---|---|---|
| pm25 | 168 | 110 | 84 | 47 | 37 | 27 | 32 | 32 | 35 | 59 | 59 | 157 | 141 | 107 | 116 | 62 |
| co | 2 | 1 | 1 | 897 | 786 | 795 | 683 | 717 | 720 | 1 | 827 | 1 | 2 | 1 | 1 | 1 |
| no2 | 58 | 50 | 49 | 44 | 35 | 25 | 22 | 24 | 27 | 31 | 33 | 34 | 59 | 58 | 51 | 52 |
| o3 | 61 | 48 | 88 | 119 | 182 | 159 | 195 | 212 | 163 | 132 | 117 | 91 | 57 | 50 | 64 | 97 |
| pm10 | 188 | 136 | 141 | 107 | 85 | 57 | 67 | 85 | 90 | 111 | 111 | 188 | 185 | 140 | 135 | 86 |
| so2 | 19 | 14 | 14 | 13 | 13 | 10 | 7.3 | 9.5 | 13 | 15 | 14 | 20 | 33 | 27 | 16 | 21 |