Air Pollution in Liuzhuangying: Real-time Air Quality Index and smog alert.
Pollution and air quality forecast for Liuzhuangying. Today is Tuesday, June 2, 2026. The following air pollution values have been recorded for Liuzhuangying:- particulate matter (PM10) suspended dust - 179 (Very bad Hazardous)
- particulate matter (PM2.5) dust - 35 (Unhealthy for Sensitive Groups)
- ozone (O3) - 0 (Good)
- nitrogen dioxide (NO2) - 0 (Good)
- sulfur dioxide (SO2) - 0 (Good)

What is the air quality in Liuzhuangying today? Is the air polluted in Liuzhuangying?. Is there smog?
What is the level of PM10 today in Liuzhuangying? (particulate matter (PM10) suspended dust)
The current level of particulate matter PM10 in Liuzhuangying is:
179 (Very bad Hazardous)
The highest PM10 values usually occur in month: 172 (November 2018).
The lowest value of particulate matter PM10 pollution in Liuzhuangying is usually recorded in: August (60).
What is the current level of PM2.5 in Liuzhuangying? (particulate matter (PM2.5) dust)
Today's PM2.5 level is:
35 (Unhealthy for Sensitive Groups)
For comparison, the highest level of PM2.5 in Liuzhuangying in the last 7 days was: 56 (Friday, May 27, 2022) and the lowest: 56 (Friday, May 27, 2022).
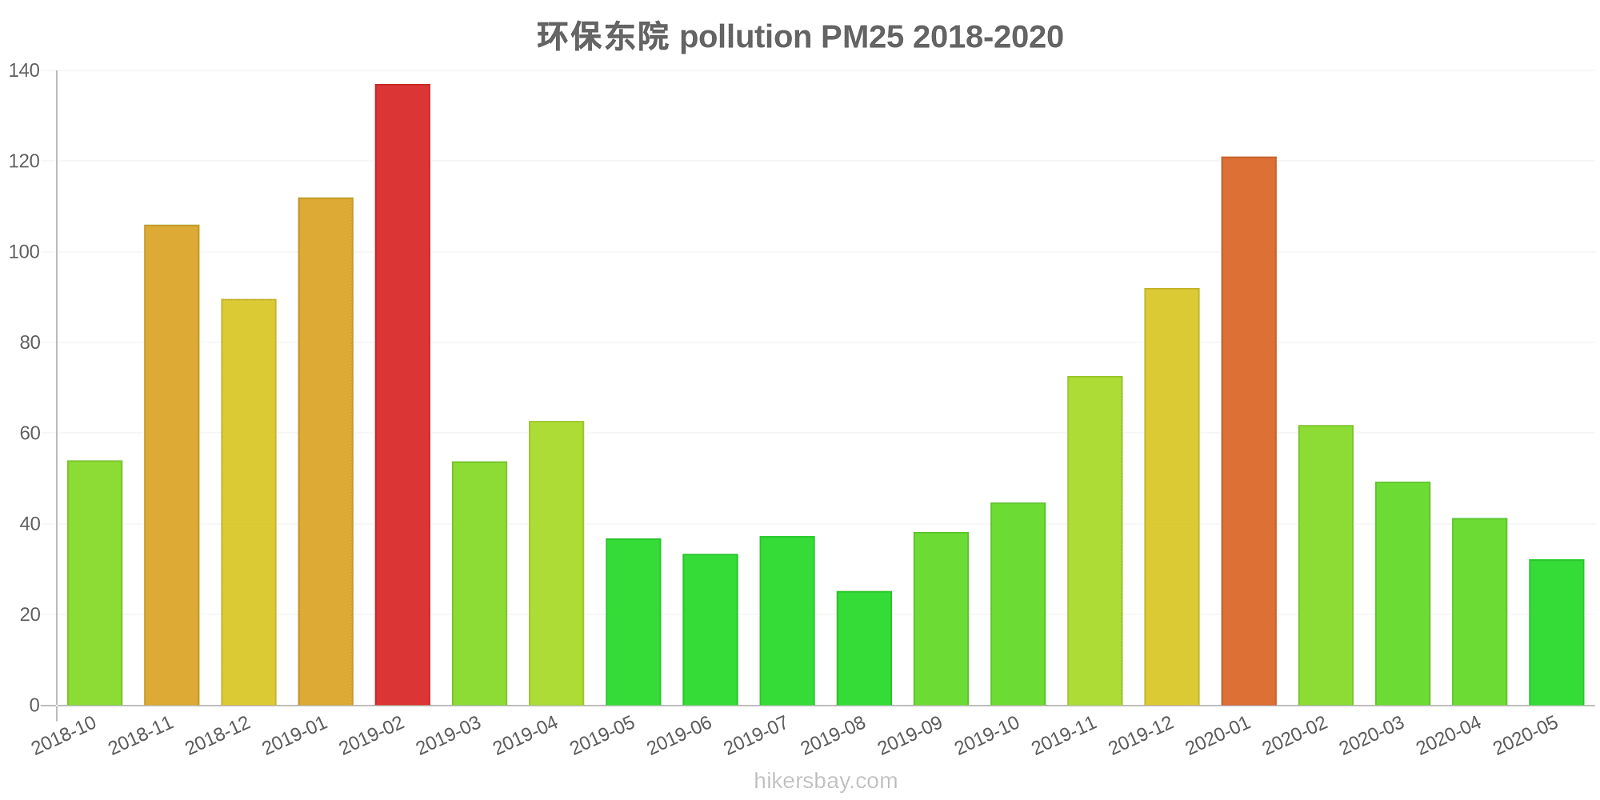
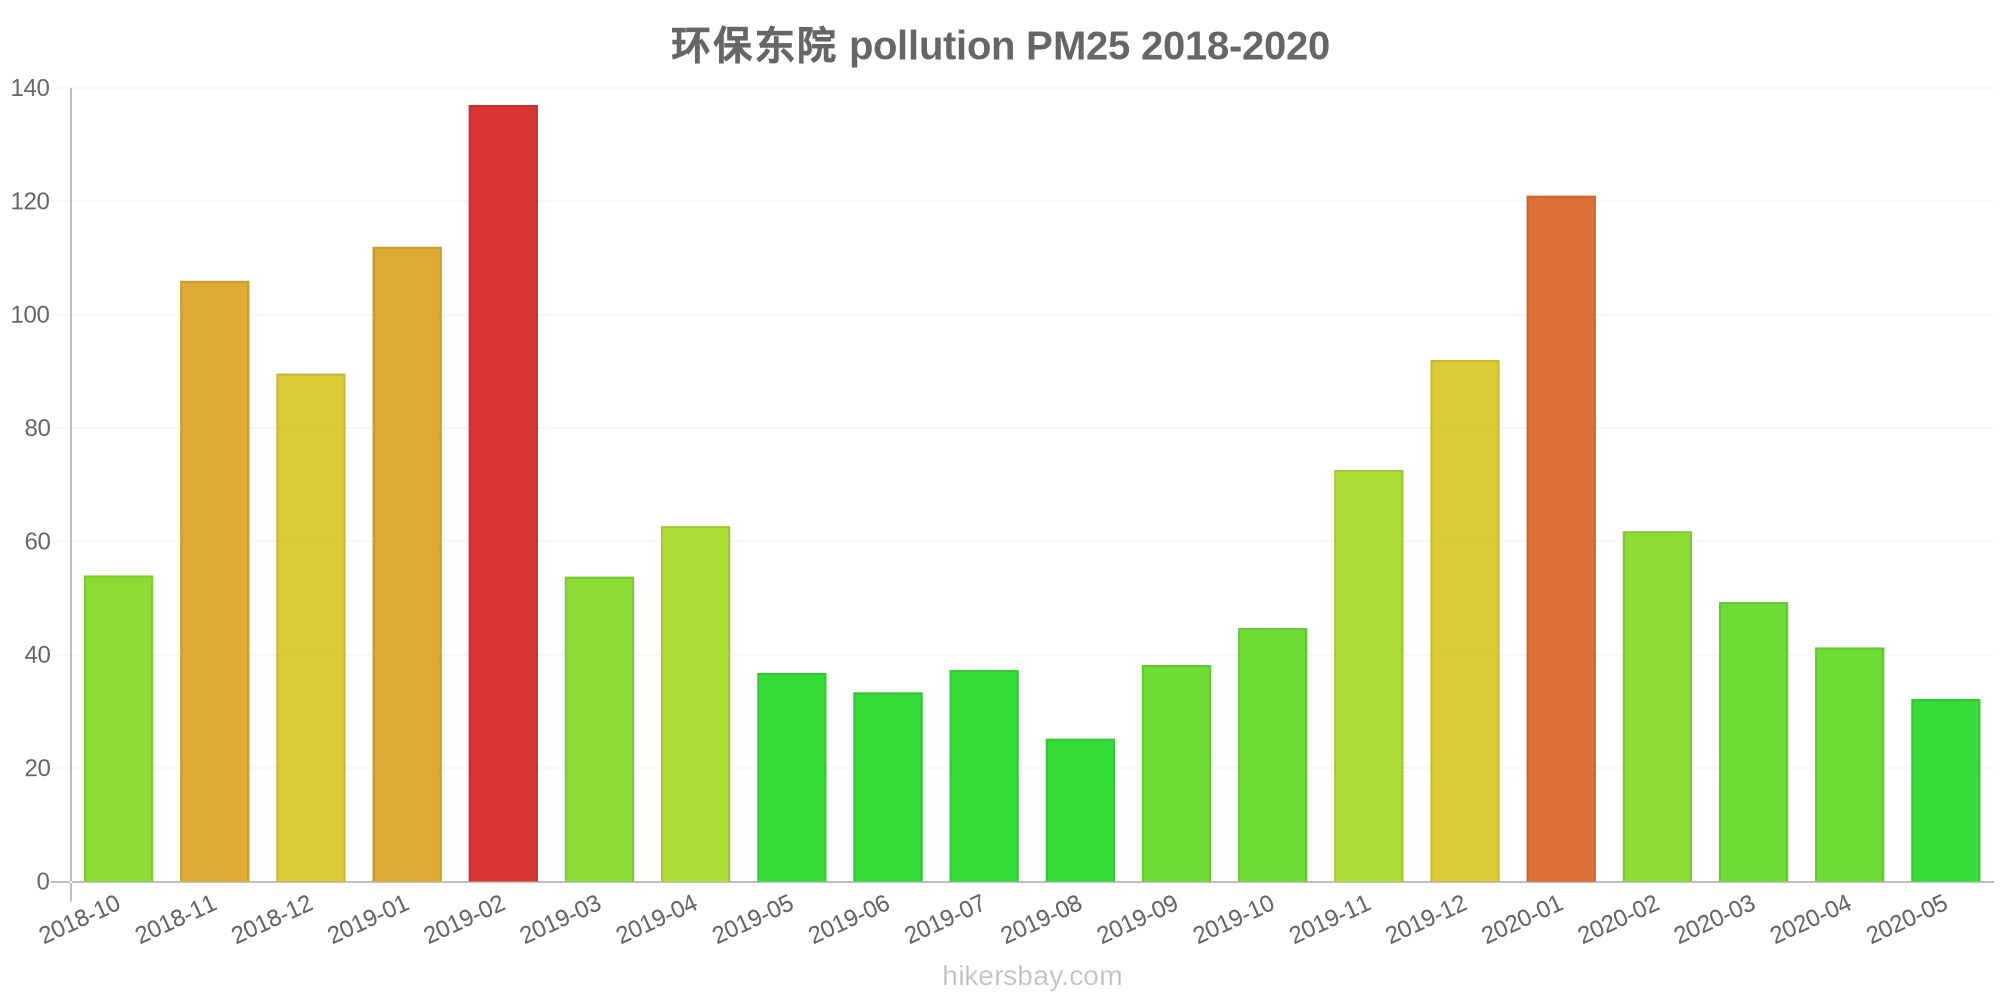
The highest PM2.5 values were recorded: 137 (February 2019).
The lowest level of particulate matter PM2.5 pollution occurs in month: August (25).
How is the O3 level today in Liuzhuangying? (ozone (O3))
0 (Good)
How high is the level of NO2? (nitrogen dioxide (NO2))
0 (Good)
What is the level of SO2 pollution? (sulfur dioxide (SO2))
0 (Good)
Current data Friday, May 27, 2022, 12:00 PM
PM10 179 (Very bad Hazardous)
PM2,5 35 (Unhealthy for Sensitive Groups)
O3 0 (Good)
NO2 0 (Good)
SO2 0 (Good)
Data on air pollution from recent days in Liuzhuangying
index
2022-05-27
pm10
56
Unhealthy for Sensitive Groups
pm25
56
Unhealthy
o3
0
Good
no2
0
Good
so2
0
Good
data source »
Air pollution in Liuzhuangying from October 2018 to May 2020

index
2020-05
2020-04
2020-03
2020-02
2020-01
2019-12
2019-11
2019-10
2019-09
2019-08
2019-07
2019-06
2019-05
2019-04
2019-03
2019-02
2019-01
2018-12
2018-11
2018-10
pm25
32 (Moderate)
41 (Unhealthy for Sensitive Groups)
49 (Unhealthy for Sensitive Groups)
62 (Unhealthy)
121 (Very bad Hazardous)
92 (Very Unhealthy)
73 (Unhealthy)
45 (Unhealthy for Sensitive Groups)
38 (Unhealthy for Sensitive Groups)
25 (Moderate)
37 (Unhealthy for Sensitive Groups)
33 (Moderate)
37 (Unhealthy for Sensitive Groups)
63 (Unhealthy)
54 (Unhealthy for Sensitive Groups)
137 (Very bad Hazardous)
112 (Very bad Hazardous)
90 (Very Unhealthy)
106 (Very Unhealthy)
54 (Unhealthy for Sensitive Groups)
co
822 (Good)
724 (Good)
905 (Good)
1 (Good)
1 (Good)
1 (Good)
1 (Good)
1 (Good)
952 (Good)
821 (Good)
770 (Good)
839 (Good)
767 (Good)
1 (Good)
1 (Good)
1 (Good)
1 (Good)
1 (Good)
1 (Good)
875 (Good)
no2
27 (Good)
41 (Moderate)
33 (Good)
17 (Good)
49 (Moderate)
53 (Moderate)
52 (Moderate)
47 (Moderate)
43 (Moderate)
30 (Good)
29 (Good)
32 (Good)
36 (Good)
44 (Moderate)
43 (Moderate)
43 (Moderate)
68 (Moderate)
65 (Moderate)
66 (Moderate)
62 (Moderate)
o3
150 (Unhealthy)
132 (Unhealthy for Sensitive Groups)
101 (Moderate)
86 (Moderate)
62 (Good)
45 (Good)
77 (Moderate)
104 (Moderate)
161 (Unhealthy)
145 (Unhealthy for Sensitive Groups)
161 (Unhealthy)
207 (Very Unhealthy)
172 (Unhealthy)
132 (Unhealthy for Sensitive Groups)
111 (Moderate)
91 (Moderate)
52 (Good)
48 (Good)
70 (Good)
106 (Moderate)
pm10
79 (Unhealthy for Sensitive Groups)
90 (Unhealthy)
95 (Unhealthy)
82 (Unhealthy)
153 (Very bad Hazardous)
130 (Very Unhealthy)
136 (Very Unhealthy)
96 (Unhealthy)
81 (Unhealthy)
60 (Unhealthy for Sensitive Groups)
67 (Unhealthy for Sensitive Groups)
86 (Unhealthy)
102 (Unhealthy)
127 (Very Unhealthy)
108 (Unhealthy)
171 (Very bad Hazardous)
167 (Very bad Hazardous)
156 (Very bad Hazardous)
172 (Very bad Hazardous)
99 (Unhealthy)
so2
11 (Good)
17 (Good)
15 (Good)
13 (Good)
15 (Good)
15 (Good)
17 (Good)
15 (Good)
17 (Good)
12 (Good)
10 (Good)
12 (Good)
15 (Good)
17 (Good)
20 (Good)
15 (Good)
24 (Good)
19 (Good)
15 (Good)
20 (Good)
data source »
环保东院
Friday, May 27, 2022, 12:00 PM
PM10 179 (Very bad Hazardous)
particulate matter (PM10) suspended dust
PM2,5 35 (Unhealthy for Sensitive Groups)
particulate matter (PM2.5) dust
O3 0.04 (Good)
ozone (O3)
NO2 0 (Good)
nitrogen dioxide (NO2)
SO2 0 (Good)
sulfur dioxide (SO2)
环保东院
index
2022-05-27
pm10
56
pm25
56
o3
0.03
no2
0
so2
0
环保东院
2018-10 2020-05
index
2020-05
2020-04
2020-03
2020-02
2020-01
2019-12
2019-11
2019-10
2019-09
2019-08
2019-07
2019-06
2019-05
2019-04
2019-03
2019-02
2019-01
2018-12
2018-11
2018-10
pm25
32
41
49
62
121
92
73
45
38
25
37
33
37
63
54
137
112
90
106
54
co
822
724
905
1
1
1
1
1
952
821
770
839
767
1
1
1
1
1
1
875
no2
27
41
33
17
49
53
52
47
43
30
29
32
36
44
43
43
68
65
66
62
o3
150
132
101
86
62
45
77
104
161
145
161
207
172
132
111
91
52
48
70
106
pm10
79
90
95
82
153
130
136
96
81
60
67
86
102
127
108
171
167
156
172
99
so2
11
17
15
13
15
15
17
15
17
12
10
12
15
17
20
15
24
19
15
20
* Pollution data source:
https://openaq.org
(ChinaAQIData)
The data is licensed under CC-By 4.0
PM10 179 (Very bad Hazardous)
PM2,5 35 (Unhealthy for Sensitive Groups)
O3 0 (Good)
NO2 0 (Good)
SO2 0 (Good)
Data on air pollution from recent days in Liuzhuangying
| index | 2022-05-27 |
|---|---|
| pm10 | 56 Unhealthy for Sensitive Groups |
| pm25 | 56 Unhealthy |
| o3 | 0 Good |
| no2 | 0 Good |
| so2 | 0 Good |

| index | 2020-05 | 2020-04 | 2020-03 | 2020-02 | 2020-01 | 2019-12 | 2019-11 | 2019-10 | 2019-09 | 2019-08 | 2019-07 | 2019-06 | 2019-05 | 2019-04 | 2019-03 | 2019-02 | 2019-01 | 2018-12 | 2018-11 | 2018-10 |
|---|---|---|---|---|---|---|---|---|---|---|---|---|---|---|---|---|---|---|---|---|
| pm25 | 32 (Moderate) | 41 (Unhealthy for Sensitive Groups) | 49 (Unhealthy for Sensitive Groups) | 62 (Unhealthy) | 121 (Very bad Hazardous) | 92 (Very Unhealthy) | 73 (Unhealthy) | 45 (Unhealthy for Sensitive Groups) | 38 (Unhealthy for Sensitive Groups) | 25 (Moderate) | 37 (Unhealthy for Sensitive Groups) | 33 (Moderate) | 37 (Unhealthy for Sensitive Groups) | 63 (Unhealthy) | 54 (Unhealthy for Sensitive Groups) | 137 (Very bad Hazardous) | 112 (Very bad Hazardous) | 90 (Very Unhealthy) | 106 (Very Unhealthy) | 54 (Unhealthy for Sensitive Groups) |
| co | 822 (Good) | 724 (Good) | 905 (Good) | 1 (Good) | 1 (Good) | 1 (Good) | 1 (Good) | 1 (Good) | 952 (Good) | 821 (Good) | 770 (Good) | 839 (Good) | 767 (Good) | 1 (Good) | 1 (Good) | 1 (Good) | 1 (Good) | 1 (Good) | 1 (Good) | 875 (Good) |
| no2 | 27 (Good) | 41 (Moderate) | 33 (Good) | 17 (Good) | 49 (Moderate) | 53 (Moderate) | 52 (Moderate) | 47 (Moderate) | 43 (Moderate) | 30 (Good) | 29 (Good) | 32 (Good) | 36 (Good) | 44 (Moderate) | 43 (Moderate) | 43 (Moderate) | 68 (Moderate) | 65 (Moderate) | 66 (Moderate) | 62 (Moderate) |
| o3 | 150 (Unhealthy) | 132 (Unhealthy for Sensitive Groups) | 101 (Moderate) | 86 (Moderate) | 62 (Good) | 45 (Good) | 77 (Moderate) | 104 (Moderate) | 161 (Unhealthy) | 145 (Unhealthy for Sensitive Groups) | 161 (Unhealthy) | 207 (Very Unhealthy) | 172 (Unhealthy) | 132 (Unhealthy for Sensitive Groups) | 111 (Moderate) | 91 (Moderate) | 52 (Good) | 48 (Good) | 70 (Good) | 106 (Moderate) |
| pm10 | 79 (Unhealthy for Sensitive Groups) | 90 (Unhealthy) | 95 (Unhealthy) | 82 (Unhealthy) | 153 (Very bad Hazardous) | 130 (Very Unhealthy) | 136 (Very Unhealthy) | 96 (Unhealthy) | 81 (Unhealthy) | 60 (Unhealthy for Sensitive Groups) | 67 (Unhealthy for Sensitive Groups) | 86 (Unhealthy) | 102 (Unhealthy) | 127 (Very Unhealthy) | 108 (Unhealthy) | 171 (Very bad Hazardous) | 167 (Very bad Hazardous) | 156 (Very bad Hazardous) | 172 (Very bad Hazardous) | 99 (Unhealthy) |
| so2 | 11 (Good) | 17 (Good) | 15 (Good) | 13 (Good) | 15 (Good) | 15 (Good) | 17 (Good) | 15 (Good) | 17 (Good) | 12 (Good) | 10 (Good) | 12 (Good) | 15 (Good) | 17 (Good) | 20 (Good) | 15 (Good) | 24 (Good) | 19 (Good) | 15 (Good) | 20 (Good) |
PM10 179 (Very bad Hazardous)
particulate matter (PM10) suspended dustPM2,5 35 (Unhealthy for Sensitive Groups)
particulate matter (PM2.5) dustO3 0.04 (Good)
ozone (O3)NO2 0 (Good)
nitrogen dioxide (NO2)SO2 0 (Good)
sulfur dioxide (SO2)环保东院
| index | 2022-05-27 |
|---|---|
| pm10 | 56 |
| pm25 | 56 |
| o3 | 0.03 |
| no2 | 0 |
| so2 | 0 |
环保东院
| index | 2020-05 | 2020-04 | 2020-03 | 2020-02 | 2020-01 | 2019-12 | 2019-11 | 2019-10 | 2019-09 | 2019-08 | 2019-07 | 2019-06 | 2019-05 | 2019-04 | 2019-03 | 2019-02 | 2019-01 | 2018-12 | 2018-11 | 2018-10 |
|---|---|---|---|---|---|---|---|---|---|---|---|---|---|---|---|---|---|---|---|---|
| pm25 | 32 | 41 | 49 | 62 | 121 | 92 | 73 | 45 | 38 | 25 | 37 | 33 | 37 | 63 | 54 | 137 | 112 | 90 | 106 | 54 |
| co | 822 | 724 | 905 | 1 | 1 | 1 | 1 | 1 | 952 | 821 | 770 | 839 | 767 | 1 | 1 | 1 | 1 | 1 | 1 | 875 |
| no2 | 27 | 41 | 33 | 17 | 49 | 53 | 52 | 47 | 43 | 30 | 29 | 32 | 36 | 44 | 43 | 43 | 68 | 65 | 66 | 62 |
| o3 | 150 | 132 | 101 | 86 | 62 | 45 | 77 | 104 | 161 | 145 | 161 | 207 | 172 | 132 | 111 | 91 | 52 | 48 | 70 | 106 |
| pm10 | 79 | 90 | 95 | 82 | 153 | 130 | 136 | 96 | 81 | 60 | 67 | 86 | 102 | 127 | 108 | 171 | 167 | 156 | 172 | 99 |
| so2 | 11 | 17 | 15 | 13 | 15 | 15 | 17 | 15 | 17 | 12 | 10 | 12 | 15 | 17 | 20 | 15 | 24 | 19 | 15 | 20 |