Air Pollution in Taxi: Real-time Air Quality Index and smog alert.
Pollution and air quality forecast for Taxi. Today is Tuesday, June 2, 2026. The following air pollution values have been recorded for Taxi:- particulate matter (PM10) suspended dust - 179 (Very bad Hazardous)
- particulate matter (PM2.5) dust - 35 (Unhealthy for Sensitive Groups)
- ozone (O3) - 0 (Good)
- nitrogen dioxide (NO2) - 0 (Good)
- sulfur dioxide (SO2) - 0 (Good)

What is the air quality in Taxi today? Is the air polluted in Taxi?. Is there smog?
What is the level of PM10 today in Taxi? (particulate matter (PM10) suspended dust)
The current level of particulate matter PM10 in Taxi is:
179 (Very bad Hazardous)
The highest PM10 values usually occur in month: 211 (January 2019).
The lowest value of particulate matter PM10 pollution in Taxi is usually recorded in: June (59).
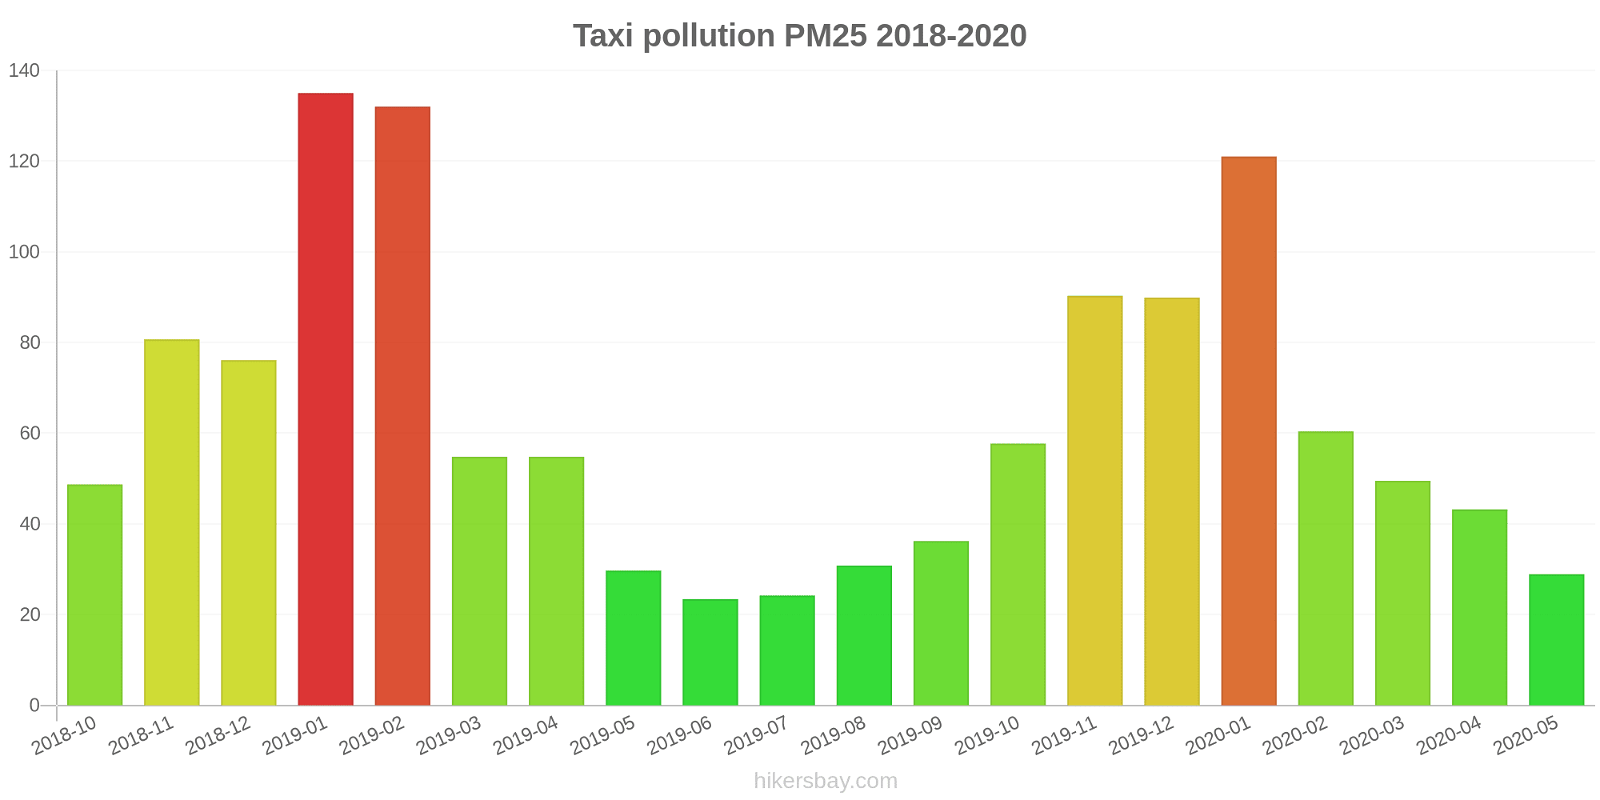
What is the current level of PM2.5 in Taxi? (particulate matter (PM2.5) dust)
Today's PM2.5 level is:
35 (Unhealthy for Sensitive Groups)
For comparison, the highest level of PM2.5 in Taxi in the last 7 days was: 56 (Friday, May 27, 2022) and the lowest: 56 (Friday, May 27, 2022).
The highest PM2.5 values were recorded: 135 (January 2019).
The lowest level of particulate matter PM2.5 pollution occurs in month: June (23).
How is the O3 level today in Taxi? (ozone (O3))
0 (Good)
How high is the level of NO2? (nitrogen dioxide (NO2))
0 (Good)
What is the level of SO2 pollution? (sulfur dioxide (SO2))
0 (Good)
Current data Friday, May 27, 2022, 12:00 PM
PM10 179 (Very bad Hazardous)
PM2,5 35 (Unhealthy for Sensitive Groups)
O3 0 (Good)
NO2 0 (Good)
SO2 0 (Good)
Data on air pollution from recent days in Taxi
index
2022-05-27
pm10
56
Unhealthy for Sensitive Groups
pm25
56
Unhealthy
o3
0
Good
no2
0
Good
so2
0
Good
data source »
Air pollution in Taxi from October 2018 to May 2020
index
2020-05
2020-04
2020-03
2020-02
2020-01
2019-12
2019-11
2019-10
2019-09
2019-08
2019-07
2019-06
2019-05
2019-04
2019-03
2019-02
2019-01
2018-12
2018-11
2018-10
pm25
29 (Moderate)
43 (Unhealthy for Sensitive Groups)
50 (Unhealthy for Sensitive Groups)
60 (Unhealthy)
121 (Very bad Hazardous)
90 (Very Unhealthy)
90 (Very Unhealthy)
58 (Unhealthy)
36 (Unhealthy for Sensitive Groups)
31 (Moderate)
24 (Moderate)
23 (Moderate)
30 (Moderate)
55 (Unhealthy for Sensitive Groups)
55 (Unhealthy for Sensitive Groups)
132 (Very bad Hazardous)
135 (Very bad Hazardous)
76 (Very Unhealthy)
81 (Very Unhealthy)
49 (Unhealthy for Sensitive Groups)
co
589 (Good)
736 (Good)
726 (Good)
902 (Good)
1 (Good)
1 (Good)
822 (Good)
698 (Good)
536 (Good)
705 (Good)
580 (Good)
512 (Good)
457 (Good)
622 (Good)
597 (Good)
1 (Good)
1 (Good)
1 (Good)
1 (Good)
1 (Good)
no2
30 (Good)
36 (Good)
40 (Moderate)
24 (Good)
41 (Moderate)
46 (Moderate)
52 (Moderate)
41 (Moderate)
36 (Good)
25 (Good)
23 (Good)
28 (Good)
35 (Good)
36 (Good)
45 (Moderate)
44 (Moderate)
68 (Moderate)
61 (Moderate)
58 (Moderate)
60 (Moderate)
o3
145 (Unhealthy for Sensitive Groups)
130 (Unhealthy for Sensitive Groups)
101 (Moderate)
91 (Moderate)
59 (Good)
56 (Good)
77 (Moderate)
99 (Moderate)
154 (Unhealthy)
183 (Very Unhealthy)
191 (Very Unhealthy)
187 (Very Unhealthy)
169 (Unhealthy)
134 (Unhealthy for Sensitive Groups)
107 (Moderate)
80 (Moderate)
43 (Good)
41 (Good)
63 (Good)
94 (Moderate)
pm10
64 (Unhealthy for Sensitive Groups)
91 (Unhealthy)
108 (Unhealthy)
87 (Unhealthy)
145 (Very Unhealthy)
145 (Very Unhealthy)
153 (Very bad Hazardous)
104 (Unhealthy)
73 (Unhealthy for Sensitive Groups)
69 (Unhealthy for Sensitive Groups)
60 (Unhealthy for Sensitive Groups)
59 (Unhealthy for Sensitive Groups)
96 (Unhealthy)
117 (Very Unhealthy)
133 (Very Unhealthy)
191 (Very bad Hazardous)
211 (Very bad Hazardous)
138 (Very Unhealthy)
146 (Very Unhealthy)
99 (Unhealthy)
so2
8 (Good)
11 (Good)
8.6 (Good)
6.3 (Good)
10 (Good)
12 (Good)
12 (Good)
8.5 (Good)
11 (Good)
8.1 (Good)
6 (Good)
5.9 (Good)
8.8 (Good)
9.3 (Good)
11 (Good)
11 (Good)
19 (Good)
23 (Good)
16 (Good)
21 (Good)
data source »
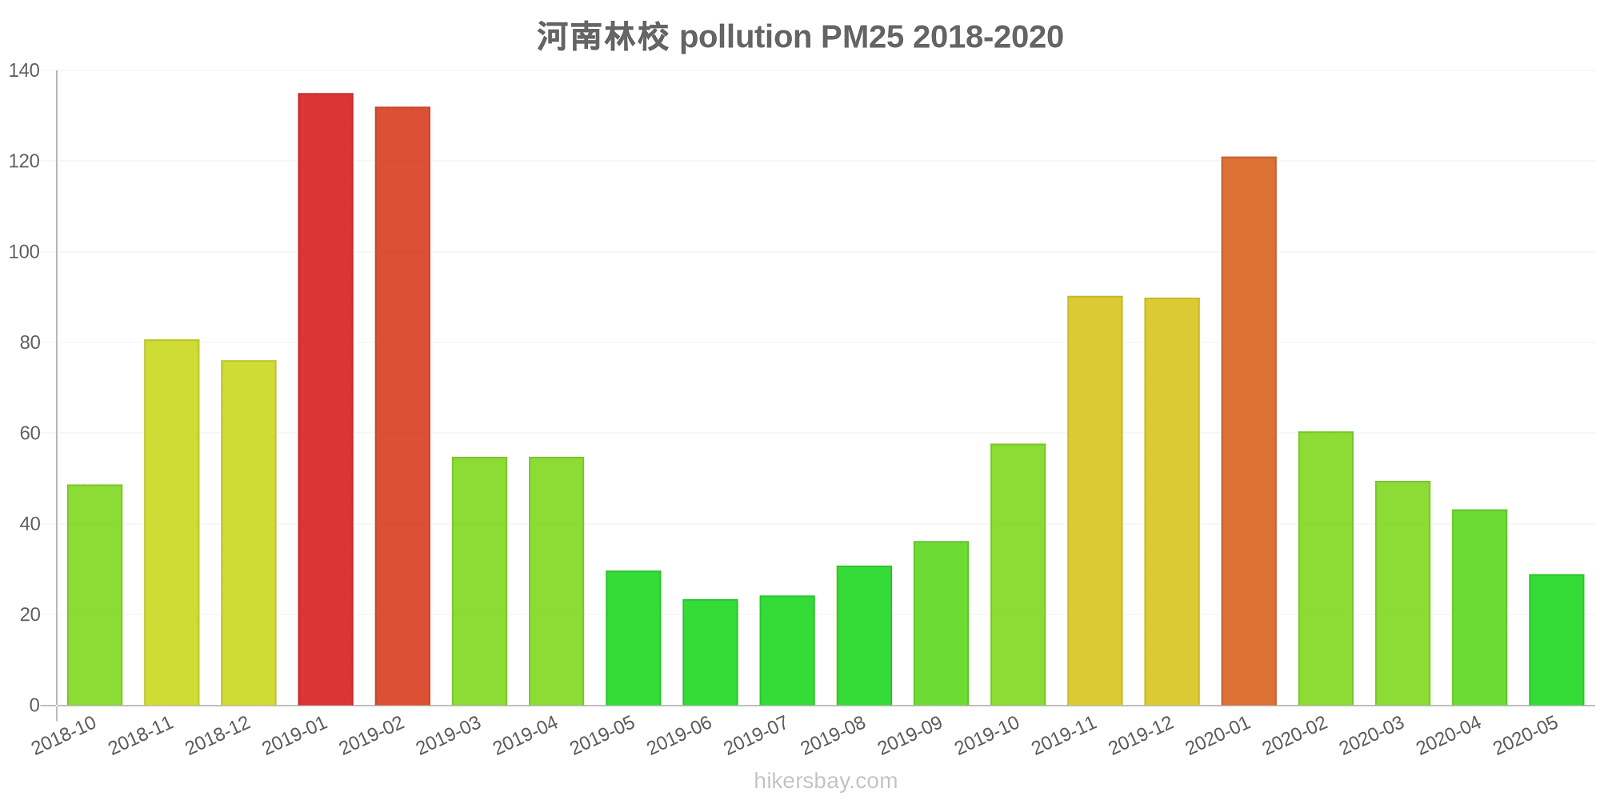
河南林校
Friday, May 27, 2022, 12:00 PM
PM10 179 (Very bad Hazardous)
particulate matter (PM10) suspended dust
PM2,5 35 (Unhealthy for Sensitive Groups)
particulate matter (PM2.5) dust
O3 0.04 (Good)
ozone (O3)
NO2 0 (Good)
nitrogen dioxide (NO2)
SO2 0 (Good)
sulfur dioxide (SO2)
河南林校
index
2022-05-27
pm10
56
pm25
56
o3
0.03
no2
0
so2
0
河南林校
2018-10 2020-05
index
2020-05
2020-04
2020-03
2020-02
2020-01
2019-12
2019-11
2019-10
2019-09
2019-08
2019-07
2019-06
2019-05
2019-04
2019-03
2019-02
2019-01
2018-12
2018-11
2018-10
pm25
29
43
50
60
121
90
90
58
36
31
24
23
30
55
55
132
135
76
81
49
co
589
736
726
902
1
1
822
698
536
705
580
512
457
622
597
1
1
1
1
1
no2
30
36
40
24
41
46
52
41
36
25
23
28
35
36
45
44
68
61
58
60
o3
145
130
101
91
59
56
77
99
154
183
191
187
169
134
107
80
43
41
63
94
pm10
64
91
108
87
145
145
153
104
73
69
60
59
96
117
133
191
211
138
146
99
so2
8
11
8.6
6.3
10
12
12
8.5
11
8.1
6
5.9
8.8
9.3
11
11
19
23
16
21
* Pollution data source:
https://openaq.org
(ChinaAQIData)
The data is licensed under CC-By 4.0
PM10 179 (Very bad Hazardous)
PM2,5 35 (Unhealthy for Sensitive Groups)
O3 0 (Good)
NO2 0 (Good)
SO2 0 (Good)
Data on air pollution from recent days in Taxi
| index | 2022-05-27 |
|---|---|
| pm10 | 56 Unhealthy for Sensitive Groups |
| pm25 | 56 Unhealthy |
| o3 | 0 Good |
| no2 | 0 Good |
| so2 | 0 Good |
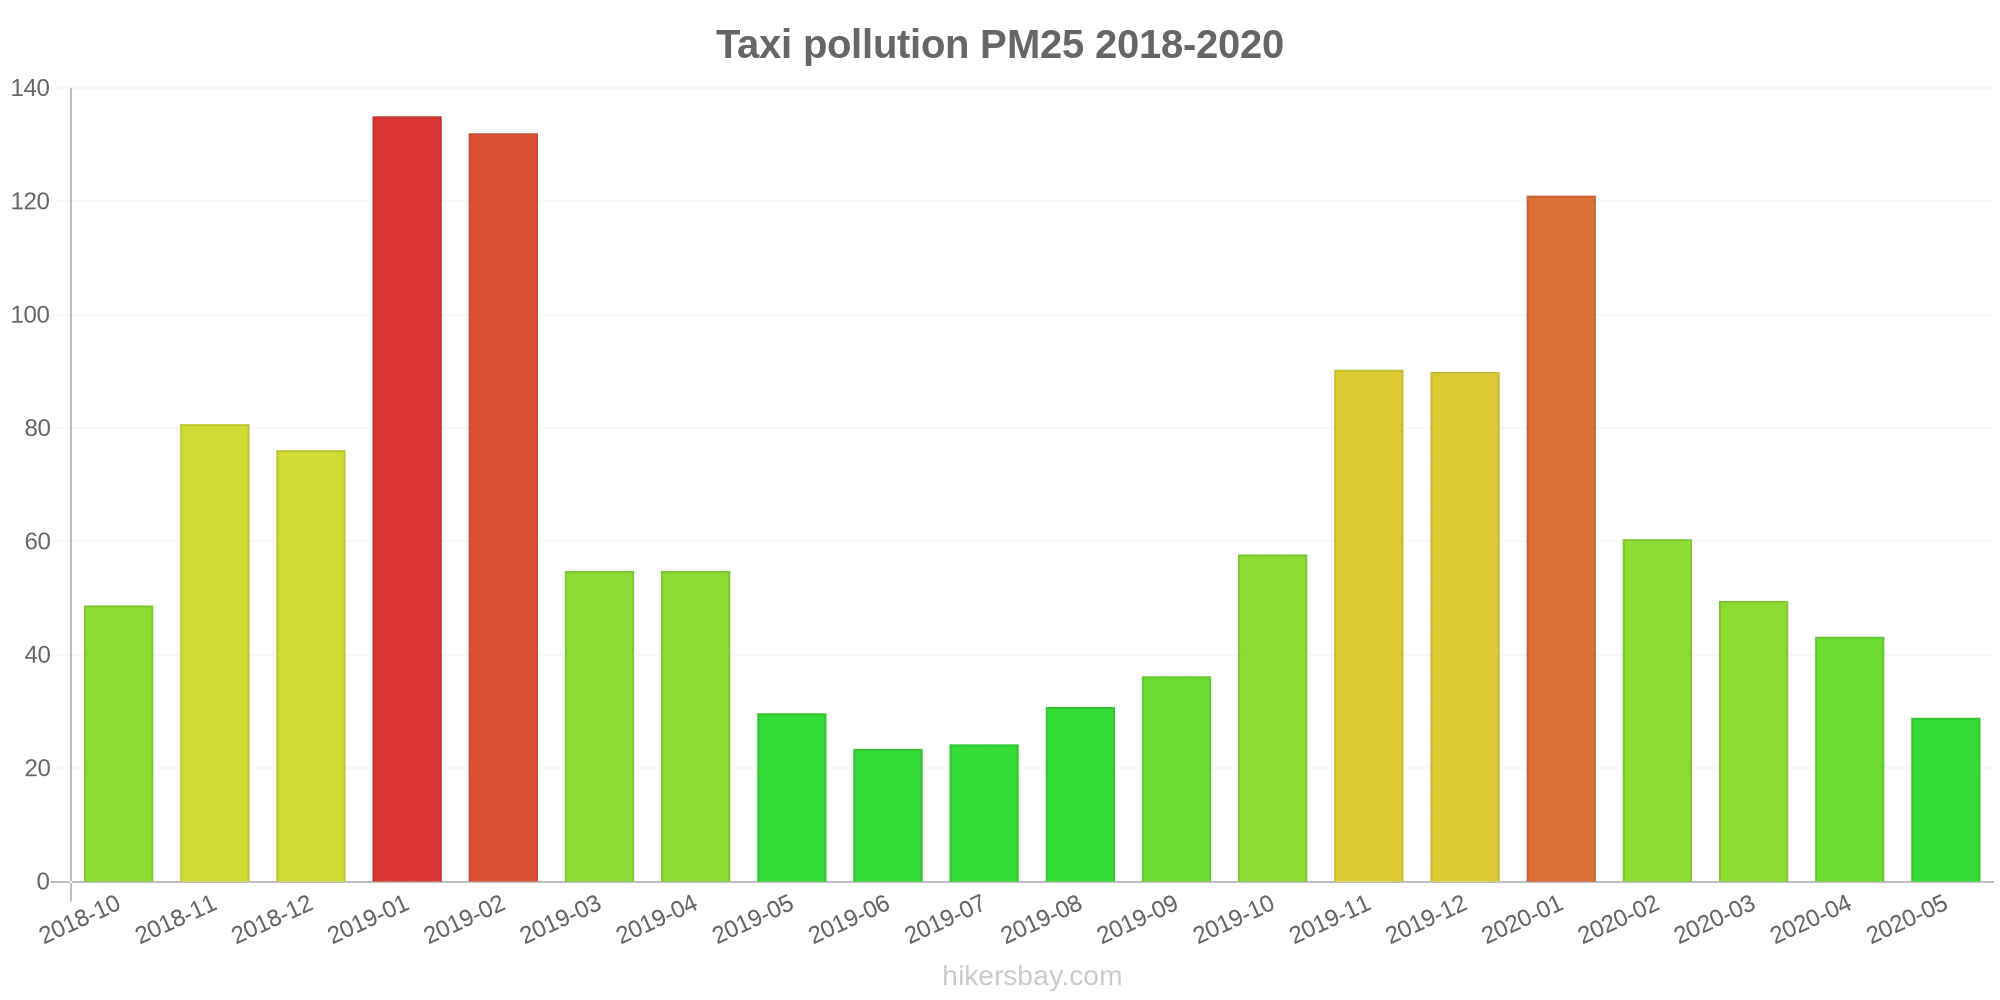
| index | 2020-05 | 2020-04 | 2020-03 | 2020-02 | 2020-01 | 2019-12 | 2019-11 | 2019-10 | 2019-09 | 2019-08 | 2019-07 | 2019-06 | 2019-05 | 2019-04 | 2019-03 | 2019-02 | 2019-01 | 2018-12 | 2018-11 | 2018-10 |
|---|---|---|---|---|---|---|---|---|---|---|---|---|---|---|---|---|---|---|---|---|
| pm25 | 29 (Moderate) | 43 (Unhealthy for Sensitive Groups) | 50 (Unhealthy for Sensitive Groups) | 60 (Unhealthy) | 121 (Very bad Hazardous) | 90 (Very Unhealthy) | 90 (Very Unhealthy) | 58 (Unhealthy) | 36 (Unhealthy for Sensitive Groups) | 31 (Moderate) | 24 (Moderate) | 23 (Moderate) | 30 (Moderate) | 55 (Unhealthy for Sensitive Groups) | 55 (Unhealthy for Sensitive Groups) | 132 (Very bad Hazardous) | 135 (Very bad Hazardous) | 76 (Very Unhealthy) | 81 (Very Unhealthy) | 49 (Unhealthy for Sensitive Groups) |
| co | 589 (Good) | 736 (Good) | 726 (Good) | 902 (Good) | 1 (Good) | 1 (Good) | 822 (Good) | 698 (Good) | 536 (Good) | 705 (Good) | 580 (Good) | 512 (Good) | 457 (Good) | 622 (Good) | 597 (Good) | 1 (Good) | 1 (Good) | 1 (Good) | 1 (Good) | 1 (Good) |
| no2 | 30 (Good) | 36 (Good) | 40 (Moderate) | 24 (Good) | 41 (Moderate) | 46 (Moderate) | 52 (Moderate) | 41 (Moderate) | 36 (Good) | 25 (Good) | 23 (Good) | 28 (Good) | 35 (Good) | 36 (Good) | 45 (Moderate) | 44 (Moderate) | 68 (Moderate) | 61 (Moderate) | 58 (Moderate) | 60 (Moderate) |
| o3 | 145 (Unhealthy for Sensitive Groups) | 130 (Unhealthy for Sensitive Groups) | 101 (Moderate) | 91 (Moderate) | 59 (Good) | 56 (Good) | 77 (Moderate) | 99 (Moderate) | 154 (Unhealthy) | 183 (Very Unhealthy) | 191 (Very Unhealthy) | 187 (Very Unhealthy) | 169 (Unhealthy) | 134 (Unhealthy for Sensitive Groups) | 107 (Moderate) | 80 (Moderate) | 43 (Good) | 41 (Good) | 63 (Good) | 94 (Moderate) |
| pm10 | 64 (Unhealthy for Sensitive Groups) | 91 (Unhealthy) | 108 (Unhealthy) | 87 (Unhealthy) | 145 (Very Unhealthy) | 145 (Very Unhealthy) | 153 (Very bad Hazardous) | 104 (Unhealthy) | 73 (Unhealthy for Sensitive Groups) | 69 (Unhealthy for Sensitive Groups) | 60 (Unhealthy for Sensitive Groups) | 59 (Unhealthy for Sensitive Groups) | 96 (Unhealthy) | 117 (Very Unhealthy) | 133 (Very Unhealthy) | 191 (Very bad Hazardous) | 211 (Very bad Hazardous) | 138 (Very Unhealthy) | 146 (Very Unhealthy) | 99 (Unhealthy) |
| so2 | 8 (Good) | 11 (Good) | 8.6 (Good) | 6.3 (Good) | 10 (Good) | 12 (Good) | 12 (Good) | 8.5 (Good) | 11 (Good) | 8.1 (Good) | 6 (Good) | 5.9 (Good) | 8.8 (Good) | 9.3 (Good) | 11 (Good) | 11 (Good) | 19 (Good) | 23 (Good) | 16 (Good) | 21 (Good) |
PM10 179 (Very bad Hazardous)
particulate matter (PM10) suspended dustPM2,5 35 (Unhealthy for Sensitive Groups)
particulate matter (PM2.5) dustO3 0.04 (Good)
ozone (O3)NO2 0 (Good)
nitrogen dioxide (NO2)SO2 0 (Good)
sulfur dioxide (SO2)河南林校
| index | 2022-05-27 |
|---|---|
| pm10 | 56 |
| pm25 | 56 |
| o3 | 0.03 |
| no2 | 0 |
| so2 | 0 |
河南林校

| index | 2020-05 | 2020-04 | 2020-03 | 2020-02 | 2020-01 | 2019-12 | 2019-11 | 2019-10 | 2019-09 | 2019-08 | 2019-07 | 2019-06 | 2019-05 | 2019-04 | 2019-03 | 2019-02 | 2019-01 | 2018-12 | 2018-11 | 2018-10 |
|---|---|---|---|---|---|---|---|---|---|---|---|---|---|---|---|---|---|---|---|---|
| pm25 | 29 | 43 | 50 | 60 | 121 | 90 | 90 | 58 | 36 | 31 | 24 | 23 | 30 | 55 | 55 | 132 | 135 | 76 | 81 | 49 |
| co | 589 | 736 | 726 | 902 | 1 | 1 | 822 | 698 | 536 | 705 | 580 | 512 | 457 | 622 | 597 | 1 | 1 | 1 | 1 | 1 |
| no2 | 30 | 36 | 40 | 24 | 41 | 46 | 52 | 41 | 36 | 25 | 23 | 28 | 35 | 36 | 45 | 44 | 68 | 61 | 58 | 60 |
| o3 | 145 | 130 | 101 | 91 | 59 | 56 | 77 | 99 | 154 | 183 | 191 | 187 | 169 | 134 | 107 | 80 | 43 | 41 | 63 | 94 |
| pm10 | 64 | 91 | 108 | 87 | 145 | 145 | 153 | 104 | 73 | 69 | 60 | 59 | 96 | 117 | 133 | 191 | 211 | 138 | 146 | 99 |
| so2 | 8 | 11 | 8.6 | 6.3 | 10 | 12 | 12 | 8.5 | 11 | 8.1 | 6 | 5.9 | 8.8 | 9.3 | 11 | 11 | 19 | 23 | 16 | 21 |