Air Pollution in Sunqituncun: Real-time Air Quality Index and smog alert.
Pollution and air quality forecast for Sunqituncun. Today is Tuesday, June 2, 2026. The following air pollution values have been recorded for Sunqituncun:- particulate matter (PM10) suspended dust - 179 (Very bad Hazardous)
- particulate matter (PM2.5) dust - 35 (Unhealthy for Sensitive Groups)
- ozone (O3) - 0 (Good)
- nitrogen dioxide (NO2) - 0 (Good)
- sulfur dioxide (SO2) - 0 (Good)

What is the air quality in Sunqituncun today? Is the air polluted in Sunqituncun?. Is there smog?
What is the level of PM10 today in Sunqituncun? (particulate matter (PM10) suspended dust)
The current level of particulate matter PM10 in Sunqituncun is:
179 (Very bad Hazardous)
The highest PM10 values usually occur in month: 145 (January 2019).
The lowest value of particulate matter PM10 pollution in Sunqituncun is usually recorded in: July (45).
What is the current level of PM2.5 in Sunqituncun? (particulate matter (PM2.5) dust)
Today's PM2.5 level is:
35 (Unhealthy for Sensitive Groups)
For comparison, the highest level of PM2.5 in Sunqituncun in the last 7 days was: 56 (Friday, May 27, 2022) and the lowest: 56 (Friday, May 27, 2022).
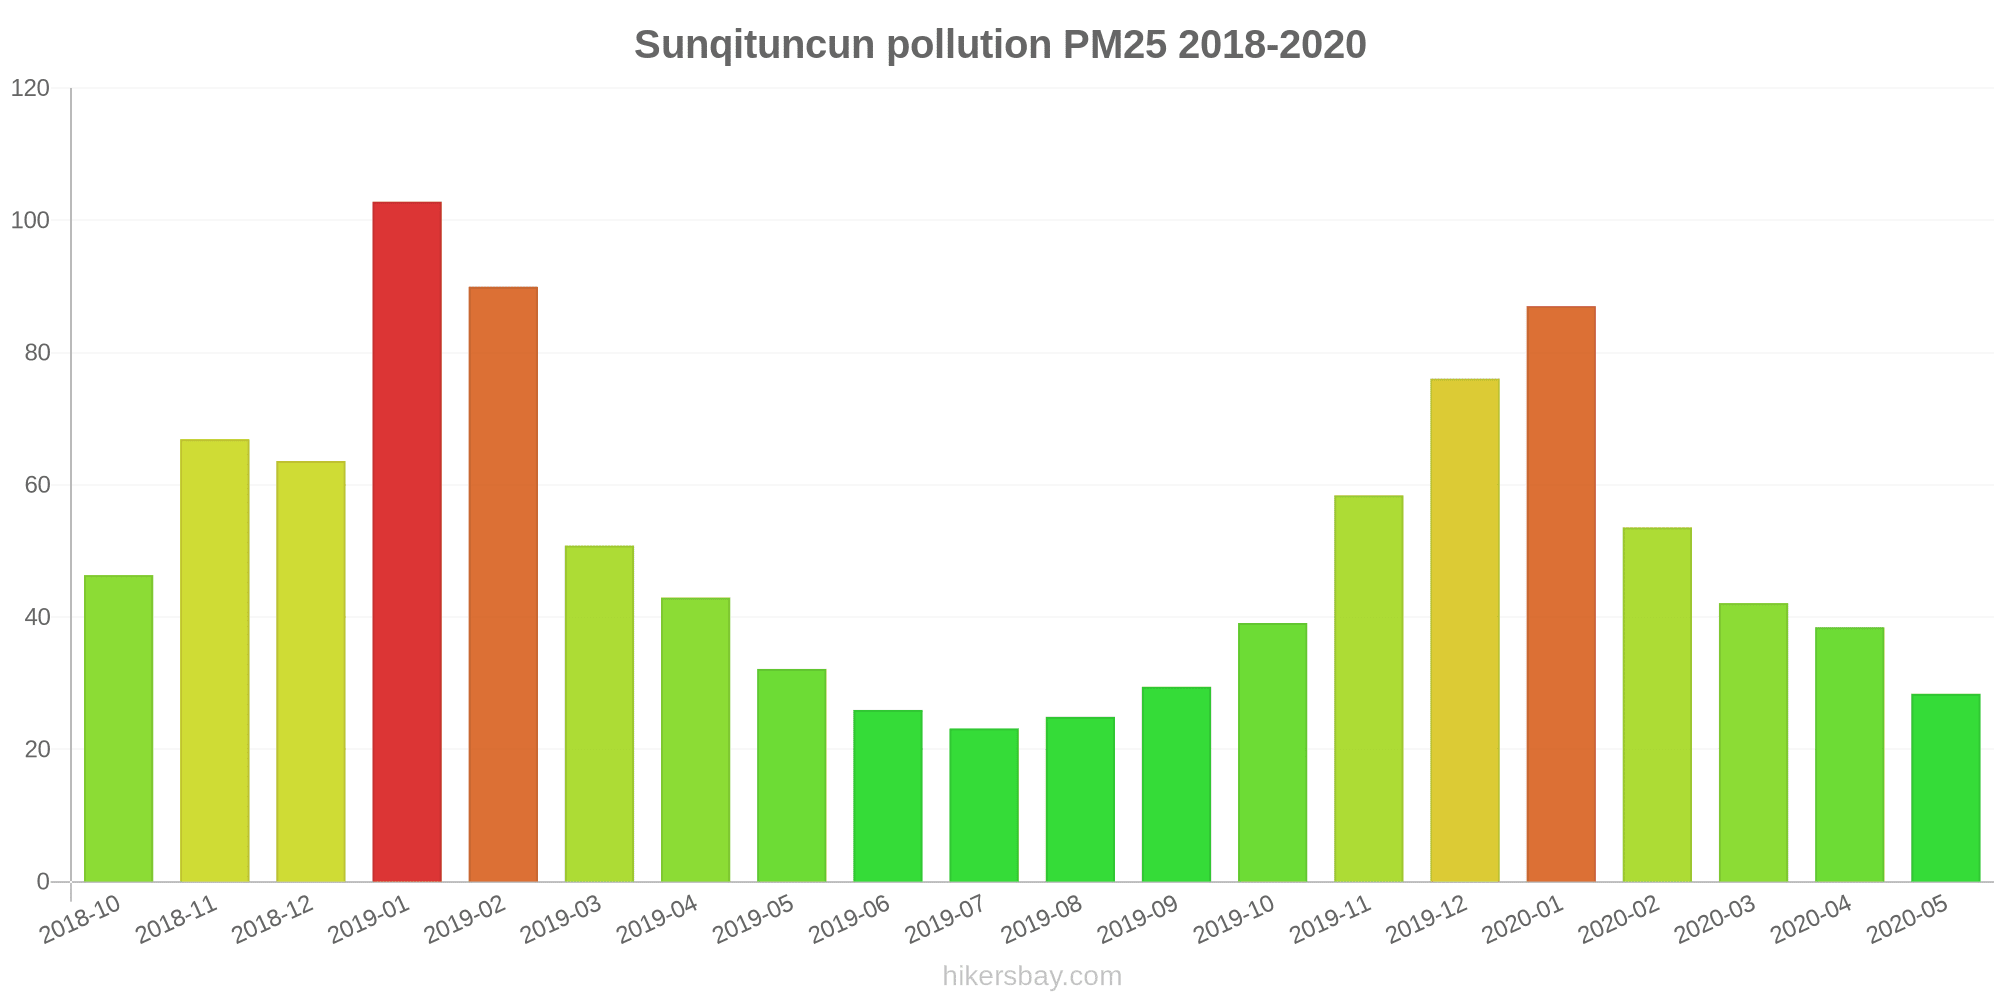
The highest PM2.5 values were recorded: 103 (January 2019).
The lowest level of particulate matter PM2.5 pollution occurs in month: July (23).
How is the O3 level today in Sunqituncun? (ozone (O3))
0 (Good)
How high is the level of NO2? (nitrogen dioxide (NO2))
0 (Good)
What is the level of SO2 pollution? (sulfur dioxide (SO2))
0 (Good)
Current data Friday, May 27, 2022, 12:00 PM
PM10 179 (Very bad Hazardous)
PM2,5 35 (Unhealthy for Sensitive Groups)
O3 0 (Good)
NO2 0 (Good)
SO2 0 (Good)
Data on air pollution from recent days in Sunqituncun
index
2022-05-27
pm10
56
Unhealthy for Sensitive Groups
pm25
56
Unhealthy
o3
0
Good
no2
0
Good
so2
0
Good
data source »
Air pollution in Sunqituncun from October 2018 to May 2020

index
2020-05
2020-04
2020-03
2020-02
2020-01
2019-12
2019-11
2019-10
2019-09
2019-08
2019-07
2019-06
2019-05
2019-04
2019-03
2019-02
2019-01
2018-12
2018-11
2018-10
pm25
28 (Moderate)
38 (Unhealthy for Sensitive Groups)
42 (Unhealthy for Sensitive Groups)
54 (Unhealthy for Sensitive Groups)
87 (Very Unhealthy)
76 (Very Unhealthy)
58 (Unhealthy)
39 (Unhealthy for Sensitive Groups)
29 (Moderate)
25 (Moderate)
23 (Moderate)
26 (Moderate)
32 (Moderate)
43 (Unhealthy for Sensitive Groups)
51 (Unhealthy for Sensitive Groups)
90 (Very Unhealthy)
103 (Very Unhealthy)
64 (Unhealthy)
67 (Unhealthy)
46 (Unhealthy for Sensitive Groups)
co
627 (Good)
616 (Good)
674 (Good)
788 (Good)
1 (Good)
481 (Good)
782 (Good)
717 (Good)
639 (Good)
706 (Good)
542 (Good)
591 (Good)
558 (Good)
608 (Good)
716 (Good)
468 (Good)
1 (Good)
498 (Good)
373 (Good)
816 (Good)
no2
36 (Good)
39 (Good)
36 (Good)
21 (Good)
40 (Good)
48 (Moderate)
42 (Moderate)
37 (Good)
31 (Good)
30 (Good)
26 (Good)
29 (Good)
31 (Good)
43 (Moderate)
47 (Moderate)
35 (Good)
60 (Moderate)
49 (Moderate)
47 (Moderate)
47 (Moderate)
o3
158 (Unhealthy)
130 (Unhealthy for Sensitive Groups)
112 (Moderate)
94 (Moderate)
67 (Good)
62 (Good)
70 (Moderate)
99 (Moderate)
140 (Unhealthy for Sensitive Groups)
180 (Unhealthy)
170 (Unhealthy)
182 (Very Unhealthy)
153 (Unhealthy)
143 (Unhealthy for Sensitive Groups)
109 (Moderate)
81 (Moderate)
54 (Good)
40 (Good)
67 (Good)
79 (Moderate)
pm10
71 (Unhealthy for Sensitive Groups)
76 (Unhealthy for Sensitive Groups)
84 (Unhealthy)
73 (Unhealthy for Sensitive Groups)
108 (Unhealthy)
112 (Very Unhealthy)
99 (Unhealthy)
75 (Unhealthy for Sensitive Groups)
55 (Unhealthy for Sensitive Groups)
50 (Unhealthy for Sensitive Groups)
45 (Moderate)
55 (Unhealthy for Sensitive Groups)
86 (Unhealthy)
95 (Unhealthy)
96 (Unhealthy)
122 (Very Unhealthy)
145 (Very Unhealthy)
116 (Very Unhealthy)
114 (Very Unhealthy)
85 (Unhealthy)
so2
9.2 (Good)
9 (Good)
8.8 (Good)
7.1 (Good)
9.9 (Good)
11 (Good)
9.7 (Good)
7.9 (Good)
8.3 (Good)
8.4 (Good)
7.4 (Good)
8.3 (Good)
10 (Good)
11 (Good)
12 (Good)
9.9 (Good)
16 (Good)
15 (Good)
12 (Good)
17 (Good)
data source »
中信二小
Friday, May 27, 2022, 12:00 PM
PM10 179 (Very bad Hazardous)
particulate matter (PM10) suspended dust
PM2,5 35 (Unhealthy for Sensitive Groups)
particulate matter (PM2.5) dust
O3 0.04 (Good)
ozone (O3)
NO2 0 (Good)
nitrogen dioxide (NO2)
SO2 0 (Good)
sulfur dioxide (SO2)
市委党校
Friday, May 27, 2022, 12:00 PM
PM10 179 (Very bad Hazardous)
particulate matter (PM10) suspended dust
PM2,5 35 (Unhealthy for Sensitive Groups)
particulate matter (PM2.5) dust
O3 0.04 (Good)
ozone (O3)
NO2 0 (Good)
nitrogen dioxide (NO2)
SO2 0 (Good)
sulfur dioxide (SO2)
中信二小
index
2022-05-27
pm10
56
pm25
56
o3
0.03
no2
0
so2
0
市委党校
index
2022-05-27
pm10
56
pm25
56
o3
0.03
no2
0
so2
0
中信二小
2018-10 2020-05
index
2020-05
2020-04
2020-03
2020-02
2020-01
2019-12
2019-11
2019-10
2019-09
2019-08
2019-07
2019-06
2019-05
2019-04
2019-03
2019-02
2019-01
2018-12
2018-11
2018-10
pm25
23
42
52
67
120
89
81
55
35
30
29
31
36
52
58
131
132
82
94
58
co
682
710
621
803
1
961
859
806
706
752
540
604
618
719
746
1
1
1
1
824
no2
32
40
39
25
42
51
52
46
37
32
29
31
37
41
49
40
67
60
58
58
o3
147
131
108
102
67
60
72
101
165
183
196
194
167
131
110
85
46
38
65
84
pm10
82
100
109
90
141
131
138
110
71
62
62
75
123
127
119
175
186
154
165
114
so2
9.3
9.6
9.7
8.5
11
12
13
9.5
9.8
7.9
5.1
6.7
11
12
14
13
20
23
17
25
市委党校
2018-10 2020-05

index
2020-05
2020-04
2020-03
2020-02
2020-01
2019-12
2019-11
2019-10
2019-09
2019-08
2019-07
2019-06
2019-05
2019-04
2019-03
2019-02
2019-01
2018-12
2018-11
2018-10
pm25
34
35
33
40
54
63
36
24
24
20
17
21
28
34
43
49
74
45
40
35
co
572
522
727
773
1
1
705
628
571
659
543
578
498
496
685
934
1
994
745
807
no2
40
38
32
17
38
44
31
27
26
29
24
26
26
44
45
31
54
38
36
37
o3
169
128
115
86
67
65
68
96
114
176
144
169
138
155
107
78
63
42
70
74
pm10
60
53
59
57
74
93
59
39
40
38
28
36
49
62
72
70
103
79
63
56
so2
9.1
8.3
7.9
5.8
9.1
9.3
6.8
6.2
6.9
8.9
9.7
9.8
9.6
9.6
9.1
7
11
8.1
7.7
9.4
* Pollution data source:
https://openaq.org
(ChinaAQIData)
The data is licensed under CC-By 4.0
PM10 179 (Very bad Hazardous)
PM2,5 35 (Unhealthy for Sensitive Groups)
O3 0 (Good)
NO2 0 (Good)
SO2 0 (Good)
Data on air pollution from recent days in Sunqituncun
| index | 2022-05-27 |
|---|---|
| pm10 | 56 Unhealthy for Sensitive Groups |
| pm25 | 56 Unhealthy |
| o3 | 0 Good |
| no2 | 0 Good |
| so2 | 0 Good |
| index | 2020-05 | 2020-04 | 2020-03 | 2020-02 | 2020-01 | 2019-12 | 2019-11 | 2019-10 | 2019-09 | 2019-08 | 2019-07 | 2019-06 | 2019-05 | 2019-04 | 2019-03 | 2019-02 | 2019-01 | 2018-12 | 2018-11 | 2018-10 |
|---|---|---|---|---|---|---|---|---|---|---|---|---|---|---|---|---|---|---|---|---|
| pm25 | 28 (Moderate) | 38 (Unhealthy for Sensitive Groups) | 42 (Unhealthy for Sensitive Groups) | 54 (Unhealthy for Sensitive Groups) | 87 (Very Unhealthy) | 76 (Very Unhealthy) | 58 (Unhealthy) | 39 (Unhealthy for Sensitive Groups) | 29 (Moderate) | 25 (Moderate) | 23 (Moderate) | 26 (Moderate) | 32 (Moderate) | 43 (Unhealthy for Sensitive Groups) | 51 (Unhealthy for Sensitive Groups) | 90 (Very Unhealthy) | 103 (Very Unhealthy) | 64 (Unhealthy) | 67 (Unhealthy) | 46 (Unhealthy for Sensitive Groups) |
| co | 627 (Good) | 616 (Good) | 674 (Good) | 788 (Good) | 1 (Good) | 481 (Good) | 782 (Good) | 717 (Good) | 639 (Good) | 706 (Good) | 542 (Good) | 591 (Good) | 558 (Good) | 608 (Good) | 716 (Good) | 468 (Good) | 1 (Good) | 498 (Good) | 373 (Good) | 816 (Good) |
| no2 | 36 (Good) | 39 (Good) | 36 (Good) | 21 (Good) | 40 (Good) | 48 (Moderate) | 42 (Moderate) | 37 (Good) | 31 (Good) | 30 (Good) | 26 (Good) | 29 (Good) | 31 (Good) | 43 (Moderate) | 47 (Moderate) | 35 (Good) | 60 (Moderate) | 49 (Moderate) | 47 (Moderate) | 47 (Moderate) |
| o3 | 158 (Unhealthy) | 130 (Unhealthy for Sensitive Groups) | 112 (Moderate) | 94 (Moderate) | 67 (Good) | 62 (Good) | 70 (Moderate) | 99 (Moderate) | 140 (Unhealthy for Sensitive Groups) | 180 (Unhealthy) | 170 (Unhealthy) | 182 (Very Unhealthy) | 153 (Unhealthy) | 143 (Unhealthy for Sensitive Groups) | 109 (Moderate) | 81 (Moderate) | 54 (Good) | 40 (Good) | 67 (Good) | 79 (Moderate) |
| pm10 | 71 (Unhealthy for Sensitive Groups) | 76 (Unhealthy for Sensitive Groups) | 84 (Unhealthy) | 73 (Unhealthy for Sensitive Groups) | 108 (Unhealthy) | 112 (Very Unhealthy) | 99 (Unhealthy) | 75 (Unhealthy for Sensitive Groups) | 55 (Unhealthy for Sensitive Groups) | 50 (Unhealthy for Sensitive Groups) | 45 (Moderate) | 55 (Unhealthy for Sensitive Groups) | 86 (Unhealthy) | 95 (Unhealthy) | 96 (Unhealthy) | 122 (Very Unhealthy) | 145 (Very Unhealthy) | 116 (Very Unhealthy) | 114 (Very Unhealthy) | 85 (Unhealthy) |
| so2 | 9.2 (Good) | 9 (Good) | 8.8 (Good) | 7.1 (Good) | 9.9 (Good) | 11 (Good) | 9.7 (Good) | 7.9 (Good) | 8.3 (Good) | 8.4 (Good) | 7.4 (Good) | 8.3 (Good) | 10 (Good) | 11 (Good) | 12 (Good) | 9.9 (Good) | 16 (Good) | 15 (Good) | 12 (Good) | 17 (Good) |
PM10 179 (Very bad Hazardous)
particulate matter (PM10) suspended dustPM2,5 35 (Unhealthy for Sensitive Groups)
particulate matter (PM2.5) dustO3 0.04 (Good)
ozone (O3)NO2 0 (Good)
nitrogen dioxide (NO2)SO2 0 (Good)
sulfur dioxide (SO2)PM10 179 (Very bad Hazardous)
particulate matter (PM10) suspended dustPM2,5 35 (Unhealthy for Sensitive Groups)
particulate matter (PM2.5) dustO3 0.04 (Good)
ozone (O3)NO2 0 (Good)
nitrogen dioxide (NO2)SO2 0 (Good)
sulfur dioxide (SO2)中信二小
| index | 2022-05-27 |
|---|---|
| pm10 | 56 |
| pm25 | 56 |
| o3 | 0.03 |
| no2 | 0 |
| so2 | 0 |
市委党校
| index | 2022-05-27 |
|---|---|
| pm10 | 56 |
| pm25 | 56 |
| o3 | 0.03 |
| no2 | 0 |
| so2 | 0 |
中信二小

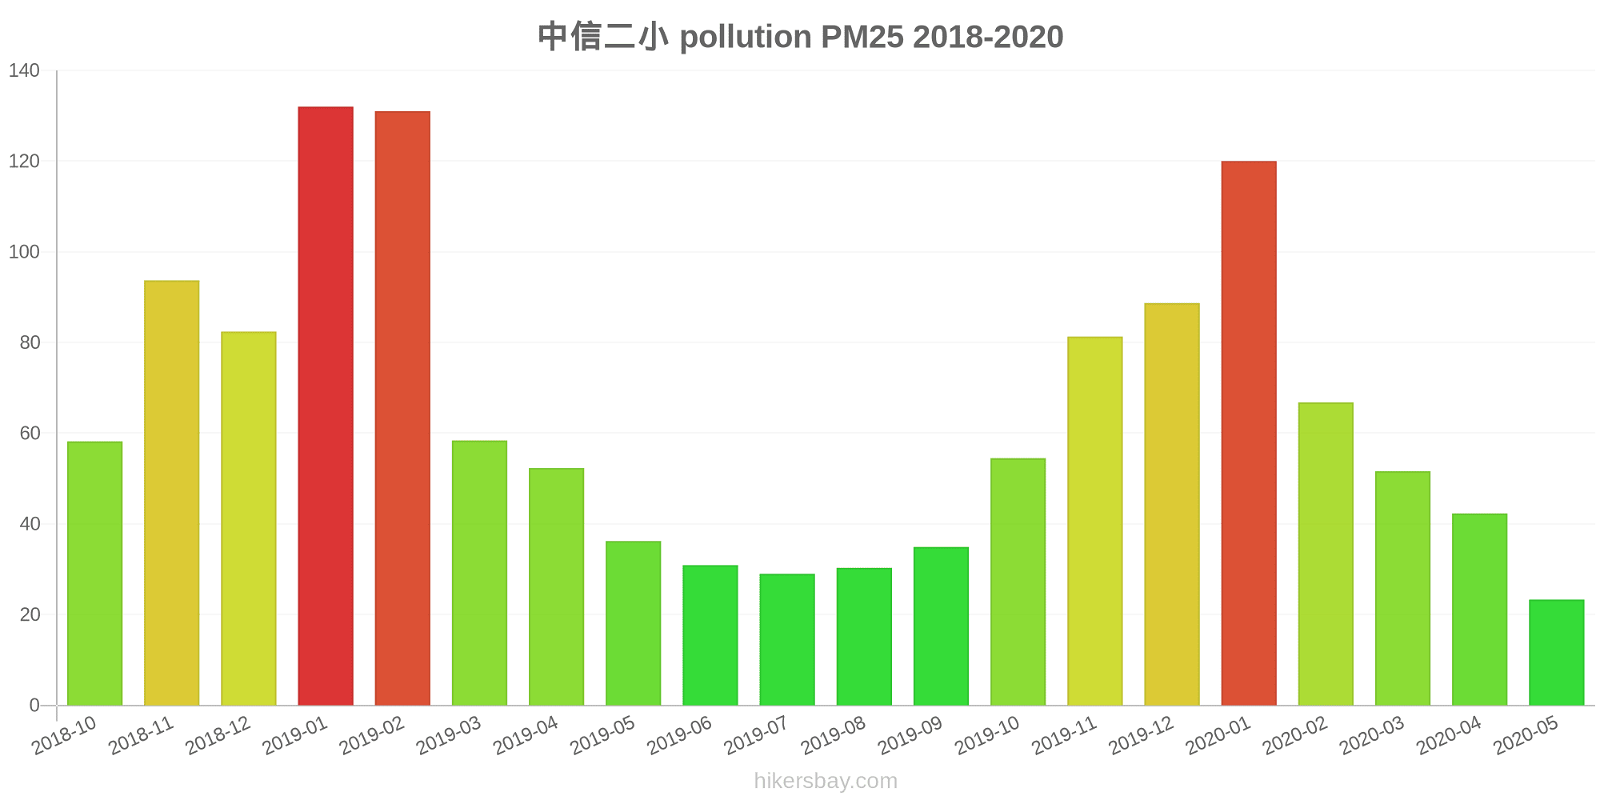
| index | 2020-05 | 2020-04 | 2020-03 | 2020-02 | 2020-01 | 2019-12 | 2019-11 | 2019-10 | 2019-09 | 2019-08 | 2019-07 | 2019-06 | 2019-05 | 2019-04 | 2019-03 | 2019-02 | 2019-01 | 2018-12 | 2018-11 | 2018-10 |
|---|---|---|---|---|---|---|---|---|---|---|---|---|---|---|---|---|---|---|---|---|
| pm25 | 23 | 42 | 52 | 67 | 120 | 89 | 81 | 55 | 35 | 30 | 29 | 31 | 36 | 52 | 58 | 131 | 132 | 82 | 94 | 58 |
| co | 682 | 710 | 621 | 803 | 1 | 961 | 859 | 806 | 706 | 752 | 540 | 604 | 618 | 719 | 746 | 1 | 1 | 1 | 1 | 824 |
| no2 | 32 | 40 | 39 | 25 | 42 | 51 | 52 | 46 | 37 | 32 | 29 | 31 | 37 | 41 | 49 | 40 | 67 | 60 | 58 | 58 |
| o3 | 147 | 131 | 108 | 102 | 67 | 60 | 72 | 101 | 165 | 183 | 196 | 194 | 167 | 131 | 110 | 85 | 46 | 38 | 65 | 84 |
| pm10 | 82 | 100 | 109 | 90 | 141 | 131 | 138 | 110 | 71 | 62 | 62 | 75 | 123 | 127 | 119 | 175 | 186 | 154 | 165 | 114 |
| so2 | 9.3 | 9.6 | 9.7 | 8.5 | 11 | 12 | 13 | 9.5 | 9.8 | 7.9 | 5.1 | 6.7 | 11 | 12 | 14 | 13 | 20 | 23 | 17 | 25 |
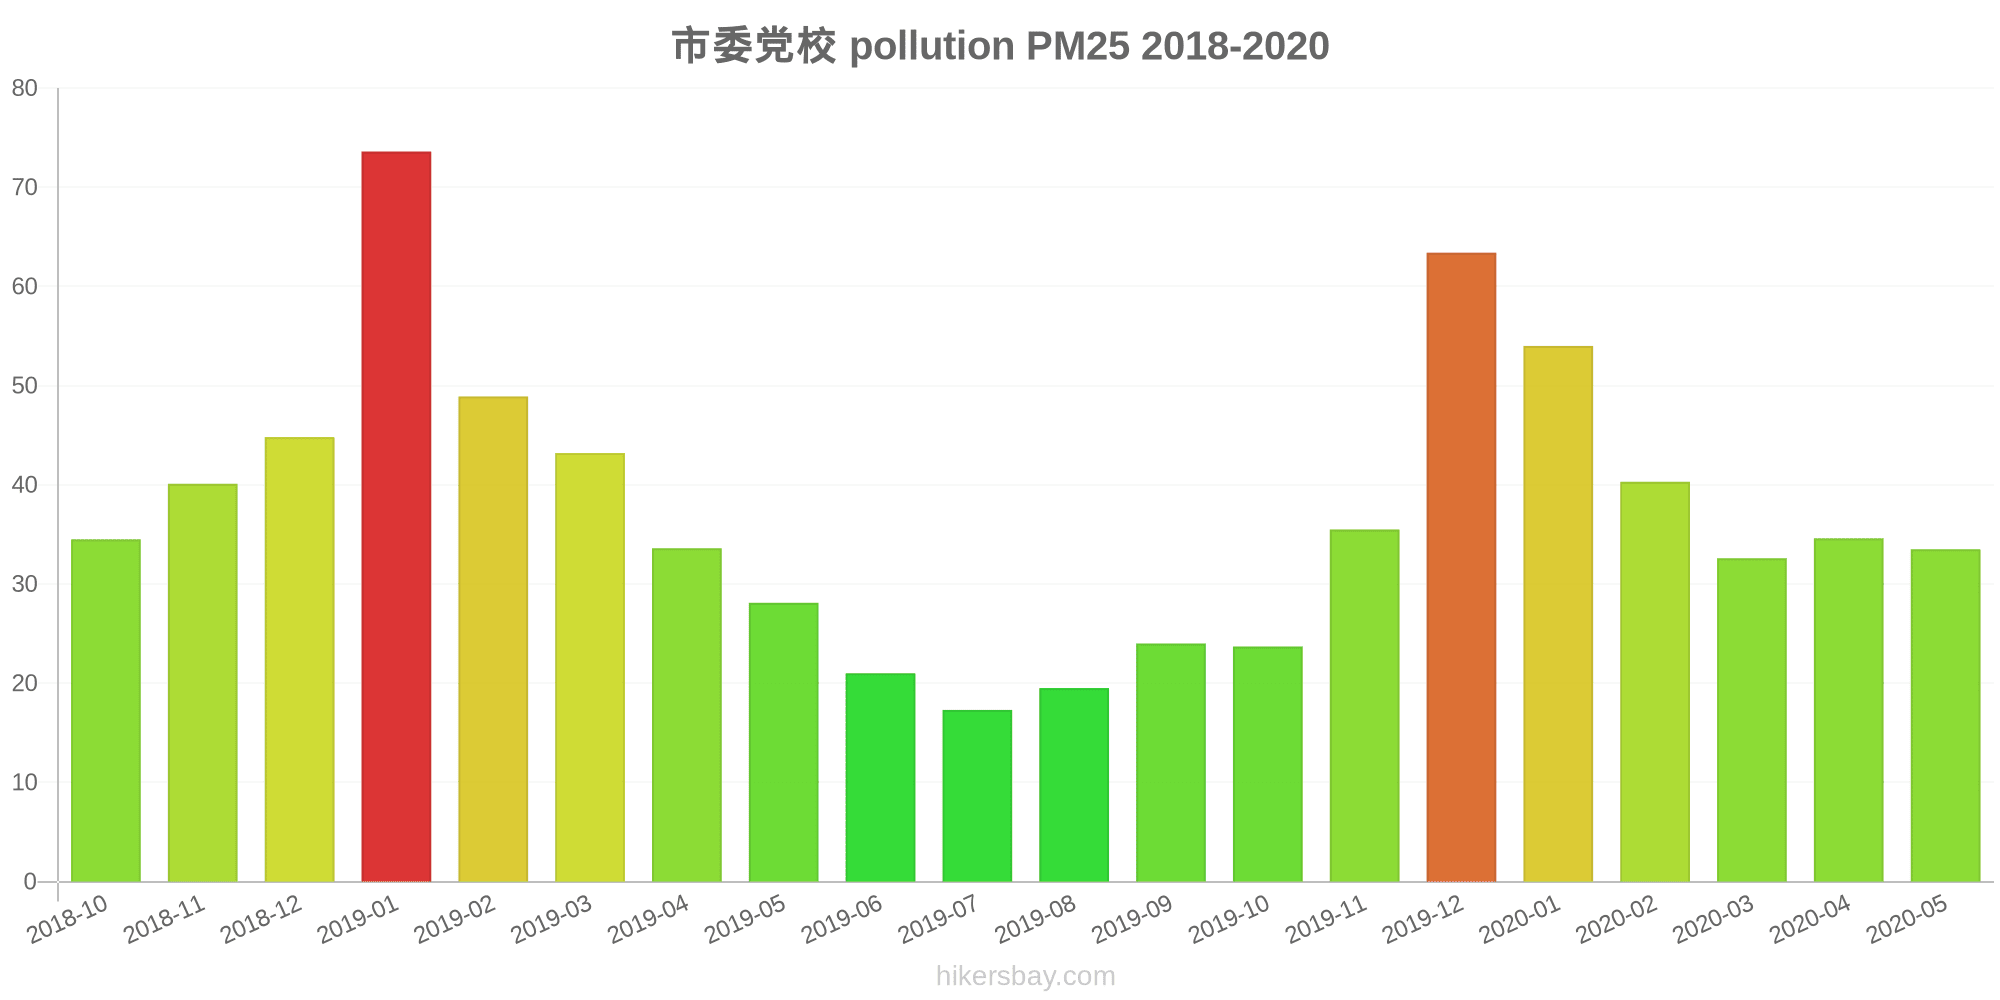
市委党校
| index | 2020-05 | 2020-04 | 2020-03 | 2020-02 | 2020-01 | 2019-12 | 2019-11 | 2019-10 | 2019-09 | 2019-08 | 2019-07 | 2019-06 | 2019-05 | 2019-04 | 2019-03 | 2019-02 | 2019-01 | 2018-12 | 2018-11 | 2018-10 |
|---|---|---|---|---|---|---|---|---|---|---|---|---|---|---|---|---|---|---|---|---|
| pm25 | 34 | 35 | 33 | 40 | 54 | 63 | 36 | 24 | 24 | 20 | 17 | 21 | 28 | 34 | 43 | 49 | 74 | 45 | 40 | 35 |
| co | 572 | 522 | 727 | 773 | 1 | 1 | 705 | 628 | 571 | 659 | 543 | 578 | 498 | 496 | 685 | 934 | 1 | 994 | 745 | 807 |
| no2 | 40 | 38 | 32 | 17 | 38 | 44 | 31 | 27 | 26 | 29 | 24 | 26 | 26 | 44 | 45 | 31 | 54 | 38 | 36 | 37 |
| o3 | 169 | 128 | 115 | 86 | 67 | 65 | 68 | 96 | 114 | 176 | 144 | 169 | 138 | 155 | 107 | 78 | 63 | 42 | 70 | 74 |
| pm10 | 60 | 53 | 59 | 57 | 74 | 93 | 59 | 39 | 40 | 38 | 28 | 36 | 49 | 62 | 72 | 70 | 103 | 79 | 63 | 56 |
| so2 | 9.1 | 8.3 | 7.9 | 5.8 | 9.1 | 9.3 | 6.8 | 6.2 | 6.9 | 8.9 | 9.7 | 9.8 | 9.6 | 9.6 | 9.1 | 7 | 11 | 8.1 | 7.7 | 9.4 |