Air Pollution in Yechamo: Real-time Air Quality Index and smog alert.
Pollution and air quality forecast for Yechamo. Today is Tuesday, June 2, 2026. The following air pollution values have been recorded for Yechamo:- particulate matter (PM10) suspended dust - 179 (Very bad Hazardous)
- particulate matter (PM2.5) dust - 35 (Unhealthy for Sensitive Groups)
- ozone (O3) - 0 (Good)
- nitrogen dioxide (NO2) - 0 (Good)
- sulfur dioxide (SO2) - 0 (Good)

What is the air quality in Yechamo today? Is the air polluted in Yechamo?. Is there smog?
What is the level of PM10 today in Yechamo? (particulate matter (PM10) suspended dust)
The current level of particulate matter PM10 in Yechamo is:
179 (Very bad Hazardous)
The highest PM10 values usually occur in month: 166 (January 2019).
The lowest value of particulate matter PM10 pollution in Yechamo is usually recorded in: July (50).
What is the current level of PM2.5 in Yechamo? (particulate matter (PM2.5) dust)
Today's PM2.5 level is:
35 (Unhealthy for Sensitive Groups)
For comparison, the highest level of PM2.5 in Yechamo in the last 7 days was: 56 (Friday, May 27, 2022) and the lowest: 56 (Friday, May 27, 2022).
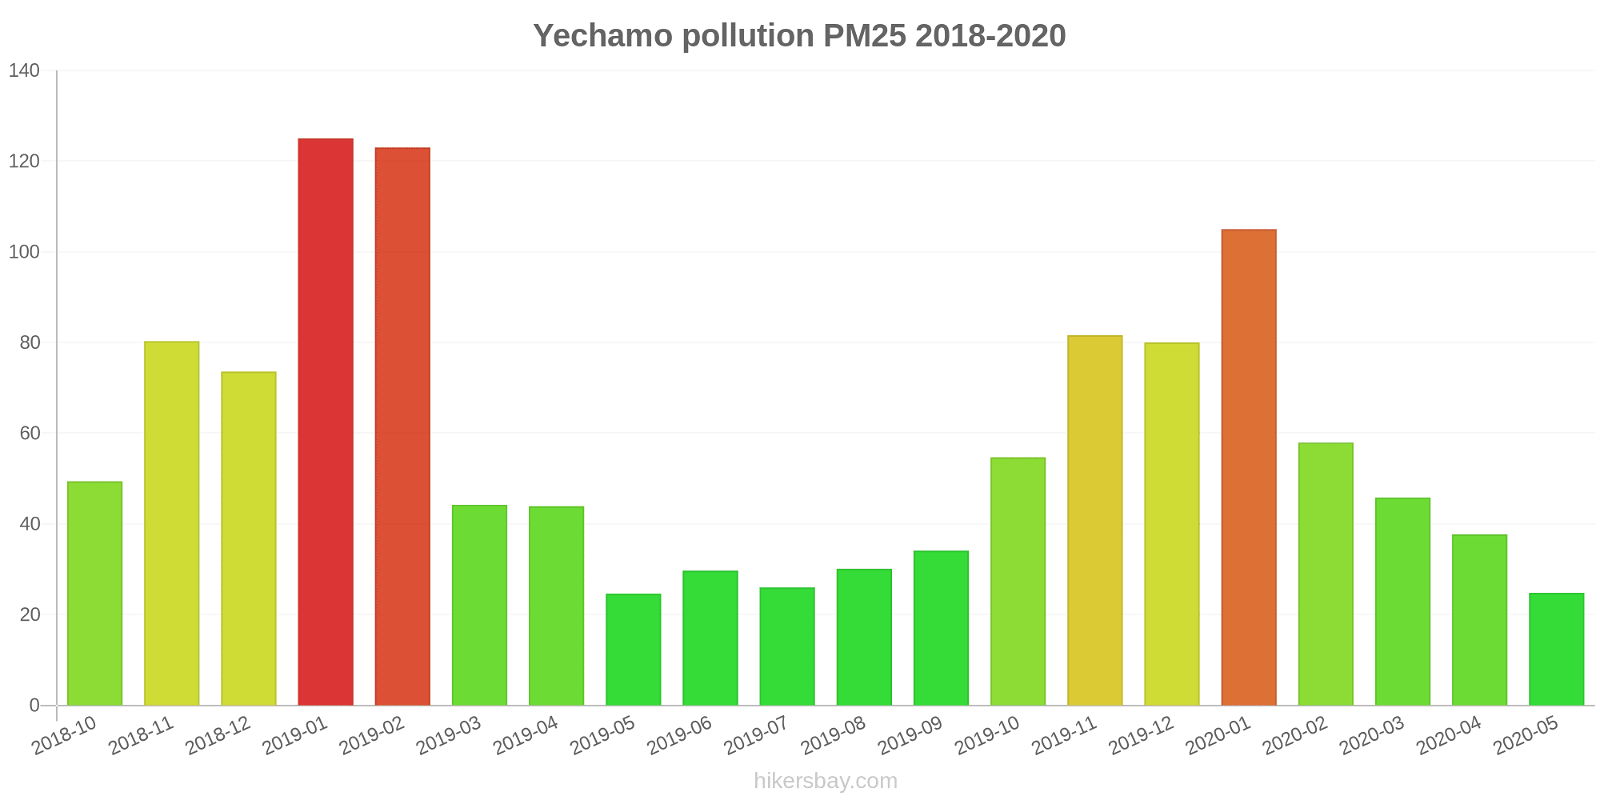
The highest PM2.5 values were recorded: 125 (January 2019).
The lowest level of particulate matter PM2.5 pollution occurs in month: May (25).
How is the O3 level today in Yechamo? (ozone (O3))
0 (Good)
How high is the level of NO2? (nitrogen dioxide (NO2))
0 (Good)
What is the level of SO2 pollution? (sulfur dioxide (SO2))
0 (Good)
Current data Friday, May 27, 2022, 12:00 PM
PM10 179 (Very bad Hazardous)
PM2,5 35 (Unhealthy for Sensitive Groups)
O3 0 (Good)
NO2 0 (Good)
SO2 0 (Good)
Data on air pollution from recent days in Yechamo
index
2022-05-27
pm10
56
Unhealthy for Sensitive Groups
pm25
56
Unhealthy
o3
0
Good
no2
0
Good
so2
0
Good
data source »
Air pollution in Yechamo from October 2018 to May 2020
index
2020-05
2020-04
2020-03
2020-02
2020-01
2019-12
2019-11
2019-10
2019-09
2019-08
2019-07
2019-06
2019-05
2019-04
2019-03
2019-02
2019-01
2018-12
2018-11
2018-10
pm25
25 (Moderate)
38 (Unhealthy for Sensitive Groups)
46 (Unhealthy for Sensitive Groups)
58 (Unhealthy)
105 (Very Unhealthy)
80 (Very Unhealthy)
82 (Very Unhealthy)
55 (Unhealthy for Sensitive Groups)
34 (Moderate)
30 (Moderate)
26 (Moderate)
30 (Moderate)
25 (Moderate)
44 (Unhealthy for Sensitive Groups)
44 (Unhealthy for Sensitive Groups)
123 (Very bad Hazardous)
125 (Very bad Hazardous)
74 (Unhealthy)
80 (Very Unhealthy)
49 (Unhealthy for Sensitive Groups)
co
439 (Good)
543 (Good)
500 (Good)
606 (Good)
1 (Good)
832 (Good)
668 (Good)
647 (Good)
575 (Good)
549 (Good)
477 (Good)
479 (Good)
631 (Good)
694 (Good)
539 (Good)
1 (Good)
1 (Good)
1 (Good)
1 (Good)
733 (Good)
no2
26 (Good)
37 (Good)
34 (Good)
22 (Good)
44 (Moderate)
44 (Moderate)
51 (Moderate)
39 (Good)
30 (Good)
25 (Good)
24 (Good)
23 (Good)
22 (Good)
34 (Good)
40 (Good)
38 (Good)
64 (Moderate)
56 (Moderate)
52 (Moderate)
49 (Moderate)
o3
144 (Unhealthy for Sensitive Groups)
121 (Unhealthy for Sensitive Groups)
103 (Moderate)
97 (Moderate)
66 (Good)
58 (Good)
73 (Moderate)
98 (Moderate)
156 (Unhealthy)
174 (Unhealthy)
182 (Very Unhealthy)
170 (Unhealthy)
158 (Unhealthy)
129 (Unhealthy for Sensitive Groups)
110 (Moderate)
83 (Moderate)
48 (Good)
42 (Good)
65 (Good)
92 (Moderate)
pm10
54 (Unhealthy for Sensitive Groups)
80 (Unhealthy for Sensitive Groups)
91 (Unhealthy)
83 (Unhealthy)
134 (Very Unhealthy)
123 (Very Unhealthy)
146 (Very Unhealthy)
105 (Unhealthy)
64 (Unhealthy for Sensitive Groups)
52 (Unhealthy for Sensitive Groups)
50 (Unhealthy for Sensitive Groups)
59 (Unhealthy for Sensitive Groups)
90 (Unhealthy)
103 (Unhealthy)
95 (Unhealthy)
156 (Very bad Hazardous)
166 (Very bad Hazardous)
133 (Very Unhealthy)
137 (Very Unhealthy)
95 (Unhealthy)
so2
9.7 (Good)
12 (Good)
9.7 (Good)
4.3 (Good)
6 (Good)
12 (Good)
11 (Good)
8 (Good)
8.8 (Good)
8.9 (Good)
6.8 (Good)
6.6 (Good)
8.7 (Good)
8.8 (Good)
9.1 (Good)
12 (Good)
17 (Good)
21 (Good)
14 (Good)
18 (Good)
data source »
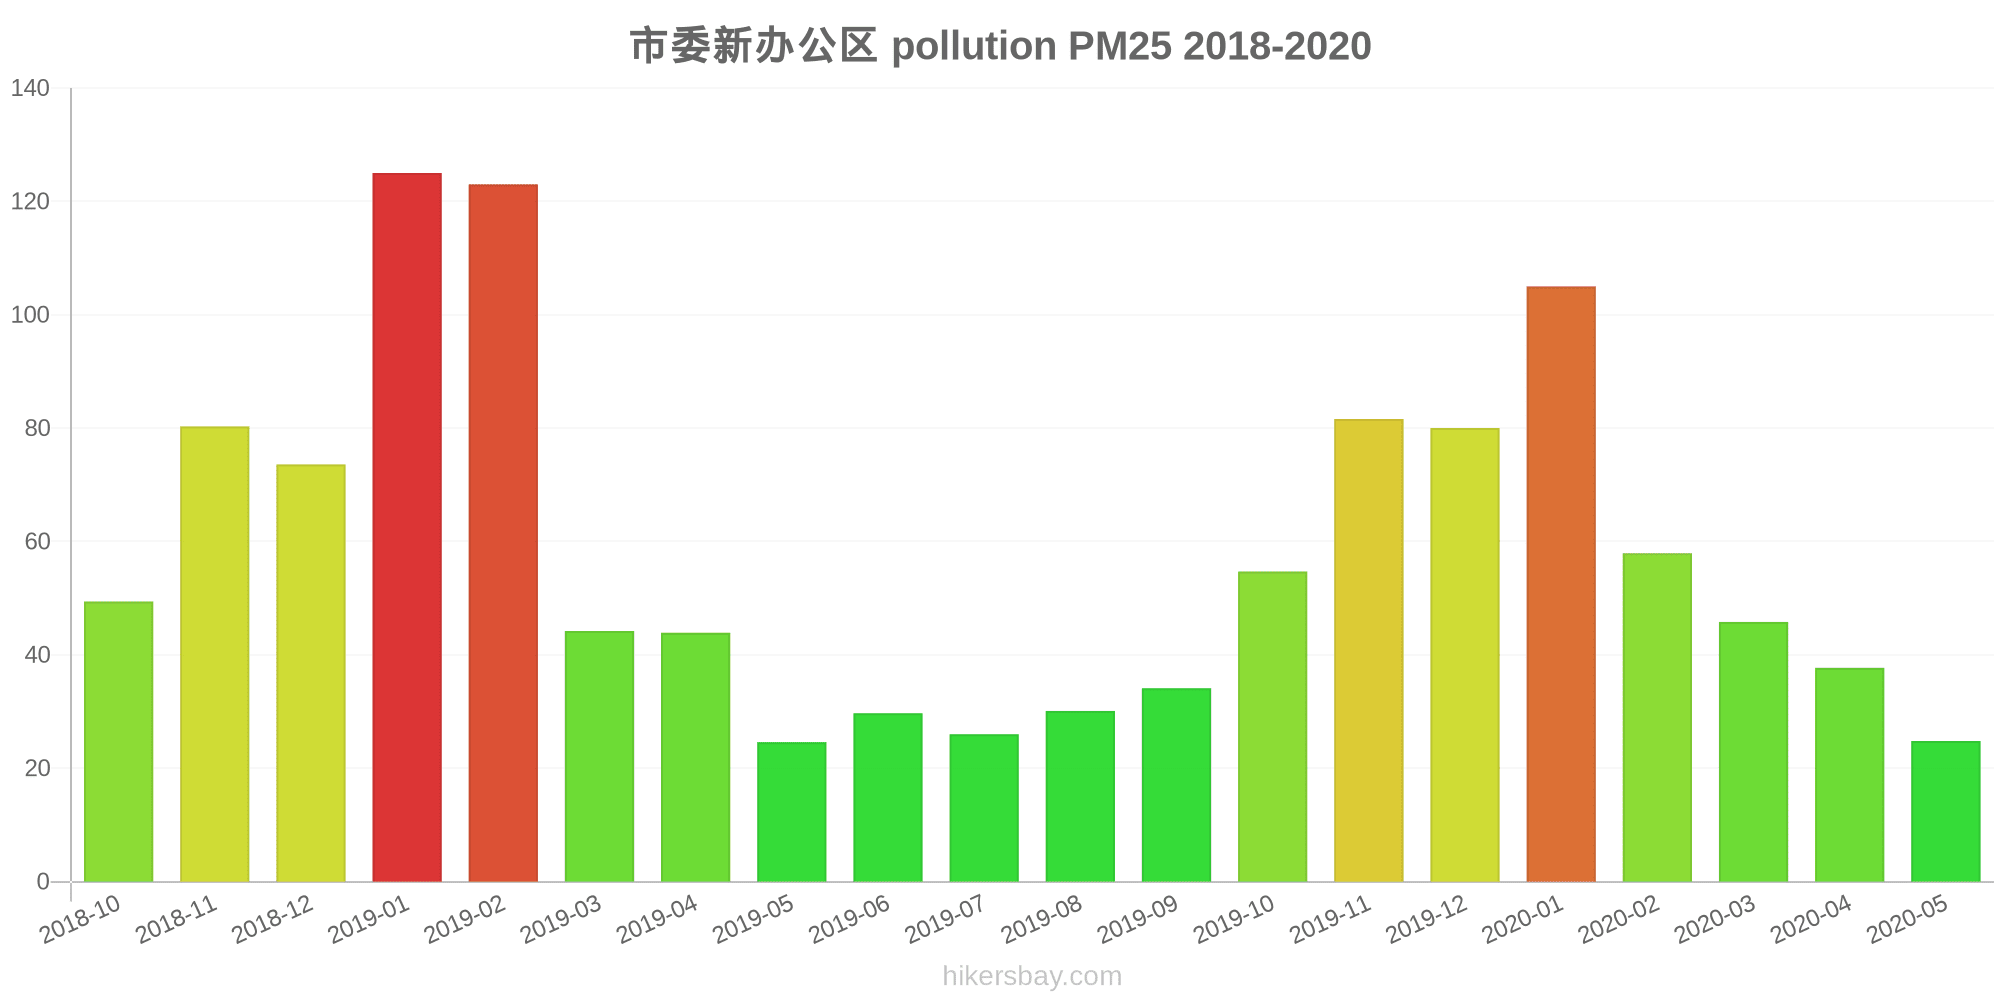
市委新办公区
Friday, May 27, 2022, 12:00 PM
PM10 179 (Very bad Hazardous)
particulate matter (PM10) suspended dust
PM2,5 35 (Unhealthy for Sensitive Groups)
particulate matter (PM2.5) dust
O3 0.04 (Good)
ozone (O3)
NO2 0 (Good)
nitrogen dioxide (NO2)
SO2 0 (Good)
sulfur dioxide (SO2)
市委新办公区
index
2022-05-27
pm10
56
pm25
56
o3
0.03
no2
0
so2
0
市委新办公区
2018-10 2020-05

index
2020-05
2020-04
2020-03
2020-02
2020-01
2019-12
2019-11
2019-10
2019-09
2019-08
2019-07
2019-06
2019-05
2019-04
2019-03
2019-02
2019-01
2018-12
2018-11
2018-10
pm25
25
38
46
58
105
80
82
55
34
30
26
30
25
44
44
123
125
74
80
49
co
439
543
500
606
1
832
668
647
575
549
477
479
631
694
539
1
1
1
1
733
no2
26
37
34
22
44
44
51
39
30
25
24
23
22
34
40
38
64
56
52
49
o3
144
121
103
97
66
58
73
98
156
174
182
170
158
129
110
83
48
42
65
92
pm10
54
80
91
83
134
123
146
105
64
52
50
59
90
103
95
156
166
133
137
95
so2
9.7
12
9.7
4.3
6
12
11
8
8.8
8.9
6.8
6.6
8.7
8.8
9.1
12
17
21
14
18
* Pollution data source:
https://openaq.org
(ChinaAQIData)
The data is licensed under CC-By 4.0
PM10 179 (Very bad Hazardous)
PM2,5 35 (Unhealthy for Sensitive Groups)
O3 0 (Good)
NO2 0 (Good)
SO2 0 (Good)
Data on air pollution from recent days in Yechamo
| index | 2022-05-27 |
|---|---|
| pm10 | 56 Unhealthy for Sensitive Groups |
| pm25 | 56 Unhealthy |
| o3 | 0 Good |
| no2 | 0 Good |
| so2 | 0 Good |

| index | 2020-05 | 2020-04 | 2020-03 | 2020-02 | 2020-01 | 2019-12 | 2019-11 | 2019-10 | 2019-09 | 2019-08 | 2019-07 | 2019-06 | 2019-05 | 2019-04 | 2019-03 | 2019-02 | 2019-01 | 2018-12 | 2018-11 | 2018-10 |
|---|---|---|---|---|---|---|---|---|---|---|---|---|---|---|---|---|---|---|---|---|
| pm25 | 25 (Moderate) | 38 (Unhealthy for Sensitive Groups) | 46 (Unhealthy for Sensitive Groups) | 58 (Unhealthy) | 105 (Very Unhealthy) | 80 (Very Unhealthy) | 82 (Very Unhealthy) | 55 (Unhealthy for Sensitive Groups) | 34 (Moderate) | 30 (Moderate) | 26 (Moderate) | 30 (Moderate) | 25 (Moderate) | 44 (Unhealthy for Sensitive Groups) | 44 (Unhealthy for Sensitive Groups) | 123 (Very bad Hazardous) | 125 (Very bad Hazardous) | 74 (Unhealthy) | 80 (Very Unhealthy) | 49 (Unhealthy for Sensitive Groups) |
| co | 439 (Good) | 543 (Good) | 500 (Good) | 606 (Good) | 1 (Good) | 832 (Good) | 668 (Good) | 647 (Good) | 575 (Good) | 549 (Good) | 477 (Good) | 479 (Good) | 631 (Good) | 694 (Good) | 539 (Good) | 1 (Good) | 1 (Good) | 1 (Good) | 1 (Good) | 733 (Good) |
| no2 | 26 (Good) | 37 (Good) | 34 (Good) | 22 (Good) | 44 (Moderate) | 44 (Moderate) | 51 (Moderate) | 39 (Good) | 30 (Good) | 25 (Good) | 24 (Good) | 23 (Good) | 22 (Good) | 34 (Good) | 40 (Good) | 38 (Good) | 64 (Moderate) | 56 (Moderate) | 52 (Moderate) | 49 (Moderate) |
| o3 | 144 (Unhealthy for Sensitive Groups) | 121 (Unhealthy for Sensitive Groups) | 103 (Moderate) | 97 (Moderate) | 66 (Good) | 58 (Good) | 73 (Moderate) | 98 (Moderate) | 156 (Unhealthy) | 174 (Unhealthy) | 182 (Very Unhealthy) | 170 (Unhealthy) | 158 (Unhealthy) | 129 (Unhealthy for Sensitive Groups) | 110 (Moderate) | 83 (Moderate) | 48 (Good) | 42 (Good) | 65 (Good) | 92 (Moderate) |
| pm10 | 54 (Unhealthy for Sensitive Groups) | 80 (Unhealthy for Sensitive Groups) | 91 (Unhealthy) | 83 (Unhealthy) | 134 (Very Unhealthy) | 123 (Very Unhealthy) | 146 (Very Unhealthy) | 105 (Unhealthy) | 64 (Unhealthy for Sensitive Groups) | 52 (Unhealthy for Sensitive Groups) | 50 (Unhealthy for Sensitive Groups) | 59 (Unhealthy for Sensitive Groups) | 90 (Unhealthy) | 103 (Unhealthy) | 95 (Unhealthy) | 156 (Very bad Hazardous) | 166 (Very bad Hazardous) | 133 (Very Unhealthy) | 137 (Very Unhealthy) | 95 (Unhealthy) |
| so2 | 9.7 (Good) | 12 (Good) | 9.7 (Good) | 4.3 (Good) | 6 (Good) | 12 (Good) | 11 (Good) | 8 (Good) | 8.8 (Good) | 8.9 (Good) | 6.8 (Good) | 6.6 (Good) | 8.7 (Good) | 8.8 (Good) | 9.1 (Good) | 12 (Good) | 17 (Good) | 21 (Good) | 14 (Good) | 18 (Good) |
PM10 179 (Very bad Hazardous)
particulate matter (PM10) suspended dustPM2,5 35 (Unhealthy for Sensitive Groups)
particulate matter (PM2.5) dustO3 0.04 (Good)
ozone (O3)NO2 0 (Good)
nitrogen dioxide (NO2)SO2 0 (Good)
sulfur dioxide (SO2)市委新办公区
| index | 2022-05-27 |
|---|---|
| pm10 | 56 |
| pm25 | 56 |
| o3 | 0.03 |
| no2 | 0 |
| so2 | 0 |
市委新办公区
| index | 2020-05 | 2020-04 | 2020-03 | 2020-02 | 2020-01 | 2019-12 | 2019-11 | 2019-10 | 2019-09 | 2019-08 | 2019-07 | 2019-06 | 2019-05 | 2019-04 | 2019-03 | 2019-02 | 2019-01 | 2018-12 | 2018-11 | 2018-10 |
|---|---|---|---|---|---|---|---|---|---|---|---|---|---|---|---|---|---|---|---|---|
| pm25 | 25 | 38 | 46 | 58 | 105 | 80 | 82 | 55 | 34 | 30 | 26 | 30 | 25 | 44 | 44 | 123 | 125 | 74 | 80 | 49 |
| co | 439 | 543 | 500 | 606 | 1 | 832 | 668 | 647 | 575 | 549 | 477 | 479 | 631 | 694 | 539 | 1 | 1 | 1 | 1 | 733 |
| no2 | 26 | 37 | 34 | 22 | 44 | 44 | 51 | 39 | 30 | 25 | 24 | 23 | 22 | 34 | 40 | 38 | 64 | 56 | 52 | 49 |
| o3 | 144 | 121 | 103 | 97 | 66 | 58 | 73 | 98 | 156 | 174 | 182 | 170 | 158 | 129 | 110 | 83 | 48 | 42 | 65 | 92 |
| pm10 | 54 | 80 | 91 | 83 | 134 | 123 | 146 | 105 | 64 | 52 | 50 | 59 | 90 | 103 | 95 | 156 | 166 | 133 | 137 | 95 |
| so2 | 9.7 | 12 | 9.7 | 4.3 | 6 | 12 | 11 | 8 | 8.8 | 8.9 | 6.8 | 6.6 | 8.7 | 8.8 | 9.1 | 12 | 17 | 21 | 14 | 18 |