Air Pollution in Dingloucun: Real-time Air Quality Index and smog alert.
Pollution and air quality forecast for Dingloucun. Today is Tuesday, June 16, 2026. The following air pollution values have been recorded for Dingloucun:- particulate matter (PM10) suspended dust - 7 (Good)
- particulate matter (PM2.5) dust - 2 (Good)
- carbon monoxide (CO) - 100 (Good)
- nitrogen dioxide (NO2) - 8 (Good)
- ozone (O3) - 0 (Good)
- sulfur dioxide (SO2) - 9 (Good)

What is the air quality in Dingloucun today? Is the air polluted in Dingloucun?. Is there smog?
What is the level of PM10 today in Dingloucun? (particulate matter (PM10) suspended dust)
The current level of particulate matter PM10 in Dingloucun is:
7 (Good)
The highest PM10 values usually occur in month: 149 (January 2019).
The lowest value of particulate matter PM10 pollution in Dingloucun is usually recorded in: August (40).
What is the current level of PM2.5 in Dingloucun? (particulate matter (PM2.5) dust)
Today's PM2.5 level is:
2 (Good)
For comparison, the highest level of PM2.5 in Dingloucun in the last 7 days was: 24 (Friday, May 27, 2022) and the lowest: 24 (Friday, May 27, 2022).
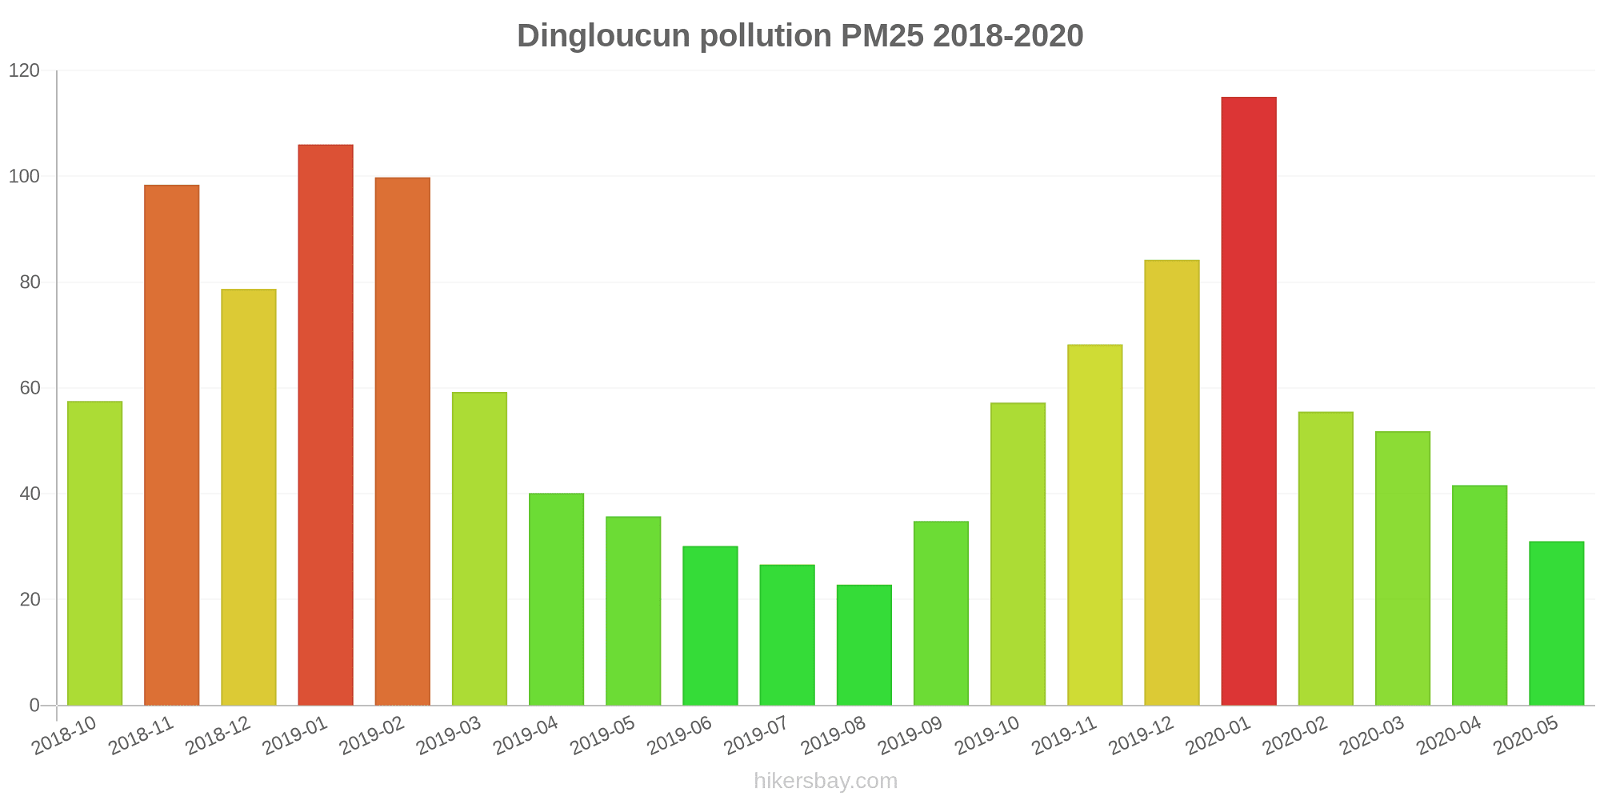
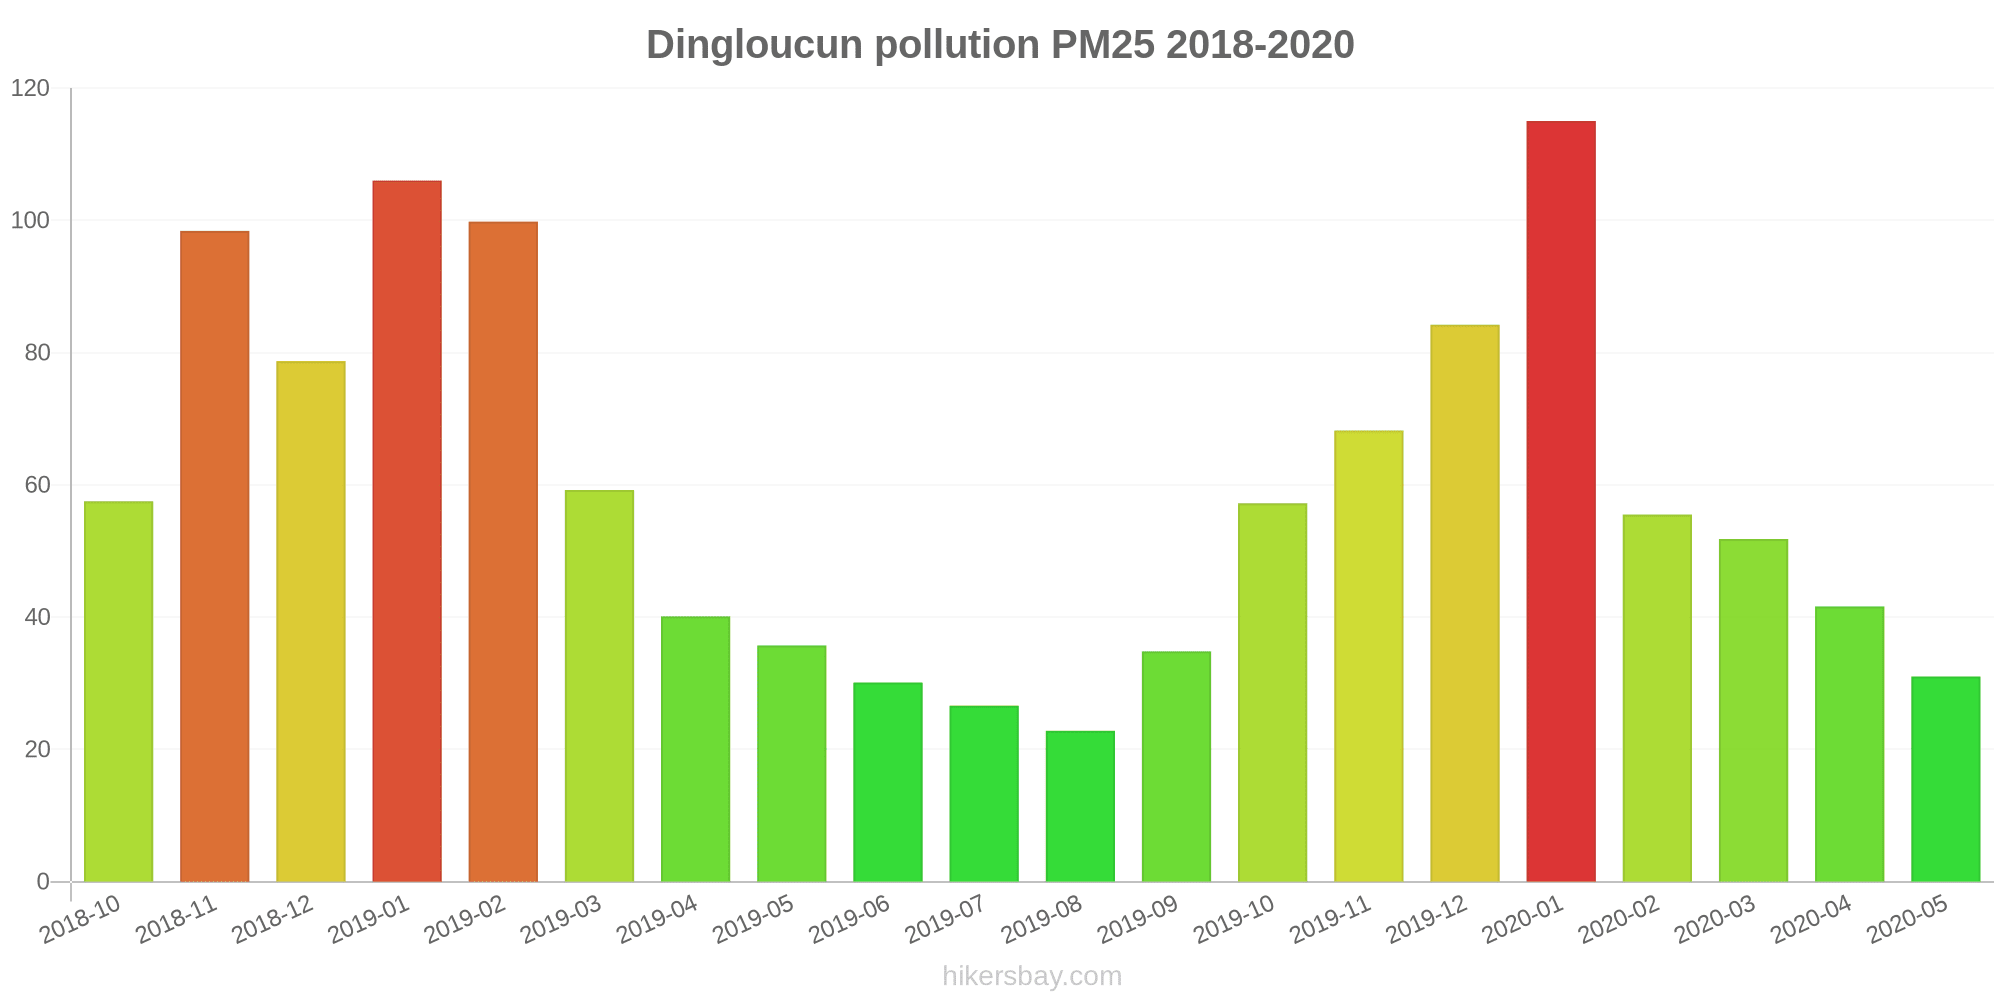
The highest PM2.5 values were recorded: 115 (January 2020).
The lowest level of particulate matter PM2.5 pollution occurs in month: August (23).
How high is the CO level? (carbon monoxide (CO))
100 (Good)
How high is the level of NO2? (nitrogen dioxide (NO2))
8 (Good)
How is the O3 level today in Dingloucun? (ozone (O3))
0 (Good)
What is the level of SO2 pollution? (sulfur dioxide (SO2))
9 (Good)
Current data Friday, May 27, 2022, 12:00 PM
PM10 7 (Good)
PM2,5 2 (Good)
CO 100 (Good)
NO2 8 (Good)
O3 0 (Good)
SO2 9 (Good)
Data on air pollution from recent days in Dingloucun
index
2022-05-27
pm10
32
Moderate
pm25
24
Moderate
co
468
Good
no2
21
Good
o3
32
Good
so2
5
Good
data source »
Air pollution in Dingloucun from October 2018 to May 2020
index
2020-05
2020-04
2020-03
2020-02
2020-01
2019-12
2019-11
2019-10
2019-09
2019-08
2019-07
2019-06
2019-05
2019-04
2019-03
2019-02
2019-01
2018-12
2018-11
2018-10
pm25
31 (Moderate)
42 (Unhealthy for Sensitive Groups)
52 (Unhealthy for Sensitive Groups)
56 (Unhealthy)
115 (Very bad Hazardous)
84 (Very Unhealthy)
68 (Unhealthy)
57 (Unhealthy)
35 (Moderate)
23 (Moderate)
27 (Moderate)
30 (Moderate)
36 (Unhealthy for Sensitive Groups)
40 (Unhealthy for Sensitive Groups)
59 (Unhealthy)
100 (Very Unhealthy)
106 (Very Unhealthy)
79 (Very Unhealthy)
98 (Very Unhealthy)
58 (Unhealthy)
co
569 (Good)
594 (Good)
692 (Good)
720 (Good)
1 (Good)
989 (Good)
851 (Good)
922 (Good)
868 (Good)
719 (Good)
737 (Good)
670 (Good)
486 (Good)
536 (Good)
560 (Good)
1 (Good)
1 (Good)
873 (Good)
958 (Good)
708 (Good)
no2
19 (Good)
27 (Good)
28 (Good)
15 (Good)
34 (Good)
50 (Moderate)
43 (Moderate)
39 (Good)
19 (Good)
12 (Good)
15 (Good)
12 (Good)
20 (Good)
22 (Good)
31 (Good)
34 (Good)
50 (Moderate)
49 (Moderate)
40 (Good)
46 (Moderate)
o3
137 (Unhealthy for Sensitive Groups)
148 (Unhealthy for Sensitive Groups)
106 (Moderate)
93 (Moderate)
75 (Moderate)
67 (Good)
102 (Moderate)
127 (Unhealthy for Sensitive Groups)
168 (Unhealthy)
150 (Unhealthy)
173 (Unhealthy)
194 (Very Unhealthy)
153 (Unhealthy)
127 (Unhealthy for Sensitive Groups)
113 (Moderate)
89 (Moderate)
62 (Good)
50 (Good)
90 (Moderate)
116 (Moderate)
pm10
70 (Unhealthy for Sensitive Groups)
84 (Unhealthy)
89 (Unhealthy)
74 (Unhealthy for Sensitive Groups)
142 (Very Unhealthy)
119 (Very Unhealthy)
126 (Very Unhealthy)
116 (Very Unhealthy)
64 (Unhealthy for Sensitive Groups)
40 (Moderate)
45 (Moderate)
62 (Unhealthy for Sensitive Groups)
85 (Unhealthy)
81 (Unhealthy)
106 (Unhealthy)
130 (Very Unhealthy)
149 (Very Unhealthy)
121 (Very Unhealthy)
139 (Very Unhealthy)
93 (Unhealthy)
so2
7.2 (Good)
8 (Good)
7.5 (Good)
5.8 (Good)
8.3 (Good)
10 (Good)
12 (Good)
11 (Good)
8.7 (Good)
6.7 (Good)
6.5 (Good)
7.6 (Good)
10 (Good)
9.4 (Good)
14 (Good)
13 (Good)
16 (Good)
13 (Good)
11 (Good)
12 (Good)
data source »
Huaibei Zhi Ye Ji Zhu Xue Yuan
Friday, May 27, 2022, 12:00 PM
PM10 6.7 (Good)
particulate matter (PM10) suspended dust
PM2,5 1.7 (Good)
particulate matter (PM2.5) dust
CO 100 (Good)
carbon monoxide (CO)
NO2 7.6 (Good)
nitrogen dioxide (NO2)
O3 0.02 (Good)
ozone (O3)
SO2 8.6 (Good)
sulfur dioxide (SO2)
Huaibei Zhi Ye Ji Zhu Xue Yuan
index
2022-05-27
pm10
32
pm25
24
co
468
no2
21
o3
32
so2
4.6
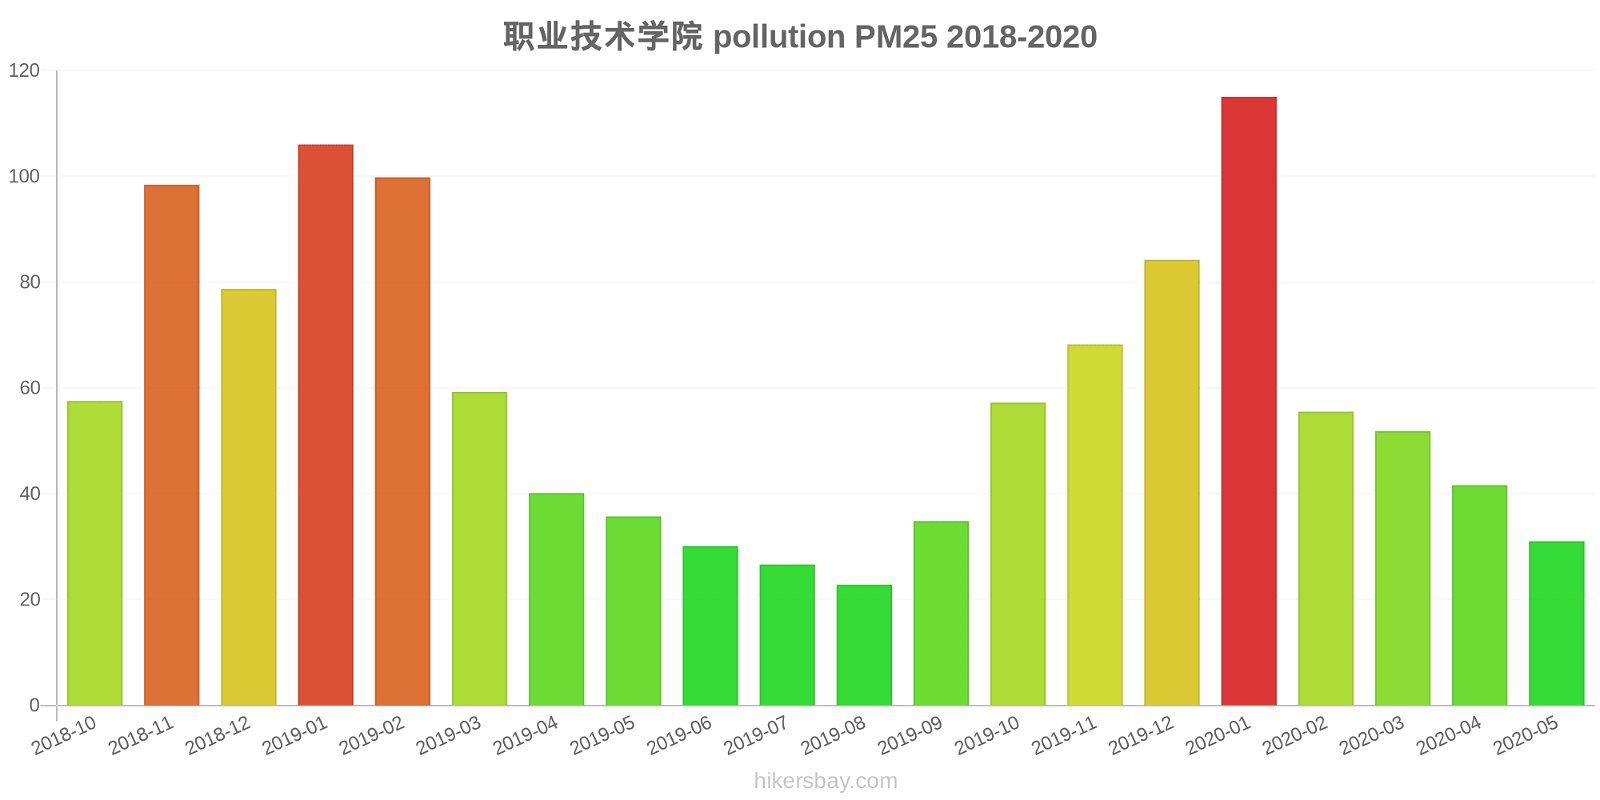
职业技术学院
2018-10 2020-05
index
2020-05
2020-04
2020-03
2020-02
2020-01
2019-12
2019-11
2019-10
2019-09
2019-08
2019-07
2019-06
2019-05
2019-04
2019-03
2019-02
2019-01
2018-12
2018-11
2018-10
pm25
31
42
52
56
115
84
68
57
35
23
27
30
36
40
59
100
106
79
98
58
co
569
594
692
720
1
989
851
922
868
719
737
670
486
536
560
1
1
873
958
708
no2
19
27
28
15
34
50
43
39
19
12
15
12
20
22
31
34
50
49
40
46
o3
137
148
106
93
75
67
102
127
168
150
173
194
153
127
113
89
62
50
90
116
pm10
70
84
89
74
142
119
126
116
64
40
45
62
85
81
106
130
149
121
139
93
so2
7.2
8
7.5
5.8
8.3
10
12
11
8.7
6.7
6.5
7.6
10
9.4
14
13
16
13
11
12
* Pollution data source:
https://openaq.org
(ChinaAQIData)
The data is licensed under CC-By 4.0
PM10 7 (Good)
PM2,5 2 (Good)
CO 100 (Good)
NO2 8 (Good)
O3 0 (Good)
SO2 9 (Good)
Data on air pollution from recent days in Dingloucun
| index | 2022-05-27 |
|---|---|
| pm10 | 32 Moderate |
| pm25 | 24 Moderate |
| co | 468 Good |
| no2 | 21 Good |
| o3 | 32 Good |
| so2 | 5 Good |
| index | 2020-05 | 2020-04 | 2020-03 | 2020-02 | 2020-01 | 2019-12 | 2019-11 | 2019-10 | 2019-09 | 2019-08 | 2019-07 | 2019-06 | 2019-05 | 2019-04 | 2019-03 | 2019-02 | 2019-01 | 2018-12 | 2018-11 | 2018-10 |
|---|---|---|---|---|---|---|---|---|---|---|---|---|---|---|---|---|---|---|---|---|
| pm25 | 31 (Moderate) | 42 (Unhealthy for Sensitive Groups) | 52 (Unhealthy for Sensitive Groups) | 56 (Unhealthy) | 115 (Very bad Hazardous) | 84 (Very Unhealthy) | 68 (Unhealthy) | 57 (Unhealthy) | 35 (Moderate) | 23 (Moderate) | 27 (Moderate) | 30 (Moderate) | 36 (Unhealthy for Sensitive Groups) | 40 (Unhealthy for Sensitive Groups) | 59 (Unhealthy) | 100 (Very Unhealthy) | 106 (Very Unhealthy) | 79 (Very Unhealthy) | 98 (Very Unhealthy) | 58 (Unhealthy) |
| co | 569 (Good) | 594 (Good) | 692 (Good) | 720 (Good) | 1 (Good) | 989 (Good) | 851 (Good) | 922 (Good) | 868 (Good) | 719 (Good) | 737 (Good) | 670 (Good) | 486 (Good) | 536 (Good) | 560 (Good) | 1 (Good) | 1 (Good) | 873 (Good) | 958 (Good) | 708 (Good) |
| no2 | 19 (Good) | 27 (Good) | 28 (Good) | 15 (Good) | 34 (Good) | 50 (Moderate) | 43 (Moderate) | 39 (Good) | 19 (Good) | 12 (Good) | 15 (Good) | 12 (Good) | 20 (Good) | 22 (Good) | 31 (Good) | 34 (Good) | 50 (Moderate) | 49 (Moderate) | 40 (Good) | 46 (Moderate) |
| o3 | 137 (Unhealthy for Sensitive Groups) | 148 (Unhealthy for Sensitive Groups) | 106 (Moderate) | 93 (Moderate) | 75 (Moderate) | 67 (Good) | 102 (Moderate) | 127 (Unhealthy for Sensitive Groups) | 168 (Unhealthy) | 150 (Unhealthy) | 173 (Unhealthy) | 194 (Very Unhealthy) | 153 (Unhealthy) | 127 (Unhealthy for Sensitive Groups) | 113 (Moderate) | 89 (Moderate) | 62 (Good) | 50 (Good) | 90 (Moderate) | 116 (Moderate) |
| pm10 | 70 (Unhealthy for Sensitive Groups) | 84 (Unhealthy) | 89 (Unhealthy) | 74 (Unhealthy for Sensitive Groups) | 142 (Very Unhealthy) | 119 (Very Unhealthy) | 126 (Very Unhealthy) | 116 (Very Unhealthy) | 64 (Unhealthy for Sensitive Groups) | 40 (Moderate) | 45 (Moderate) | 62 (Unhealthy for Sensitive Groups) | 85 (Unhealthy) | 81 (Unhealthy) | 106 (Unhealthy) | 130 (Very Unhealthy) | 149 (Very Unhealthy) | 121 (Very Unhealthy) | 139 (Very Unhealthy) | 93 (Unhealthy) |
| so2 | 7.2 (Good) | 8 (Good) | 7.5 (Good) | 5.8 (Good) | 8.3 (Good) | 10 (Good) | 12 (Good) | 11 (Good) | 8.7 (Good) | 6.7 (Good) | 6.5 (Good) | 7.6 (Good) | 10 (Good) | 9.4 (Good) | 14 (Good) | 13 (Good) | 16 (Good) | 13 (Good) | 11 (Good) | 12 (Good) |
PM10 6.7 (Good)
particulate matter (PM10) suspended dustPM2,5 1.7 (Good)
particulate matter (PM2.5) dustCO 100 (Good)
carbon monoxide (CO)NO2 7.6 (Good)
nitrogen dioxide (NO2)O3 0.02 (Good)
ozone (O3)SO2 8.6 (Good)
sulfur dioxide (SO2)Huaibei Zhi Ye Ji Zhu Xue Yuan
| index | 2022-05-27 |
|---|---|
| pm10 | 32 |
| pm25 | 24 |
| co | 468 |
| no2 | 21 |
| o3 | 32 |
| so2 | 4.6 |
职业技术学院

| index | 2020-05 | 2020-04 | 2020-03 | 2020-02 | 2020-01 | 2019-12 | 2019-11 | 2019-10 | 2019-09 | 2019-08 | 2019-07 | 2019-06 | 2019-05 | 2019-04 | 2019-03 | 2019-02 | 2019-01 | 2018-12 | 2018-11 | 2018-10 |
|---|---|---|---|---|---|---|---|---|---|---|---|---|---|---|---|---|---|---|---|---|
| pm25 | 31 | 42 | 52 | 56 | 115 | 84 | 68 | 57 | 35 | 23 | 27 | 30 | 36 | 40 | 59 | 100 | 106 | 79 | 98 | 58 |
| co | 569 | 594 | 692 | 720 | 1 | 989 | 851 | 922 | 868 | 719 | 737 | 670 | 486 | 536 | 560 | 1 | 1 | 873 | 958 | 708 |
| no2 | 19 | 27 | 28 | 15 | 34 | 50 | 43 | 39 | 19 | 12 | 15 | 12 | 20 | 22 | 31 | 34 | 50 | 49 | 40 | 46 |
| o3 | 137 | 148 | 106 | 93 | 75 | 67 | 102 | 127 | 168 | 150 | 173 | 194 | 153 | 127 | 113 | 89 | 62 | 50 | 90 | 116 |
| pm10 | 70 | 84 | 89 | 74 | 142 | 119 | 126 | 116 | 64 | 40 | 45 | 62 | 85 | 81 | 106 | 130 | 149 | 121 | 139 | 93 |
| so2 | 7.2 | 8 | 7.5 | 5.8 | 8.3 | 10 | 12 | 11 | 8.7 | 6.7 | 6.5 | 7.6 | 10 | 9.4 | 14 | 13 | 16 | 13 | 11 | 12 |