Air Pollution in Zhengjia: Real-time Air Quality Index and smog alert.
Pollution and air quality forecast for Zhengjia. Today is Tuesday, June 16, 2026. The following air pollution values have been recorded for Zhengjia:- particulate matter (PM10) suspended dust - 179 (Very bad Hazardous)
- particulate matter (PM2.5) dust - 35 (Unhealthy for Sensitive Groups)
- ozone (O3) - 0 (Good)
- nitrogen dioxide (NO2) - 0 (Good)
- sulfur dioxide (SO2) - 0 (Good)

What is the air quality in Zhengjia today? Is the air polluted in Zhengjia?. Is there smog?
What is the level of PM10 today in Zhengjia? (particulate matter (PM10) suspended dust)
The current level of particulate matter PM10 in Zhengjia is:
179 (Very bad Hazardous)
The highest PM10 values usually occur in month: 107 (January 2019).
The lowest value of particulate matter PM10 pollution in Zhengjia is usually recorded in: July (28).
What is the current level of PM2.5 in Zhengjia? (particulate matter (PM2.5) dust)
Today's PM2.5 level is:
35 (Unhealthy for Sensitive Groups)
For comparison, the highest level of PM2.5 in Zhengjia in the last 7 days was: 56 (Friday, May 27, 2022) and the lowest: 56 (Friday, May 27, 2022).
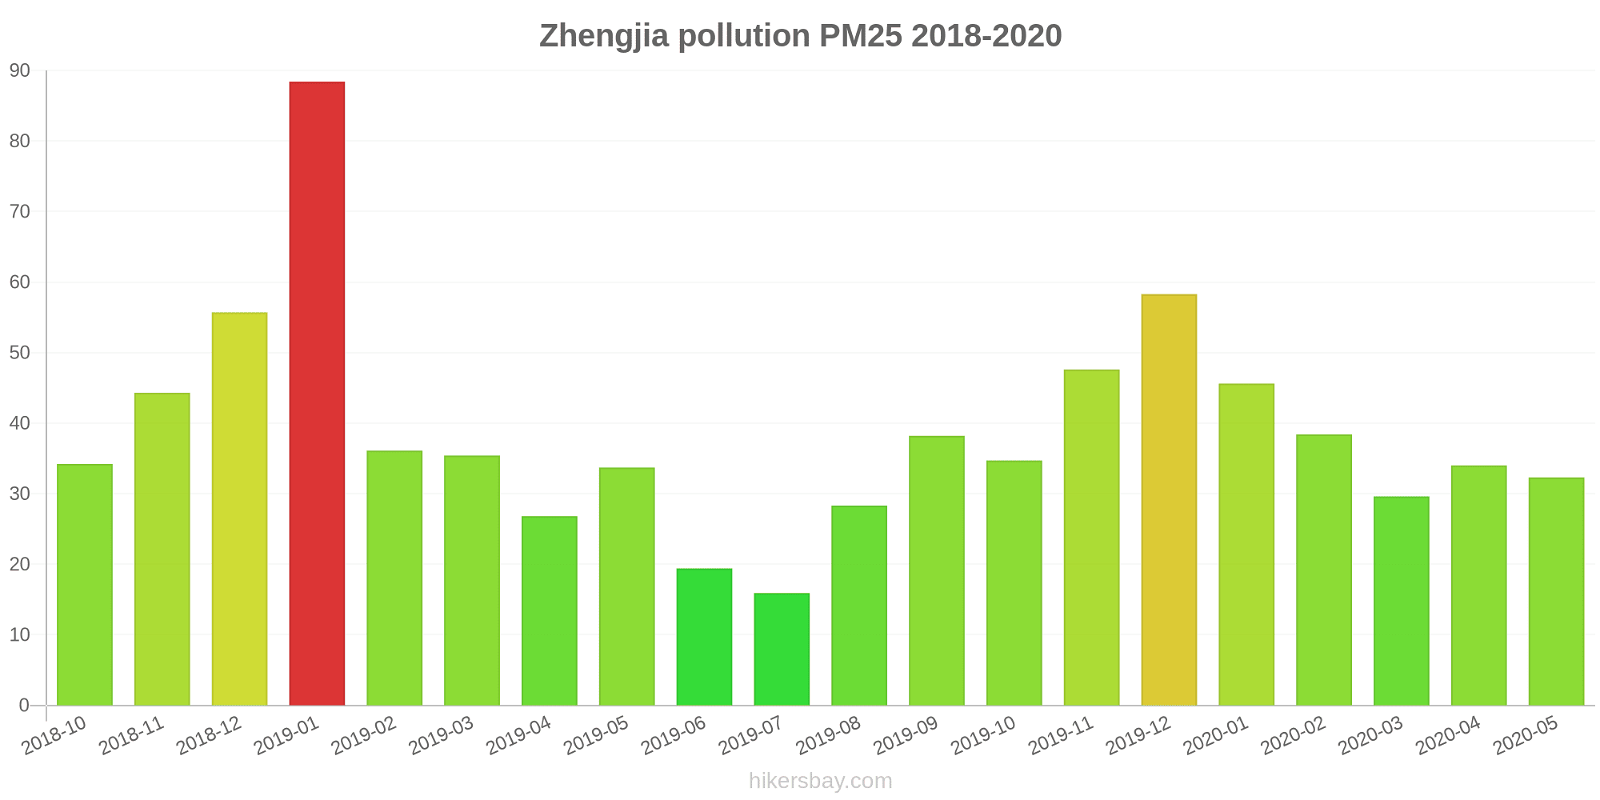
The highest PM2.5 values were recorded: 88 (January 2019).
The lowest level of particulate matter PM2.5 pollution occurs in month: July (16).
How is the O3 level today in Zhengjia? (ozone (O3))
0 (Good)
How high is the level of NO2? (nitrogen dioxide (NO2))
0 (Good)
What is the level of SO2 pollution? (sulfur dioxide (SO2))
0 (Good)
Current data Friday, May 27, 2022, 12:00 PM
PM10 179 (Very bad Hazardous)
PM2,5 35 (Unhealthy for Sensitive Groups)
O3 0 (Good)
NO2 0 (Good)
SO2 0 (Good)
Data on air pollution from recent days in Zhengjia
index
2022-05-27
pm10
56
Unhealthy for Sensitive Groups
pm25
56
Unhealthy
o3
0
Good
no2
0
Good
so2
0
Good
data source »
Air pollution in Zhengjia from October 2018 to May 2020
index
2020-05
2020-04
2020-03
2020-02
2020-01
2019-12
2019-11
2019-10
2019-09
2019-08
2019-07
2019-06
2019-05
2019-04
2019-03
2019-02
2019-01
2018-12
2018-11
2018-10
pm25
32 (Moderate)
34 (Moderate)
30 (Moderate)
38 (Unhealthy for Sensitive Groups)
46 (Unhealthy for Sensitive Groups)
58 (Unhealthy)
48 (Unhealthy for Sensitive Groups)
35 (Moderate)
38 (Unhealthy for Sensitive Groups)
28 (Moderate)
16 (Moderate)
19 (Moderate)
34 (Moderate)
27 (Moderate)
35 (Unhealthy for Sensitive Groups)
36 (Unhealthy for Sensitive Groups)
88 (Very Unhealthy)
56 (Unhealthy)
44 (Unhealthy for Sensitive Groups)
34 (Moderate)
co
588 (Good)
506 (Good)
711 (Good)
694 (Good)
889 (Good)
929 (Good)
713 (Good)
698 (Good)
624 (Good)
505 (Good)
435 (Good)
525 (Good)
558 (Good)
521 (Good)
545 (Good)
905 (Good)
1 (Good)
926 (Good)
795 (Good)
742 (Good)
no2
10 (Good)
19 (Good)
21 (Good)
20 (Good)
28 (Good)
40 (Good)
34 (Good)
28 (Good)
26 (Good)
16 (Good)
12 (Good)
14 (Good)
21 (Good)
28 (Good)
32 (Good)
24 (Good)
43 (Moderate)
28 (Good)
27 (Good)
25 (Good)
o3
95 (Moderate)
105 (Moderate)
70 (Good)
68 (Good)
59 (Good)
81 (Moderate)
109 (Moderate)
100 (Moderate)
140 (Unhealthy for Sensitive Groups)
117 (Moderate)
83 (Moderate)
92 (Moderate)
104 (Moderate)
75 (Moderate)
64 (Good)
44 (Good)
48 (Good)
39 (Good)
82 (Moderate)
91 (Moderate)
pm10
47 (Moderate)
50 (Moderate)
42 (Moderate)
47 (Moderate)
57 (Unhealthy for Sensitive Groups)
83 (Unhealthy)
77 (Unhealthy for Sensitive Groups)
56 (Unhealthy for Sensitive Groups)
60 (Unhealthy for Sensitive Groups)
44 (Moderate)
28 (Moderate)
38 (Moderate)
63 (Unhealthy for Sensitive Groups)
47 (Moderate)
54 (Unhealthy for Sensitive Groups)
54 (Unhealthy for Sensitive Groups)
107 (Unhealthy)
83 (Unhealthy)
69 (Unhealthy for Sensitive Groups)
59 (Unhealthy for Sensitive Groups)
so2
10 (Good)
13 (Good)
8.1 (Good)
4.1 (Good)
4.7 (Good)
19 (Good)
13 (Good)
12 (Good)
17 (Good)
15 (Good)
7.5 (Good)
7 (Good)
12 (Good)
11 (Good)
9.5 (Good)
5.7 (Good)
8.2 (Good)
5.4 (Good)
8 (Good)
8.4 (Good)
data source »
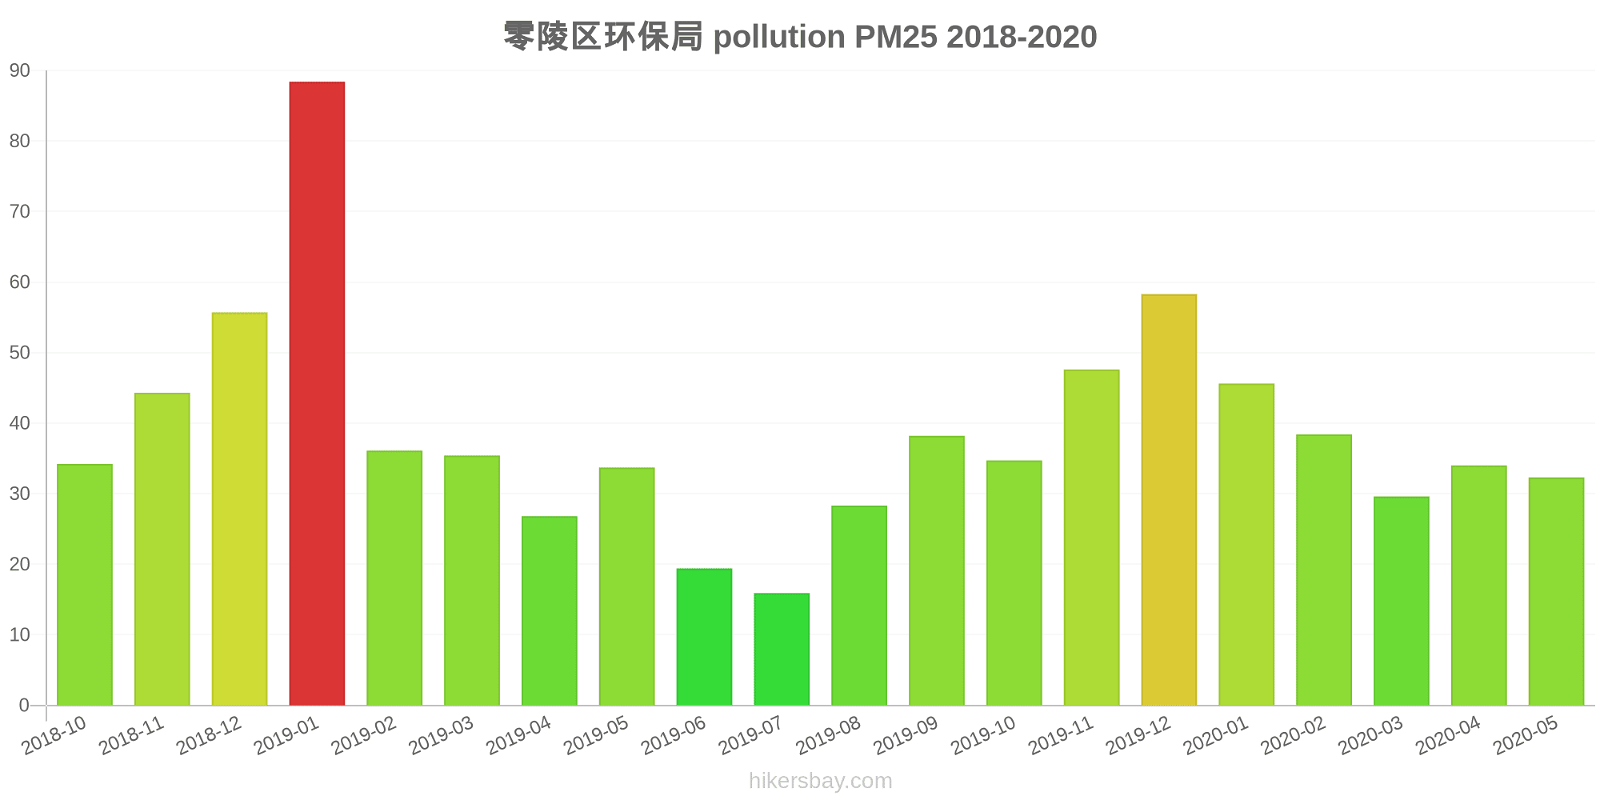
零陵区环保局
Friday, May 27, 2022, 12:00 PM
PM10 179 (Very bad Hazardous)
particulate matter (PM10) suspended dust
PM2,5 35 (Unhealthy for Sensitive Groups)
particulate matter (PM2.5) dust
O3 0.04 (Good)
ozone (O3)
NO2 0 (Good)
nitrogen dioxide (NO2)
SO2 0 (Good)
sulfur dioxide (SO2)
零陵区环保局
index
2022-05-27
pm10
56
pm25
56
o3
0.03
no2
0
so2
0
零陵区环保局
2018-10 2020-05
index
2020-05
2020-04
2020-03
2020-02
2020-01
2019-12
2019-11
2019-10
2019-09
2019-08
2019-07
2019-06
2019-05
2019-04
2019-03
2019-02
2019-01
2018-12
2018-11
2018-10
pm25
32
34
30
38
46
58
48
35
38
28
16
19
34
27
35
36
88
56
44
34
co
588
506
711
694
889
929
713
698
624
505
435
525
558
521
545
905
1
926
795
742
no2
10
19
21
20
28
40
34
28
26
16
12
14
21
28
32
24
43
28
27
25
o3
95
105
70
68
59
81
109
100
140
117
83
92
104
75
64
44
48
39
82
91
pm10
47
50
42
47
57
83
77
56
60
44
28
38
63
47
54
54
107
83
69
59
so2
10
13
8.1
4.1
4.7
19
13
12
17
15
7.5
7
12
11
9.5
5.7
8.2
5.4
8
8.4
* Pollution data source:
https://openaq.org
(ChinaAQIData)
The data is licensed under CC-By 4.0
PM10 179 (Very bad Hazardous)
PM2,5 35 (Unhealthy for Sensitive Groups)
O3 0 (Good)
NO2 0 (Good)
SO2 0 (Good)
Data on air pollution from recent days in Zhengjia
| index | 2022-05-27 |
|---|---|
| pm10 | 56 Unhealthy for Sensitive Groups |
| pm25 | 56 Unhealthy |
| o3 | 0 Good |
| no2 | 0 Good |
| so2 | 0 Good |

| index | 2020-05 | 2020-04 | 2020-03 | 2020-02 | 2020-01 | 2019-12 | 2019-11 | 2019-10 | 2019-09 | 2019-08 | 2019-07 | 2019-06 | 2019-05 | 2019-04 | 2019-03 | 2019-02 | 2019-01 | 2018-12 | 2018-11 | 2018-10 |
|---|---|---|---|---|---|---|---|---|---|---|---|---|---|---|---|---|---|---|---|---|
| pm25 | 32 (Moderate) | 34 (Moderate) | 30 (Moderate) | 38 (Unhealthy for Sensitive Groups) | 46 (Unhealthy for Sensitive Groups) | 58 (Unhealthy) | 48 (Unhealthy for Sensitive Groups) | 35 (Moderate) | 38 (Unhealthy for Sensitive Groups) | 28 (Moderate) | 16 (Moderate) | 19 (Moderate) | 34 (Moderate) | 27 (Moderate) | 35 (Unhealthy for Sensitive Groups) | 36 (Unhealthy for Sensitive Groups) | 88 (Very Unhealthy) | 56 (Unhealthy) | 44 (Unhealthy for Sensitive Groups) | 34 (Moderate) |
| co | 588 (Good) | 506 (Good) | 711 (Good) | 694 (Good) | 889 (Good) | 929 (Good) | 713 (Good) | 698 (Good) | 624 (Good) | 505 (Good) | 435 (Good) | 525 (Good) | 558 (Good) | 521 (Good) | 545 (Good) | 905 (Good) | 1 (Good) | 926 (Good) | 795 (Good) | 742 (Good) |
| no2 | 10 (Good) | 19 (Good) | 21 (Good) | 20 (Good) | 28 (Good) | 40 (Good) | 34 (Good) | 28 (Good) | 26 (Good) | 16 (Good) | 12 (Good) | 14 (Good) | 21 (Good) | 28 (Good) | 32 (Good) | 24 (Good) | 43 (Moderate) | 28 (Good) | 27 (Good) | 25 (Good) |
| o3 | 95 (Moderate) | 105 (Moderate) | 70 (Good) | 68 (Good) | 59 (Good) | 81 (Moderate) | 109 (Moderate) | 100 (Moderate) | 140 (Unhealthy for Sensitive Groups) | 117 (Moderate) | 83 (Moderate) | 92 (Moderate) | 104 (Moderate) | 75 (Moderate) | 64 (Good) | 44 (Good) | 48 (Good) | 39 (Good) | 82 (Moderate) | 91 (Moderate) |
| pm10 | 47 (Moderate) | 50 (Moderate) | 42 (Moderate) | 47 (Moderate) | 57 (Unhealthy for Sensitive Groups) | 83 (Unhealthy) | 77 (Unhealthy for Sensitive Groups) | 56 (Unhealthy for Sensitive Groups) | 60 (Unhealthy for Sensitive Groups) | 44 (Moderate) | 28 (Moderate) | 38 (Moderate) | 63 (Unhealthy for Sensitive Groups) | 47 (Moderate) | 54 (Unhealthy for Sensitive Groups) | 54 (Unhealthy for Sensitive Groups) | 107 (Unhealthy) | 83 (Unhealthy) | 69 (Unhealthy for Sensitive Groups) | 59 (Unhealthy for Sensitive Groups) |
| so2 | 10 (Good) | 13 (Good) | 8.1 (Good) | 4.1 (Good) | 4.7 (Good) | 19 (Good) | 13 (Good) | 12 (Good) | 17 (Good) | 15 (Good) | 7.5 (Good) | 7 (Good) | 12 (Good) | 11 (Good) | 9.5 (Good) | 5.7 (Good) | 8.2 (Good) | 5.4 (Good) | 8 (Good) | 8.4 (Good) |
PM10 179 (Very bad Hazardous)
particulate matter (PM10) suspended dustPM2,5 35 (Unhealthy for Sensitive Groups)
particulate matter (PM2.5) dustO3 0.04 (Good)
ozone (O3)NO2 0 (Good)
nitrogen dioxide (NO2)SO2 0 (Good)
sulfur dioxide (SO2)零陵区环保局
| index | 2022-05-27 |
|---|---|
| pm10 | 56 |
| pm25 | 56 |
| o3 | 0.03 |
| no2 | 0 |
| so2 | 0 |
零陵区环保局

| index | 2020-05 | 2020-04 | 2020-03 | 2020-02 | 2020-01 | 2019-12 | 2019-11 | 2019-10 | 2019-09 | 2019-08 | 2019-07 | 2019-06 | 2019-05 | 2019-04 | 2019-03 | 2019-02 | 2019-01 | 2018-12 | 2018-11 | 2018-10 |
|---|---|---|---|---|---|---|---|---|---|---|---|---|---|---|---|---|---|---|---|---|
| pm25 | 32 | 34 | 30 | 38 | 46 | 58 | 48 | 35 | 38 | 28 | 16 | 19 | 34 | 27 | 35 | 36 | 88 | 56 | 44 | 34 |
| co | 588 | 506 | 711 | 694 | 889 | 929 | 713 | 698 | 624 | 505 | 435 | 525 | 558 | 521 | 545 | 905 | 1 | 926 | 795 | 742 |
| no2 | 10 | 19 | 21 | 20 | 28 | 40 | 34 | 28 | 26 | 16 | 12 | 14 | 21 | 28 | 32 | 24 | 43 | 28 | 27 | 25 |
| o3 | 95 | 105 | 70 | 68 | 59 | 81 | 109 | 100 | 140 | 117 | 83 | 92 | 104 | 75 | 64 | 44 | 48 | 39 | 82 | 91 |
| pm10 | 47 | 50 | 42 | 47 | 57 | 83 | 77 | 56 | 60 | 44 | 28 | 38 | 63 | 47 | 54 | 54 | 107 | 83 | 69 | 59 |
| so2 | 10 | 13 | 8.1 | 4.1 | 4.7 | 19 | 13 | 12 | 17 | 15 | 7.5 | 7 | 12 | 11 | 9.5 | 5.7 | 8.2 | 5.4 | 8 | 8.4 |