Air Pollution in Wujia: Real-time Air Quality Index and smog alert.
Pollution and air quality forecast for Wujia. Today is Tuesday, June 16, 2026. The following air pollution values have been recorded for Wujia:- particulate matter (PM10) suspended dust - 179 (Very bad Hazardous)
- particulate matter (PM2.5) dust - 35 (Unhealthy for Sensitive Groups)
- ozone (O3) - 0 (Good)
- nitrogen dioxide (NO2) - 0 (Good)
- sulfur dioxide (SO2) - 0 (Good)

What is the air quality in Wujia today? Is the air polluted in Wujia?. Is there smog?
What is the level of PM10 today in Wujia? (particulate matter (PM10) suspended dust)
The current level of particulate matter PM10 in Wujia is:
179 (Very bad Hazardous)
The highest PM10 values usually occur in month: 101 (January 2019).
The lowest value of particulate matter PM10 pollution in Wujia is usually recorded in: July (22).
What is the current level of PM2.5 in Wujia? (particulate matter (PM2.5) dust)
Today's PM2.5 level is:
35 (Unhealthy for Sensitive Groups)
For comparison, the highest level of PM2.5 in Wujia in the last 7 days was: 56 (Friday, May 27, 2022) and the lowest: 56 (Friday, May 27, 2022).
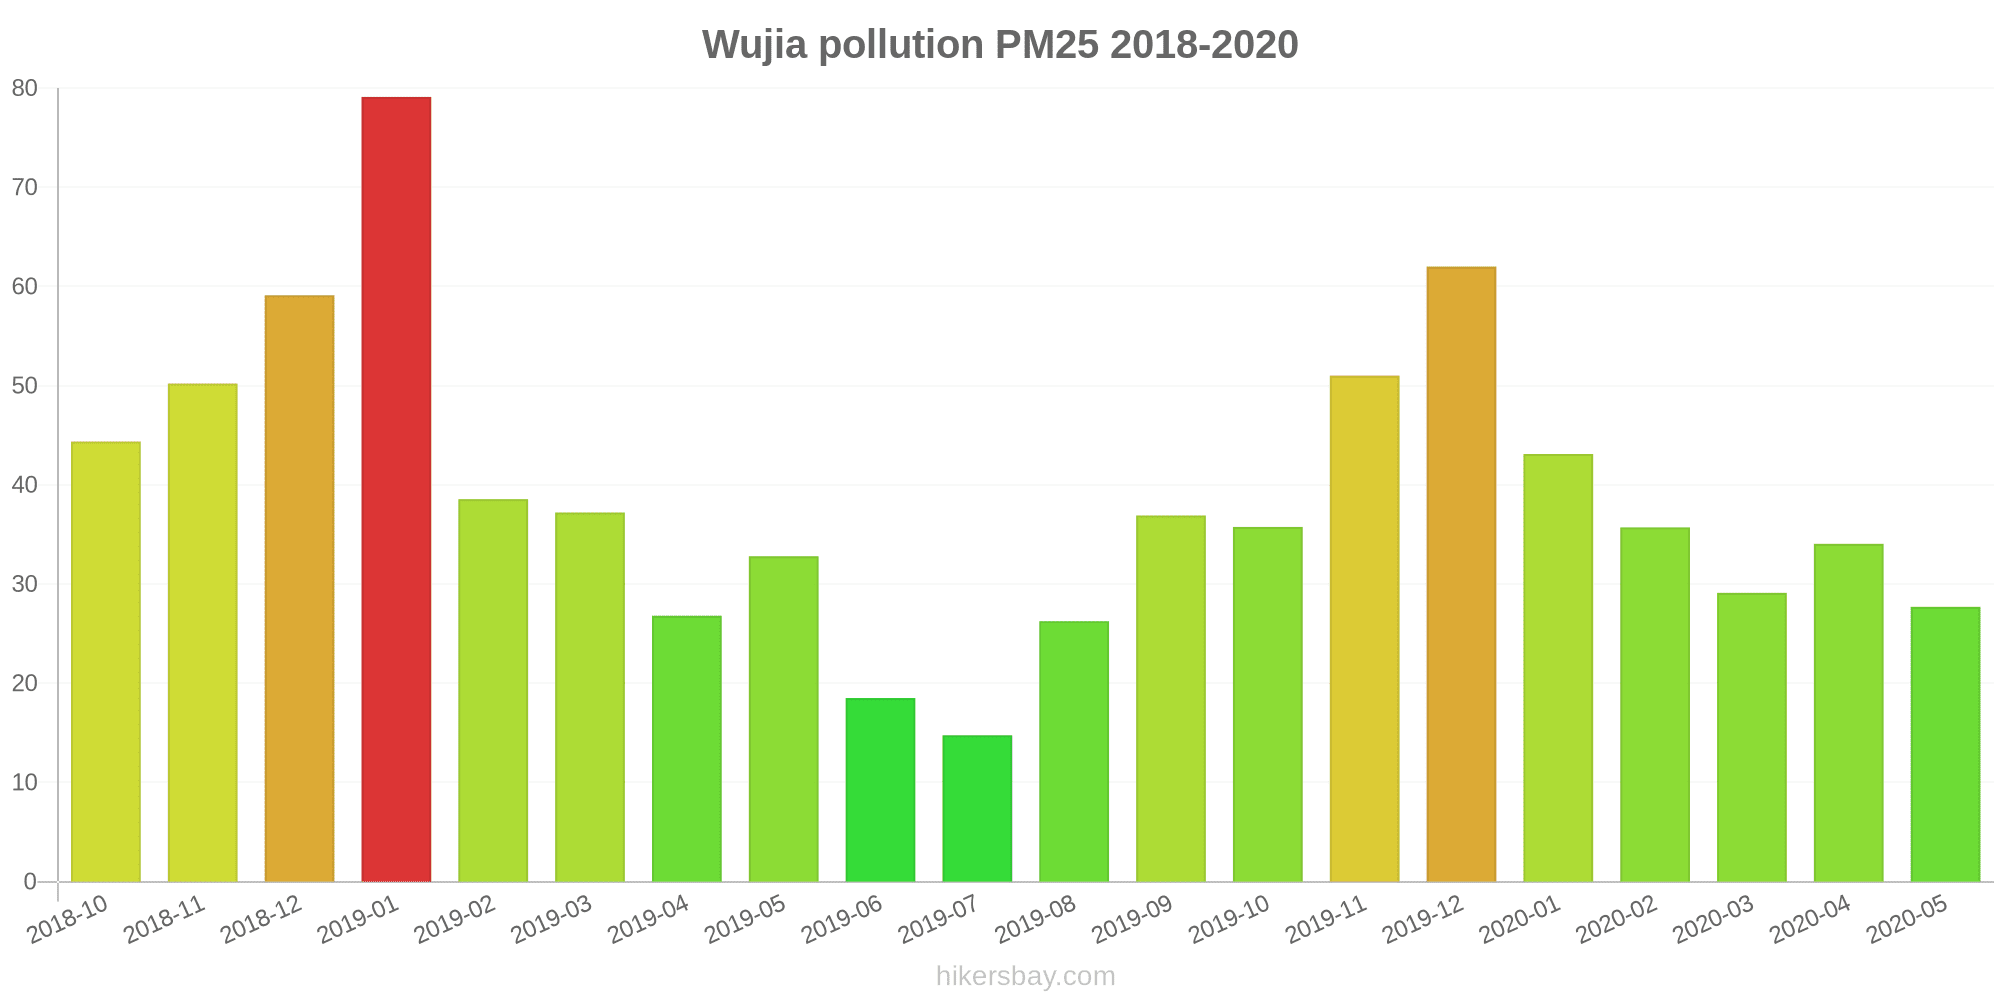
The highest PM2.5 values were recorded: 79 (January 2019).
The lowest level of particulate matter PM2.5 pollution occurs in month: July (15).
How is the O3 level today in Wujia? (ozone (O3))
0 (Good)
How high is the level of NO2? (nitrogen dioxide (NO2))
0 (Good)
What is the level of SO2 pollution? (sulfur dioxide (SO2))
0 (Good)
Current data Friday, May 27, 2022, 12:00 PM
PM10 179 (Very bad Hazardous)
PM2,5 35 (Unhealthy for Sensitive Groups)
O3 0 (Good)
NO2 0 (Good)
SO2 0 (Good)
Data on air pollution from recent days in Wujia
index
2022-05-27
pm10
56
Unhealthy for Sensitive Groups
pm25
56
Unhealthy
o3
0
Good
no2
0
Good
so2
0
Good
data source »
Air pollution in Wujia from October 2018 to May 2020

index
2020-05
2020-04
2020-03
2020-02
2020-01
2019-12
2019-11
2019-10
2019-09
2019-08
2019-07
2019-06
2019-05
2019-04
2019-03
2019-02
2019-01
2018-12
2018-11
2018-10
pm25
28 (Moderate)
34 (Moderate)
29 (Moderate)
36 (Unhealthy for Sensitive Groups)
43 (Unhealthy for Sensitive Groups)
62 (Unhealthy)
51 (Unhealthy for Sensitive Groups)
36 (Unhealthy for Sensitive Groups)
37 (Unhealthy for Sensitive Groups)
26 (Moderate)
15 (Moderate)
19 (Moderate)
33 (Moderate)
27 (Moderate)
37 (Unhealthy for Sensitive Groups)
39 (Unhealthy for Sensitive Groups)
79 (Very Unhealthy)
59 (Unhealthy)
50 (Unhealthy for Sensitive Groups)
44 (Unhealthy for Sensitive Groups)
co
522 (Good)
540 (Good)
488 (Good)
604 (Good)
854 (Good)
831 (Good)
653 (Good)
654 (Good)
596 (Good)
541 (Good)
364 (Good)
413 (Good)
574 (Good)
556 (Good)
602 (Good)
710 (Good)
489 (Good)
723 (Good)
602 (Good)
479 (Good)
no2
14 (Good)
20 (Good)
21 (Good)
21 (Good)
27 (Good)
41 (Moderate)
36 (Good)
28 (Good)
24 (Good)
18 (Good)
12 (Good)
13 (Good)
28 (Good)
31 (Good)
35 (Good)
26 (Good)
34 (Good)
29 (Good)
28 (Good)
29 (Good)
o3
102 (Moderate)
112 (Moderate)
76 (Moderate)
73 (Moderate)
63 (Good)
88 (Moderate)
120 (Unhealthy for Sensitive Groups)
111 (Moderate)
161 (Unhealthy)
138 (Unhealthy for Sensitive Groups)
86 (Moderate)
97 (Moderate)
102 (Moderate)
84 (Moderate)
77 (Moderate)
62 (Good)
71 (Moderate)
52 (Good)
91 (Moderate)
100 (Moderate)
pm10
43 (Moderate)
49 (Moderate)
42 (Moderate)
47 (Moderate)
57 (Unhealthy for Sensitive Groups)
91 (Unhealthy)
84 (Unhealthy)
55 (Unhealthy for Sensitive Groups)
58 (Unhealthy for Sensitive Groups)
41 (Moderate)
22 (Moderate)
27 (Moderate)
52 (Unhealthy for Sensitive Groups)
40 (Moderate)
51 (Unhealthy for Sensitive Groups)
50 (Unhealthy for Sensitive Groups)
101 (Unhealthy)
79 (Unhealthy for Sensitive Groups)
67 (Unhealthy for Sensitive Groups)
64 (Unhealthy for Sensitive Groups)
so2
6.3 (Good)
7.2 (Good)
4.1 (Good)
2.7 (Good)
5 (Good)
9 (Good)
9.2 (Good)
7.7 (Good)
8.3 (Good)
7.2 (Good)
7.3 (Good)
6.8 (Good)
8.8 (Good)
10 (Good)
9.2 (Good)
5.8 (Good)
6.8 (Good)
5.7 (Good)
6.7 (Good)
7.3 (Good)
data source »
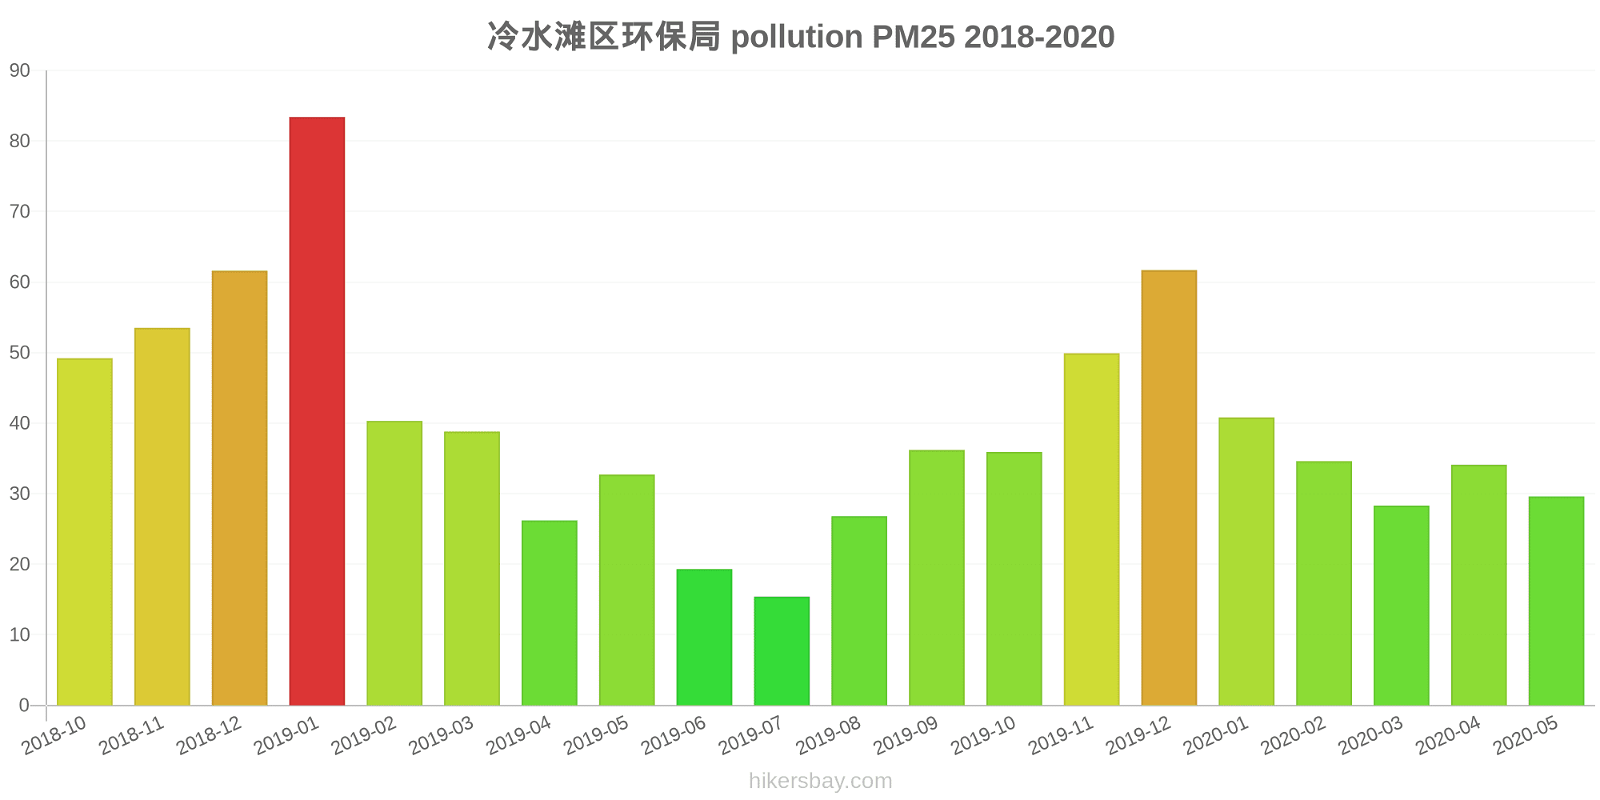
冷水滩区环保局
Friday, May 27, 2022, 12:00 PM
PM10 179 (Very bad Hazardous)
particulate matter (PM10) suspended dust
PM2,5 35 (Unhealthy for Sensitive Groups)
particulate matter (PM2.5) dust
O3 0.04 (Good)
ozone (O3)
NO2 0 (Good)
nitrogen dioxide (NO2)
SO2 0 (Good)
sulfur dioxide (SO2)
永州市环保局
Friday, May 27, 2022, 12:00 PM
PM10 179 (Very bad Hazardous)
particulate matter (PM10) suspended dust
PM2,5 35 (Unhealthy for Sensitive Groups)
particulate matter (PM2.5) dust
O3 0.04 (Good)
ozone (O3)
NO2 0 (Good)
nitrogen dioxide (NO2)
SO2 0 (Good)
sulfur dioxide (SO2)
冷水滩区环保局
index
2022-05-27
pm10
56
pm25
56
o3
0.03
no2
0
so2
0
永州市环保局
index
2022-05-27
pm10
56
pm25
56
o3
0.03
no2
0
so2
0
冷水滩区环保局
2018-10 2020-05
index
2020-05
2020-04
2020-03
2020-02
2020-01
2019-12
2019-11
2019-10
2019-09
2019-08
2019-07
2019-06
2019-05
2019-04
2019-03
2019-02
2019-01
2018-12
2018-11
2018-10
pm25
30
34
28
35
41
62
50
36
36
27
15
19
33
26
39
40
83
62
54
49
co
552
613
585
697
928
896
740
668
587
489
363
440
589
584
656
686
1
807
646
494
no2
15
23
22
21
28
44
38
28
23
18
12
14
32
31
35
26
36
29
26
26
o3
103
113
76
74
65
86
119
113
163
139
81
95
105
86
86
62
70
48
90
99
pm10
49
54
46
51
62
93
87
61
60
43
22
29
55
45
57
53
106
84
73
70
so2
7.1
7.9
4.3
2.7
6.2
11
11
10
11
9.6
9.8
8.1
9.2
11
9.4
5.1
5.9
6.3
7.3
9.2
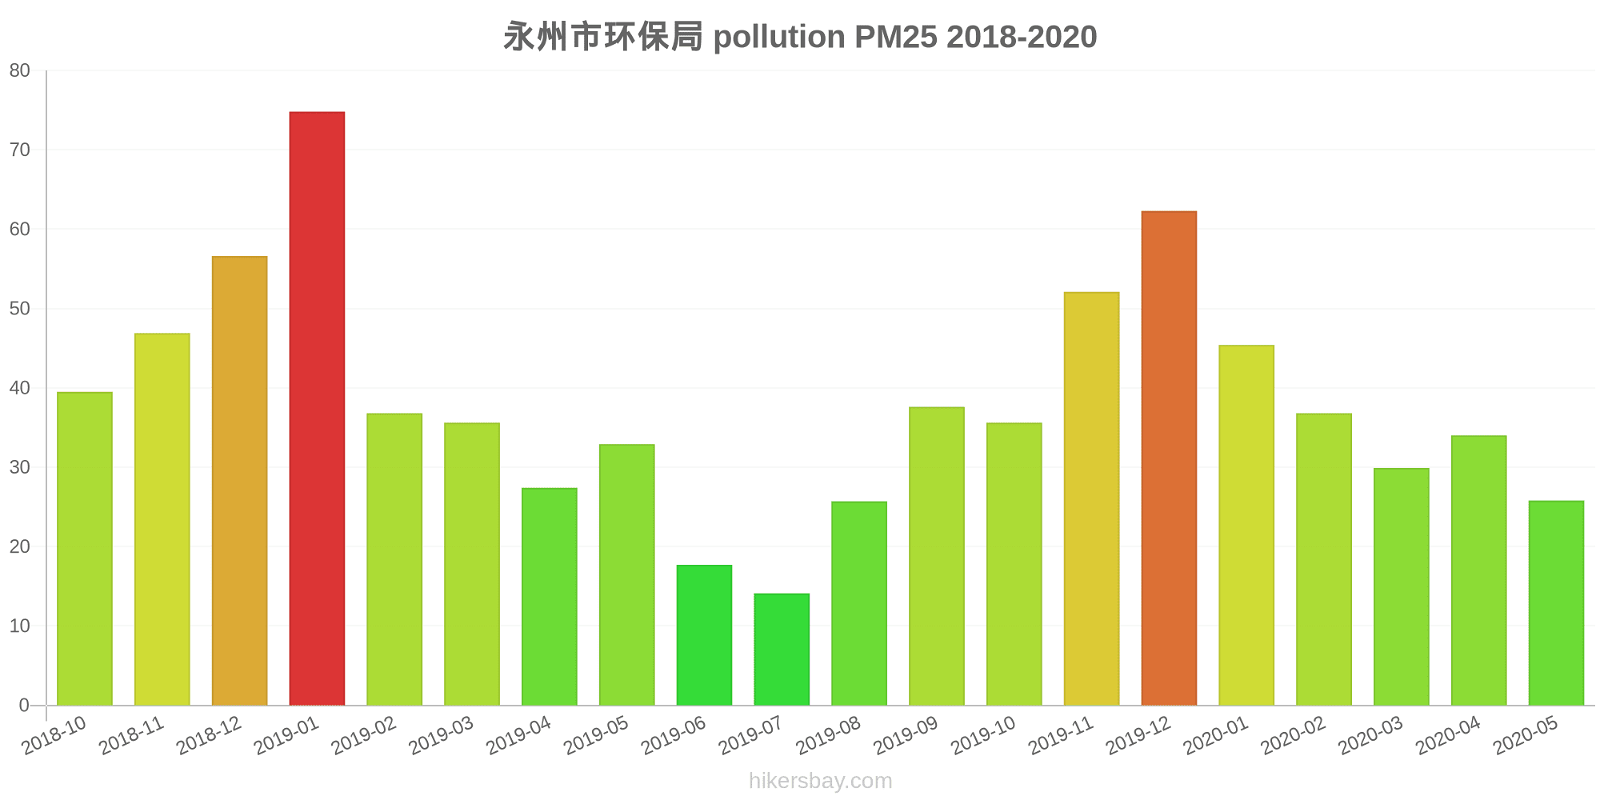
永州市环保局
2018-10 2020-05
index
2020-05
2020-04
2020-03
2020-02
2020-01
2019-12
2019-11
2019-10
2019-09
2019-08
2019-07
2019-06
2019-05
2019-04
2019-03
2019-02
2019-01
2018-12
2018-11
2018-10
pm25
26
34
30
37
45
62
52
36
38
26
14
18
33
27
36
37
75
57
47
40
co
492
466
391
511
780
765
566
640
604
593
364
386
559
527
547
734
977
639
557
464
no2
13
18
20
21
26
38
33
27
25
19
12
12
25
30
35
25
32
29
30
32
o3
100
111
76
72
62
90
121
109
159
136
91
99
99
82
69
63
72
56
92
101
pm10
38
43
37
43
53
89
80
50
55
39
22
26
50
35
46
47
95
74
61
57
so2
5.5
6.4
3.9
2.7
3.8
6.7
7.1
5.4
5.4
4.8
4.8
5.5
8.4
9.3
9.1
6.4
7.7
5.2
6.2
5.4
* Pollution data source:
https://openaq.org
(ChinaAQIData)
The data is licensed under CC-By 4.0
PM10 179 (Very bad Hazardous)
PM2,5 35 (Unhealthy for Sensitive Groups)
O3 0 (Good)
NO2 0 (Good)
SO2 0 (Good)
Data on air pollution from recent days in Wujia
| index | 2022-05-27 |
|---|---|
| pm10 | 56 Unhealthy for Sensitive Groups |
| pm25 | 56 Unhealthy |
| o3 | 0 Good |
| no2 | 0 Good |
| so2 | 0 Good |
| index | 2020-05 | 2020-04 | 2020-03 | 2020-02 | 2020-01 | 2019-12 | 2019-11 | 2019-10 | 2019-09 | 2019-08 | 2019-07 | 2019-06 | 2019-05 | 2019-04 | 2019-03 | 2019-02 | 2019-01 | 2018-12 | 2018-11 | 2018-10 |
|---|---|---|---|---|---|---|---|---|---|---|---|---|---|---|---|---|---|---|---|---|
| pm25 | 28 (Moderate) | 34 (Moderate) | 29 (Moderate) | 36 (Unhealthy for Sensitive Groups) | 43 (Unhealthy for Sensitive Groups) | 62 (Unhealthy) | 51 (Unhealthy for Sensitive Groups) | 36 (Unhealthy for Sensitive Groups) | 37 (Unhealthy for Sensitive Groups) | 26 (Moderate) | 15 (Moderate) | 19 (Moderate) | 33 (Moderate) | 27 (Moderate) | 37 (Unhealthy for Sensitive Groups) | 39 (Unhealthy for Sensitive Groups) | 79 (Very Unhealthy) | 59 (Unhealthy) | 50 (Unhealthy for Sensitive Groups) | 44 (Unhealthy for Sensitive Groups) |
| co | 522 (Good) | 540 (Good) | 488 (Good) | 604 (Good) | 854 (Good) | 831 (Good) | 653 (Good) | 654 (Good) | 596 (Good) | 541 (Good) | 364 (Good) | 413 (Good) | 574 (Good) | 556 (Good) | 602 (Good) | 710 (Good) | 489 (Good) | 723 (Good) | 602 (Good) | 479 (Good) |
| no2 | 14 (Good) | 20 (Good) | 21 (Good) | 21 (Good) | 27 (Good) | 41 (Moderate) | 36 (Good) | 28 (Good) | 24 (Good) | 18 (Good) | 12 (Good) | 13 (Good) | 28 (Good) | 31 (Good) | 35 (Good) | 26 (Good) | 34 (Good) | 29 (Good) | 28 (Good) | 29 (Good) |
| o3 | 102 (Moderate) | 112 (Moderate) | 76 (Moderate) | 73 (Moderate) | 63 (Good) | 88 (Moderate) | 120 (Unhealthy for Sensitive Groups) | 111 (Moderate) | 161 (Unhealthy) | 138 (Unhealthy for Sensitive Groups) | 86 (Moderate) | 97 (Moderate) | 102 (Moderate) | 84 (Moderate) | 77 (Moderate) | 62 (Good) | 71 (Moderate) | 52 (Good) | 91 (Moderate) | 100 (Moderate) |
| pm10 | 43 (Moderate) | 49 (Moderate) | 42 (Moderate) | 47 (Moderate) | 57 (Unhealthy for Sensitive Groups) | 91 (Unhealthy) | 84 (Unhealthy) | 55 (Unhealthy for Sensitive Groups) | 58 (Unhealthy for Sensitive Groups) | 41 (Moderate) | 22 (Moderate) | 27 (Moderate) | 52 (Unhealthy for Sensitive Groups) | 40 (Moderate) | 51 (Unhealthy for Sensitive Groups) | 50 (Unhealthy for Sensitive Groups) | 101 (Unhealthy) | 79 (Unhealthy for Sensitive Groups) | 67 (Unhealthy for Sensitive Groups) | 64 (Unhealthy for Sensitive Groups) |
| so2 | 6.3 (Good) | 7.2 (Good) | 4.1 (Good) | 2.7 (Good) | 5 (Good) | 9 (Good) | 9.2 (Good) | 7.7 (Good) | 8.3 (Good) | 7.2 (Good) | 7.3 (Good) | 6.8 (Good) | 8.8 (Good) | 10 (Good) | 9.2 (Good) | 5.8 (Good) | 6.8 (Good) | 5.7 (Good) | 6.7 (Good) | 7.3 (Good) |
PM10 179 (Very bad Hazardous)
particulate matter (PM10) suspended dustPM2,5 35 (Unhealthy for Sensitive Groups)
particulate matter (PM2.5) dustO3 0.04 (Good)
ozone (O3)NO2 0 (Good)
nitrogen dioxide (NO2)SO2 0 (Good)
sulfur dioxide (SO2)PM10 179 (Very bad Hazardous)
particulate matter (PM10) suspended dustPM2,5 35 (Unhealthy for Sensitive Groups)
particulate matter (PM2.5) dustO3 0.04 (Good)
ozone (O3)NO2 0 (Good)
nitrogen dioxide (NO2)SO2 0 (Good)
sulfur dioxide (SO2)冷水滩区环保局
| index | 2022-05-27 |
|---|---|
| pm10 | 56 |
| pm25 | 56 |
| o3 | 0.03 |
| no2 | 0 |
| so2 | 0 |
永州市环保局
| index | 2022-05-27 |
|---|---|
| pm10 | 56 |
| pm25 | 56 |
| o3 | 0.03 |
| no2 | 0 |
| so2 | 0 |
冷水滩区环保局

| index | 2020-05 | 2020-04 | 2020-03 | 2020-02 | 2020-01 | 2019-12 | 2019-11 | 2019-10 | 2019-09 | 2019-08 | 2019-07 | 2019-06 | 2019-05 | 2019-04 | 2019-03 | 2019-02 | 2019-01 | 2018-12 | 2018-11 | 2018-10 |
|---|---|---|---|---|---|---|---|---|---|---|---|---|---|---|---|---|---|---|---|---|
| pm25 | 30 | 34 | 28 | 35 | 41 | 62 | 50 | 36 | 36 | 27 | 15 | 19 | 33 | 26 | 39 | 40 | 83 | 62 | 54 | 49 |
| co | 552 | 613 | 585 | 697 | 928 | 896 | 740 | 668 | 587 | 489 | 363 | 440 | 589 | 584 | 656 | 686 | 1 | 807 | 646 | 494 |
| no2 | 15 | 23 | 22 | 21 | 28 | 44 | 38 | 28 | 23 | 18 | 12 | 14 | 32 | 31 | 35 | 26 | 36 | 29 | 26 | 26 |
| o3 | 103 | 113 | 76 | 74 | 65 | 86 | 119 | 113 | 163 | 139 | 81 | 95 | 105 | 86 | 86 | 62 | 70 | 48 | 90 | 99 |
| pm10 | 49 | 54 | 46 | 51 | 62 | 93 | 87 | 61 | 60 | 43 | 22 | 29 | 55 | 45 | 57 | 53 | 106 | 84 | 73 | 70 |
| so2 | 7.1 | 7.9 | 4.3 | 2.7 | 6.2 | 11 | 11 | 10 | 11 | 9.6 | 9.8 | 8.1 | 9.2 | 11 | 9.4 | 5.1 | 5.9 | 6.3 | 7.3 | 9.2 |
永州市环保局

| index | 2020-05 | 2020-04 | 2020-03 | 2020-02 | 2020-01 | 2019-12 | 2019-11 | 2019-10 | 2019-09 | 2019-08 | 2019-07 | 2019-06 | 2019-05 | 2019-04 | 2019-03 | 2019-02 | 2019-01 | 2018-12 | 2018-11 | 2018-10 |
|---|---|---|---|---|---|---|---|---|---|---|---|---|---|---|---|---|---|---|---|---|
| pm25 | 26 | 34 | 30 | 37 | 45 | 62 | 52 | 36 | 38 | 26 | 14 | 18 | 33 | 27 | 36 | 37 | 75 | 57 | 47 | 40 |
| co | 492 | 466 | 391 | 511 | 780 | 765 | 566 | 640 | 604 | 593 | 364 | 386 | 559 | 527 | 547 | 734 | 977 | 639 | 557 | 464 |
| no2 | 13 | 18 | 20 | 21 | 26 | 38 | 33 | 27 | 25 | 19 | 12 | 12 | 25 | 30 | 35 | 25 | 32 | 29 | 30 | 32 |
| o3 | 100 | 111 | 76 | 72 | 62 | 90 | 121 | 109 | 159 | 136 | 91 | 99 | 99 | 82 | 69 | 63 | 72 | 56 | 92 | 101 |
| pm10 | 38 | 43 | 37 | 43 | 53 | 89 | 80 | 50 | 55 | 39 | 22 | 26 | 50 | 35 | 46 | 47 | 95 | 74 | 61 | 57 |
| so2 | 5.5 | 6.4 | 3.9 | 2.7 | 3.8 | 6.7 | 7.1 | 5.4 | 5.4 | 4.8 | 4.8 | 5.5 | 8.4 | 9.3 | 9.1 | 6.4 | 7.7 | 5.2 | 6.2 | 5.4 |