Air Pollution in Yanjialong: Real-time Air Quality Index and smog alert.
Pollution and air quality forecast for Yanjialong. Today is Tuesday, June 16, 2026. The following air pollution values have been recorded for Yanjialong:- particulate matter (PM10) suspended dust - 179 (Very bad Hazardous)
- particulate matter (PM2.5) dust - 35 (Unhealthy for Sensitive Groups)
- ozone (O3) - 0 (Good)
- nitrogen dioxide (NO2) - 0 (Good)
- sulfur dioxide (SO2) - 0 (Good)

What is the air quality in Yanjialong today? Is the air polluted in Yanjialong?. Is there smog?
What is the level of PM10 today in Yanjialong? (particulate matter (PM10) suspended dust)
The current level of particulate matter PM10 in Yanjialong is:
179 (Very bad Hazardous)
The highest PM10 values usually occur in month: 77 (November 2019).
The lowest value of particulate matter PM10 pollution in Yanjialong is usually recorded in: February (37).
What is the current level of PM2.5 in Yanjialong? (particulate matter (PM2.5) dust)
Today's PM2.5 level is:
35 (Unhealthy for Sensitive Groups)
For comparison, the highest level of PM2.5 in Yanjialong in the last 7 days was: 56 (Friday, May 27, 2022) and the lowest: 56 (Friday, May 27, 2022).
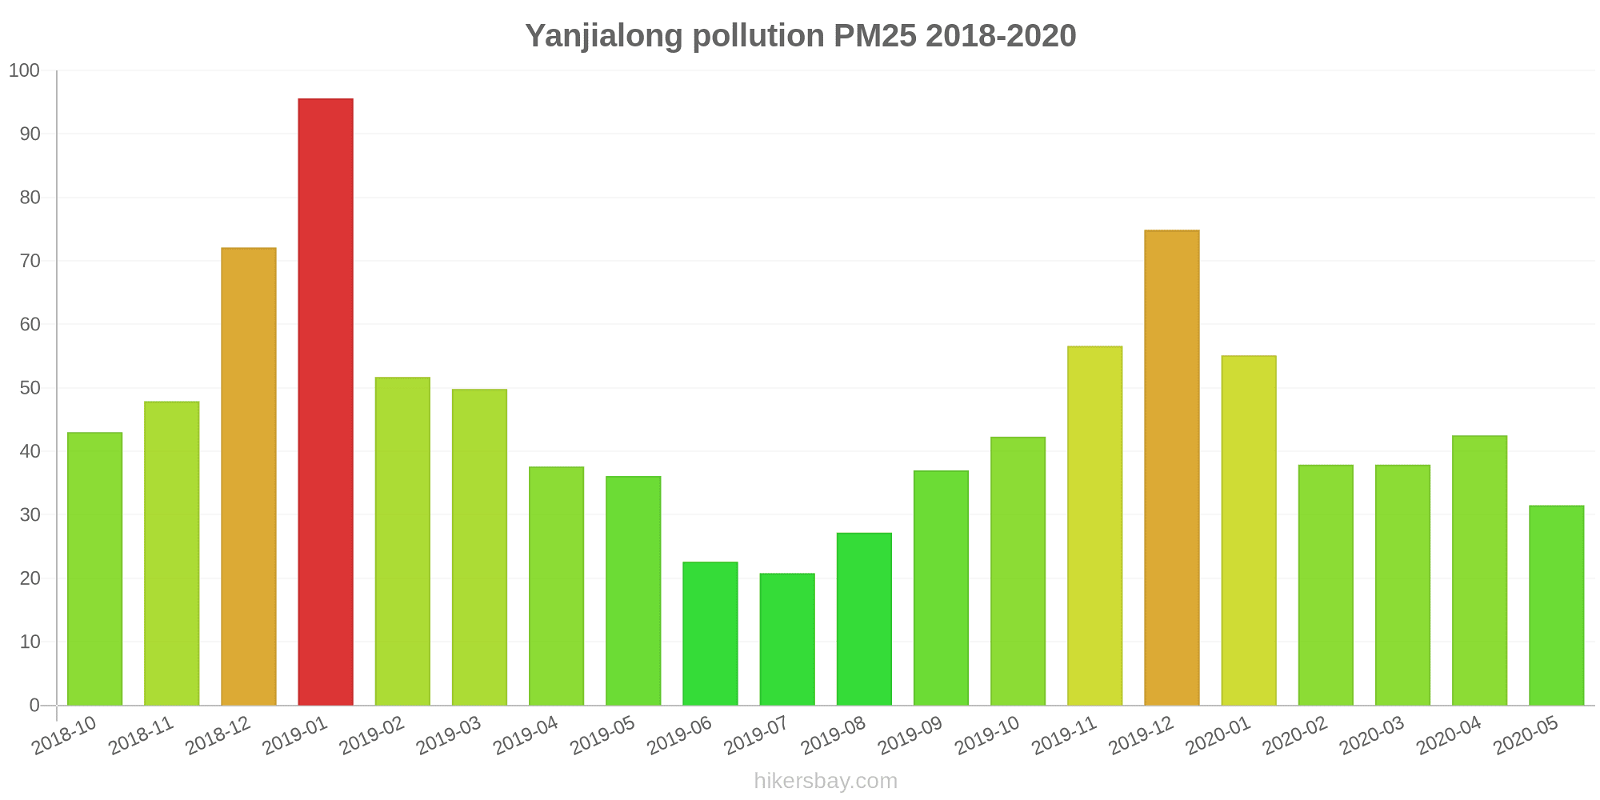
The highest PM2.5 values were recorded: 96 (January 2019).
The lowest level of particulate matter PM2.5 pollution occurs in month: July (21).
How is the O3 level today in Yanjialong? (ozone (O3))
0 (Good)
How high is the level of NO2? (nitrogen dioxide (NO2))
0 (Good)
What is the level of SO2 pollution? (sulfur dioxide (SO2))
0 (Good)
Current data Friday, May 27, 2022, 12:00 PM
PM10 179 (Very bad Hazardous)
PM2,5 35 (Unhealthy for Sensitive Groups)
O3 0 (Good)
NO2 0 (Good)
SO2 0 (Good)
Data on air pollution from recent days in Yanjialong
index
2022-05-27
pm10
56
Unhealthy for Sensitive Groups
pm25
56
Unhealthy
o3
0
Good
no2
0
Good
so2
0
Good
data source »
Air pollution in Yanjialong from October 2018 to May 2020
index
2020-05
2020-04
2020-03
2020-02
2020-01
2019-12
2019-11
2019-10
2019-09
2019-08
2019-07
2019-06
2019-05
2019-04
2019-03
2019-02
2019-01
2018-12
2018-11
2018-10
pm25
32 (Moderate)
43 (Unhealthy for Sensitive Groups)
38 (Unhealthy for Sensitive Groups)
38 (Unhealthy for Sensitive Groups)
55 (Unhealthy)
75 (Unhealthy)
57 (Unhealthy)
42 (Unhealthy for Sensitive Groups)
37 (Unhealthy for Sensitive Groups)
27 (Moderate)
21 (Moderate)
23 (Moderate)
36 (Unhealthy for Sensitive Groups)
38 (Unhealthy for Sensitive Groups)
50 (Unhealthy for Sensitive Groups)
52 (Unhealthy for Sensitive Groups)
96 (Very Unhealthy)
72 (Unhealthy)
48 (Unhealthy for Sensitive Groups)
43 (Unhealthy for Sensitive Groups)
co
739 (Good)
721 (Good)
727 (Good)
738 (Good)
1 (Good)
996 (Good)
793 (Good)
849 (Good)
745 (Good)
656 (Good)
581 (Good)
867 (Good)
597 (Good)
806 (Good)
895 (Good)
810 (Good)
1 (Good)
903 (Good)
820 (Good)
871 (Good)
no2
18 (Good)
32 (Good)
24 (Good)
17 (Good)
29 (Good)
51 (Moderate)
47 (Moderate)
37 (Good)
31 (Good)
20 (Good)
19 (Good)
25 (Good)
35 (Good)
32 (Good)
43 (Moderate)
24 (Good)
41 (Moderate)
41 (Moderate)
47 (Moderate)
48 (Moderate)
o3
126 (Unhealthy for Sensitive Groups)
152 (Unhealthy)
90 (Moderate)
81 (Moderate)
57 (Good)
57 (Good)
95 (Moderate)
114 (Moderate)
185 (Very Unhealthy)
170 (Unhealthy)
140 (Unhealthy for Sensitive Groups)
132 (Unhealthy for Sensitive Groups)
123 (Unhealthy for Sensitive Groups)
109 (Moderate)
92 (Moderate)
47 (Good)
47 (Good)
39 (Good)
82 (Moderate)
109 (Moderate)
pm10
49 (Moderate)
59 (Unhealthy for Sensitive Groups)
44 (Moderate)
37 (Moderate)
47 (Moderate)
74 (Unhealthy for Sensitive Groups)
77 (Unhealthy for Sensitive Groups)
63 (Unhealthy for Sensitive Groups)
69 (Unhealthy for Sensitive Groups)
51 (Unhealthy for Sensitive Groups)
37 (Moderate)
38 (Moderate)
67 (Unhealthy for Sensitive Groups)
49 (Moderate)
61 (Unhealthy for Sensitive Groups)
51 (Unhealthy for Sensitive Groups)
75 (Unhealthy for Sensitive Groups)
61 (Unhealthy for Sensitive Groups)
59 (Unhealthy for Sensitive Groups)
66 (Unhealthy for Sensitive Groups)
so2
3.9 (Good)
5.4 (Good)
3.1 (Good)
4.5 (Good)
5.7 (Good)
9.2 (Good)
9 (Good)
6.5 (Good)
7.2 (Good)
4.7 (Good)
4.3 (Good)
5.3 (Good)
7.3 (Good)
7.9 (Good)
8.7 (Good)
7.1 (Good)
7.7 (Good)
7.9 (Good)
8.8 (Good)
11 (Good)
data source »
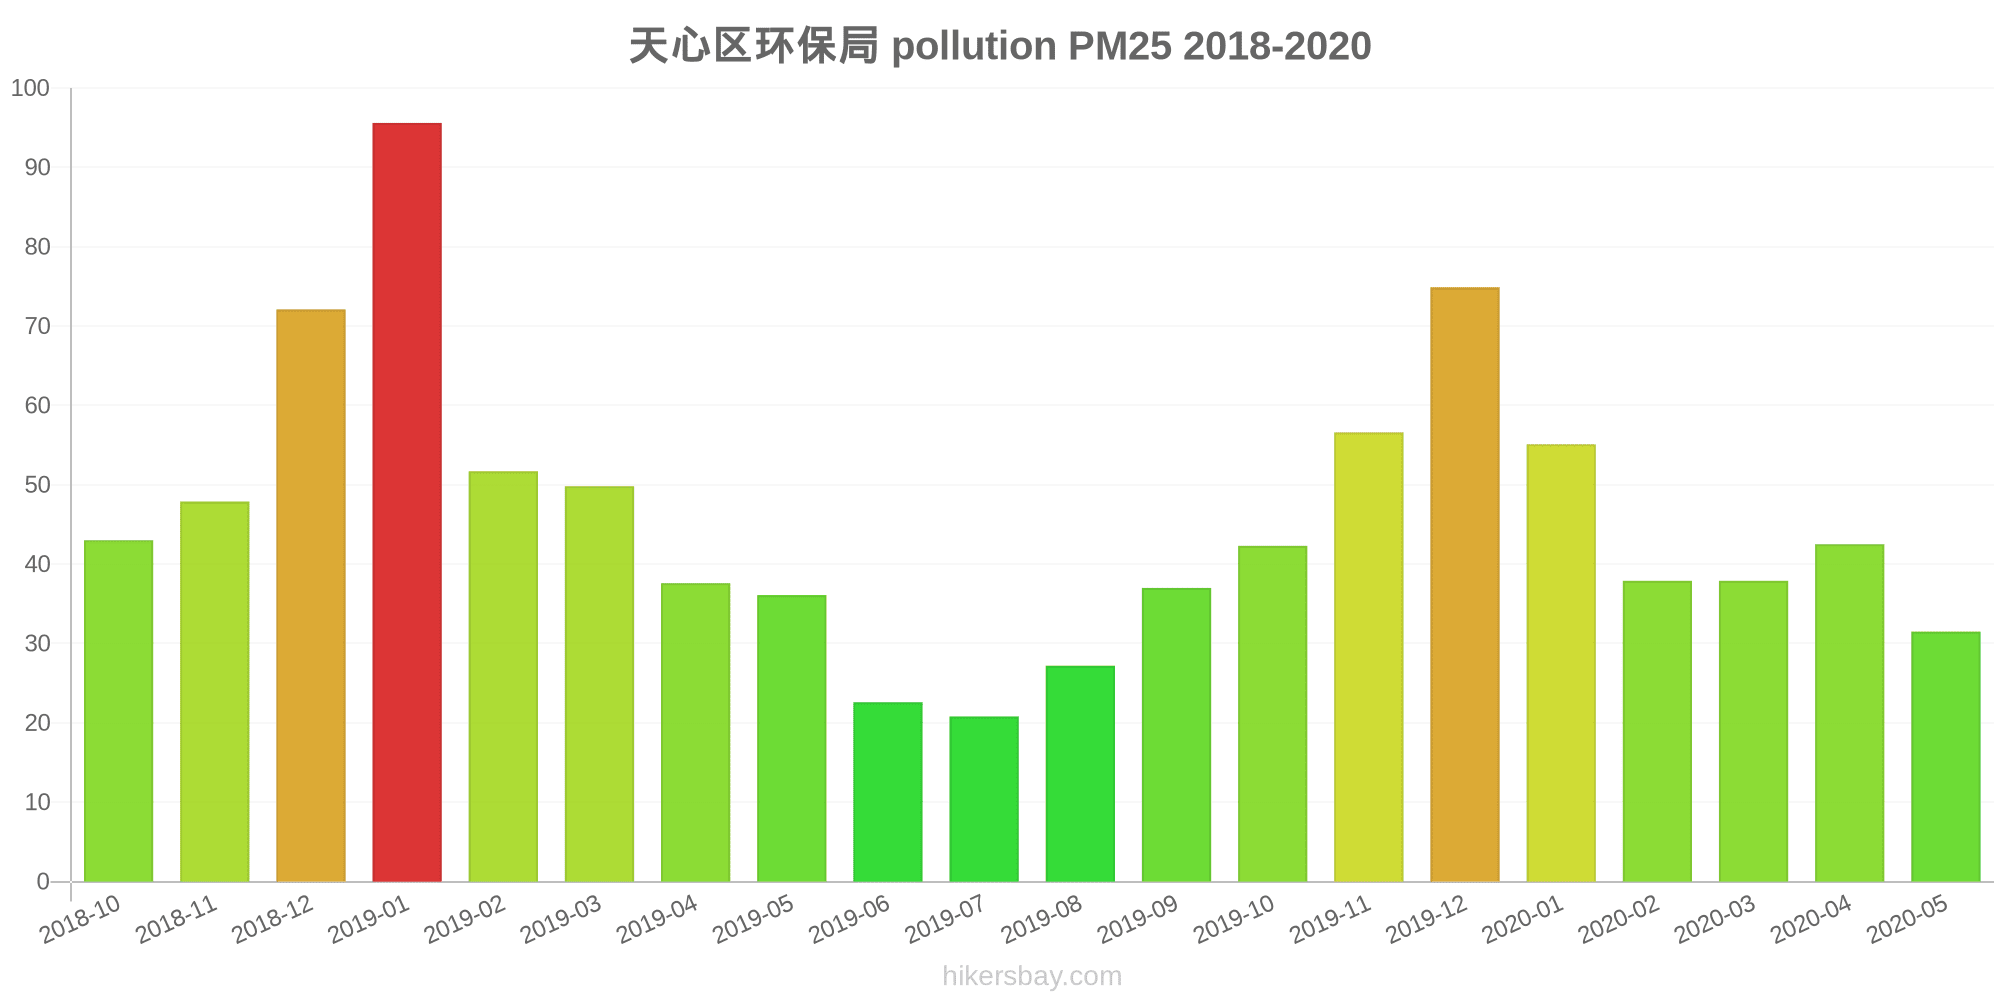
天心区环保局
Friday, May 27, 2022, 12:00 PM
PM10 179 (Very bad Hazardous)
particulate matter (PM10) suspended dust
PM2,5 35 (Unhealthy for Sensitive Groups)
particulate matter (PM2.5) dust
O3 0.04 (Good)
ozone (O3)
NO2 0 (Good)
nitrogen dioxide (NO2)
SO2 0 (Good)
sulfur dioxide (SO2)
天心区环保局
index
2022-05-27
pm10
56
pm25
56
o3
0.03
no2
0
so2
0
天心区环保局
2018-10 2020-05

index
2020-05
2020-04
2020-03
2020-02
2020-01
2019-12
2019-11
2019-10
2019-09
2019-08
2019-07
2019-06
2019-05
2019-04
2019-03
2019-02
2019-01
2018-12
2018-11
2018-10
pm25
32
43
38
38
55
75
57
42
37
27
21
23
36
38
50
52
96
72
48
43
co
739
721
727
738
1
996
793
849
745
656
581
867
597
806
895
810
1
903
820
871
no2
18
32
24
17
29
51
47
37
31
20
19
25
35
32
43
24
41
41
47
48
o3
126
152
90
81
57
57
95
114
185
170
140
132
123
109
92
47
47
39
82
109
pm10
49
59
44
37
47
74
77
63
69
51
37
38
67
49
61
51
75
61
59
66
so2
3.9
5.4
3.1
4.5
5.7
9.2
9
6.5
7.2
4.7
4.3
5.3
7.3
7.9
8.7
7.1
7.7
7.9
8.8
11
* Pollution data source:
https://openaq.org
(ChinaAQIData)
The data is licensed under CC-By 4.0
PM10 179 (Very bad Hazardous)
PM2,5 35 (Unhealthy for Sensitive Groups)
O3 0 (Good)
NO2 0 (Good)
SO2 0 (Good)
Data on air pollution from recent days in Yanjialong
| index | 2022-05-27 |
|---|---|
| pm10 | 56 Unhealthy for Sensitive Groups |
| pm25 | 56 Unhealthy |
| o3 | 0 Good |
| no2 | 0 Good |
| so2 | 0 Good |

| index | 2020-05 | 2020-04 | 2020-03 | 2020-02 | 2020-01 | 2019-12 | 2019-11 | 2019-10 | 2019-09 | 2019-08 | 2019-07 | 2019-06 | 2019-05 | 2019-04 | 2019-03 | 2019-02 | 2019-01 | 2018-12 | 2018-11 | 2018-10 |
|---|---|---|---|---|---|---|---|---|---|---|---|---|---|---|---|---|---|---|---|---|
| pm25 | 32 (Moderate) | 43 (Unhealthy for Sensitive Groups) | 38 (Unhealthy for Sensitive Groups) | 38 (Unhealthy for Sensitive Groups) | 55 (Unhealthy) | 75 (Unhealthy) | 57 (Unhealthy) | 42 (Unhealthy for Sensitive Groups) | 37 (Unhealthy for Sensitive Groups) | 27 (Moderate) | 21 (Moderate) | 23 (Moderate) | 36 (Unhealthy for Sensitive Groups) | 38 (Unhealthy for Sensitive Groups) | 50 (Unhealthy for Sensitive Groups) | 52 (Unhealthy for Sensitive Groups) | 96 (Very Unhealthy) | 72 (Unhealthy) | 48 (Unhealthy for Sensitive Groups) | 43 (Unhealthy for Sensitive Groups) |
| co | 739 (Good) | 721 (Good) | 727 (Good) | 738 (Good) | 1 (Good) | 996 (Good) | 793 (Good) | 849 (Good) | 745 (Good) | 656 (Good) | 581 (Good) | 867 (Good) | 597 (Good) | 806 (Good) | 895 (Good) | 810 (Good) | 1 (Good) | 903 (Good) | 820 (Good) | 871 (Good) |
| no2 | 18 (Good) | 32 (Good) | 24 (Good) | 17 (Good) | 29 (Good) | 51 (Moderate) | 47 (Moderate) | 37 (Good) | 31 (Good) | 20 (Good) | 19 (Good) | 25 (Good) | 35 (Good) | 32 (Good) | 43 (Moderate) | 24 (Good) | 41 (Moderate) | 41 (Moderate) | 47 (Moderate) | 48 (Moderate) |
| o3 | 126 (Unhealthy for Sensitive Groups) | 152 (Unhealthy) | 90 (Moderate) | 81 (Moderate) | 57 (Good) | 57 (Good) | 95 (Moderate) | 114 (Moderate) | 185 (Very Unhealthy) | 170 (Unhealthy) | 140 (Unhealthy for Sensitive Groups) | 132 (Unhealthy for Sensitive Groups) | 123 (Unhealthy for Sensitive Groups) | 109 (Moderate) | 92 (Moderate) | 47 (Good) | 47 (Good) | 39 (Good) | 82 (Moderate) | 109 (Moderate) |
| pm10 | 49 (Moderate) | 59 (Unhealthy for Sensitive Groups) | 44 (Moderate) | 37 (Moderate) | 47 (Moderate) | 74 (Unhealthy for Sensitive Groups) | 77 (Unhealthy for Sensitive Groups) | 63 (Unhealthy for Sensitive Groups) | 69 (Unhealthy for Sensitive Groups) | 51 (Unhealthy for Sensitive Groups) | 37 (Moderate) | 38 (Moderate) | 67 (Unhealthy for Sensitive Groups) | 49 (Moderate) | 61 (Unhealthy for Sensitive Groups) | 51 (Unhealthy for Sensitive Groups) | 75 (Unhealthy for Sensitive Groups) | 61 (Unhealthy for Sensitive Groups) | 59 (Unhealthy for Sensitive Groups) | 66 (Unhealthy for Sensitive Groups) |
| so2 | 3.9 (Good) | 5.4 (Good) | 3.1 (Good) | 4.5 (Good) | 5.7 (Good) | 9.2 (Good) | 9 (Good) | 6.5 (Good) | 7.2 (Good) | 4.7 (Good) | 4.3 (Good) | 5.3 (Good) | 7.3 (Good) | 7.9 (Good) | 8.7 (Good) | 7.1 (Good) | 7.7 (Good) | 7.9 (Good) | 8.8 (Good) | 11 (Good) |
PM10 179 (Very bad Hazardous)
particulate matter (PM10) suspended dustPM2,5 35 (Unhealthy for Sensitive Groups)
particulate matter (PM2.5) dustO3 0.04 (Good)
ozone (O3)NO2 0 (Good)
nitrogen dioxide (NO2)SO2 0 (Good)
sulfur dioxide (SO2)天心区环保局
| index | 2022-05-27 |
|---|---|
| pm10 | 56 |
| pm25 | 56 |
| o3 | 0.03 |
| no2 | 0 |
| so2 | 0 |
天心区环保局
| index | 2020-05 | 2020-04 | 2020-03 | 2020-02 | 2020-01 | 2019-12 | 2019-11 | 2019-10 | 2019-09 | 2019-08 | 2019-07 | 2019-06 | 2019-05 | 2019-04 | 2019-03 | 2019-02 | 2019-01 | 2018-12 | 2018-11 | 2018-10 |
|---|---|---|---|---|---|---|---|---|---|---|---|---|---|---|---|---|---|---|---|---|
| pm25 | 32 | 43 | 38 | 38 | 55 | 75 | 57 | 42 | 37 | 27 | 21 | 23 | 36 | 38 | 50 | 52 | 96 | 72 | 48 | 43 |
| co | 739 | 721 | 727 | 738 | 1 | 996 | 793 | 849 | 745 | 656 | 581 | 867 | 597 | 806 | 895 | 810 | 1 | 903 | 820 | 871 |
| no2 | 18 | 32 | 24 | 17 | 29 | 51 | 47 | 37 | 31 | 20 | 19 | 25 | 35 | 32 | 43 | 24 | 41 | 41 | 47 | 48 |
| o3 | 126 | 152 | 90 | 81 | 57 | 57 | 95 | 114 | 185 | 170 | 140 | 132 | 123 | 109 | 92 | 47 | 47 | 39 | 82 | 109 |
| pm10 | 49 | 59 | 44 | 37 | 47 | 74 | 77 | 63 | 69 | 51 | 37 | 38 | 67 | 49 | 61 | 51 | 75 | 61 | 59 | 66 |
| so2 | 3.9 | 5.4 | 3.1 | 4.5 | 5.7 | 9.2 | 9 | 6.5 | 7.2 | 4.7 | 4.3 | 5.3 | 7.3 | 7.9 | 8.7 | 7.1 | 7.7 | 7.9 | 8.8 | 11 |